Manufacturing Kpi

Online Product Planning Ecommerce Management KPI Dashboard Revenue Ppt Gallery Master Slide PDF
Presenting this set of slides with name online product planning ecommerce management kpi dashboard revenue ppt gallery master slide pdf. The topics discussed in these slides are salesforce accounts by country, sales by product, visitors online now, conversion. This is a completely editable PowerPoint presentation and is available for immediate download. Download now and impress your audience.
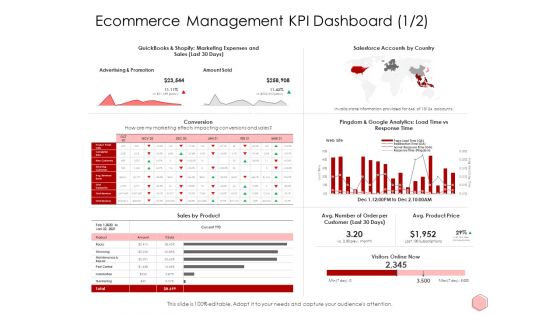
Digitalization Corporate Initiative Ecommerce Management KPI Dashboard Product Price Ppt Infographic Template Examples Pdf
Deliver an awe inspiring pitch with this creative digitalization corporate initiative ecommerce management kpi dashboard product price ppt infographic template examples pdf bundle. Topics like product, sales, marketing, expenses, advertising can be discussed with this completely editable template. It is available for immediate download depending on the needs and requirements of the user.
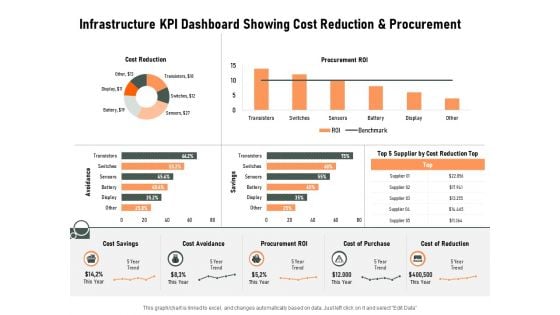
Construction Production Facilities Infrastructure KPI Dashboard Showing Cost Reduction And Procurement Microsoft PDF
Presenting this set of slides with name construction production facilities infrastructure kpi dashboard showing cost reduction and procurement microsoft pdf. The topics discussed in these slides are cost reduction, procurement roi, cost reduction, cost savings, cost avoidance, cost of purchase order. This is a completely editable PowerPoint presentation and is available for immediate download. Download now and impress your audience.
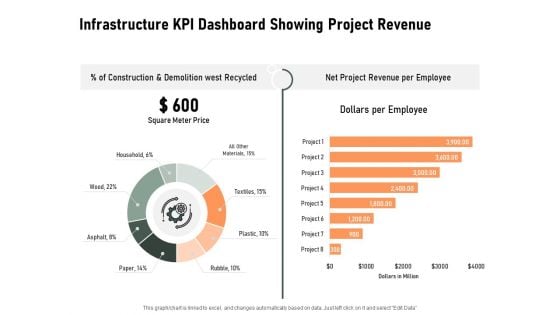
Construction Production Facilities Infrastructure KPI Dashboard Showing Project Revenue Elements PDF
Presenting this set of slides with name construction production facilities infrastructure kpi dashboard showing project revenue elements pdf. The topics discussed in these slides are net project revenue per employee, construction and demolition west recycled. This is a completely editable PowerPoint presentation and is available for immediate download. Download now and impress your audience.
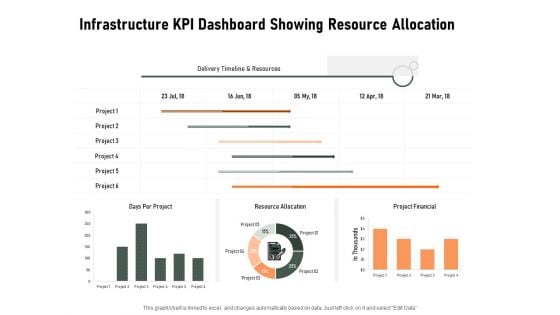
Construction Production Facilities Infrastructure KPI Dashboard Showing Resource Allocation Designs PDF
Presenting this set of slides with name construction production facilities infrastructure kpi dashboard showing resource allocation designs pdf. The topics discussed in these slides are delivery timeline and resources, project financially, resource allocation, days per project. This is a completely editable PowerPoint presentation and is available for immediate download. Download now and impress your audience.
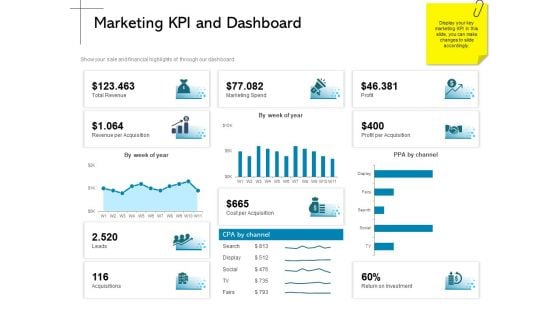
New Product Introduction In The Market Marketing KPI And Dashboard Ppt PowerPoint Presentation Professional Deck PDF
Presenting this set of slides with name new product introduction in the market marketing kpi and dashboard ppt powerpoint presentation professional deck pdf. The topics discussed in these slides are marketing spend, profit, profit per acquisition, revenue per acquisition, cost per acquisition. This is a completely editable PowerPoint presentation and is available for immediate download. Download now and impress your audience.
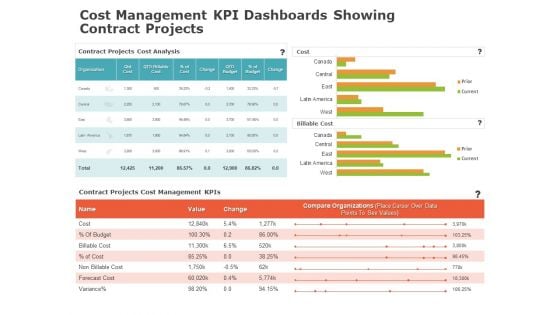
Product Cost Management PCM Cost Management KPI Dashboards Showing Contract Projects Elements PDF
Deliver an awe inspiring pitch with this creative product cost management pcm cost management kpi dashboards showing contract projects elements pdf bundle. Topics like cost, management, budget, organizations, variance can be discussed with this completely editable template. It is available for immediate download depending on the needs and requirements of the user.
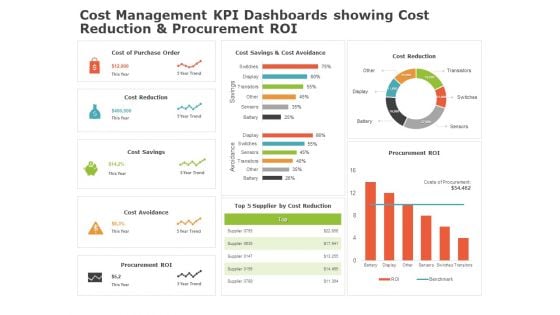
Product Cost Management PCM Cost Management KPI Dashboards Showing Cost Reduction And Procurement ROI Clipart PDF
Deliver and pitch your topic in the best possible manner with this product cost management pcm cost management kpi dashboards showing cost reduction and procurement roi clipart pdf. Use them to share invaluable insights on cost, reduction, procurement and impress your audience. This template can be altered and modified as per your expectations. So, grab it now.
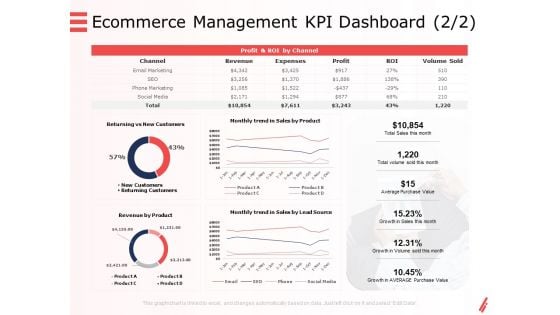
Digital Products And Services Ecommerce Management KPI Dashboard Trend Ppt Show Example Introduction PDF
Deliver an awe inspiring pitch with this creative digital products and services ecommerce management kpi dashboard trend ppt show example introduction pdf bundle. Topics like ssales, value, growth, revenue can be discussed with this completely editable template. It is available for immediate download depending on the needs and requirements of the user.
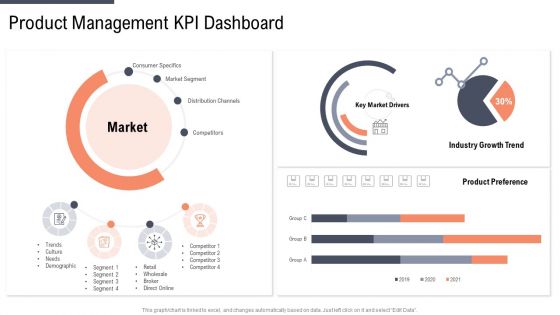
Factor Approaches For Potential Audience Targeting Product Management Kpi Dashboard Sample PDF
Deliver an awe inspiring pitch with this creative factor approaches for potential audience targeting product management kpi dashboard sample pdf bundle. Topics like demographic, wholesale, retail, direct online, broker can be discussed with this completely editable template. It is available for immediate download depending on the needs and requirements of the user.
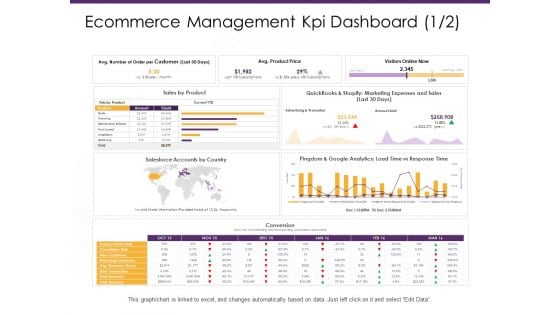
Ecommerce Management Kpi Dashboard Price Ppt PowerPoint Presentation Pictures Example Topics PDF
Presenting this set of slides with name ecommerce management kpi dashboard price ppt powerpoint presentation pictures example topics pdf. The topics discussed in these slides are customer, avg product price, visitors online now, salesforce accounts country, sales product, conversion. This is a completely editable PowerPoint presentation and is available for immediate download. Download now and impress your audience.
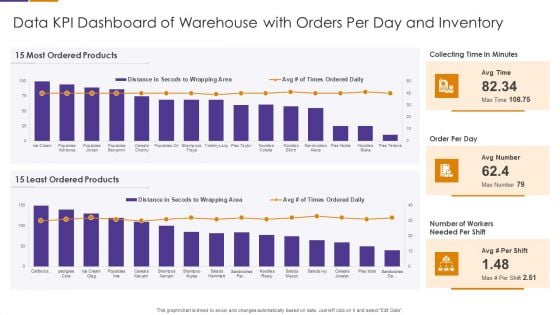
Data KPI Dashboard Of Warehouse With Orders Per Day And Inventory Brochure PDF
Showcasing this set of slides titled Data KPI Dashboard Of Warehouse With Orders Per Day And Inventory Brochure PDF The topics addressed in these templates are Most Ordered Products, Least Ordered Products, Collecting Time In Minutes All the content presented in this PPT design is completely editable. Download it and make adjustments in color, background, font etc. as per your unique business setting.

Dashboard Of Net Promoter Score Survey Response Results KPI Portrait PDF
Pitch your topic with ease and precision using this Dashboard Of Net Promoter Score Survey Response Results KPI Portrait PDF. This layout presents information on Product Average, Promoter Score, Product Experience. It is also available for immediate download and adjustment. So, changes can be made in the color, design, graphics or any other component to create a unique layout.
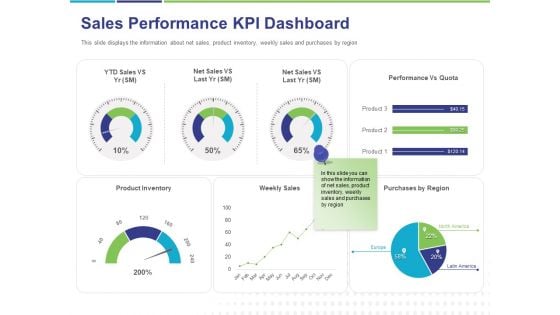
Commodity Up Selling Sales Performance KPI Dashboard Ppt Pictures Templates PDF
Presenting this set of slides with name commodity up selling sales performance kpi dashboard ppt pictures templates pdf. The topics discussed in these slides are product inventory, weekly sales, purchases by region, performance vs quota, net sales. This is a completely editable PowerPoint presentation and is available for immediate download. Download now and impress your audience.
Energy Tracking Device KPI Dashboard Performance Ppt PowerPoint Presentation File Good PDF
Deliver an awe-inspiring pitch with this creative energy tracking device kpi dashboard performance ppt powerpoint presentation file good pdf bundle. Topics like project delivery, production distribution, energy savings, availability factor, performance ratio can be discussed with this completely editable template. It is available for immediate download depending on the needs and requirements of the user.
Energy Tracking Device KPI Dashboard Sales Ppt PowerPoint Presentation Layouts Rules PDF
Deliver an awe-inspiring pitch with this creative energy tracking device kpi dashboard sales ppt powerpoint presentation layouts rules pdf bundle. Topics like average production costs, consumption sector, total consumption, total sales, contribution renewable energy, energy sources, sales sector can be discussed with this completely editable template. It is available for immediate download depending on the needs and requirements of the user.
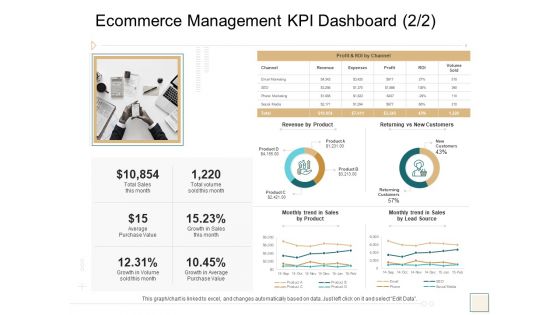
B2B Trade Management Ecommerce Management KPI Dashboard Returning Vs New Customers Brochure PDF
Deliver and pitch your topic in the best possible manner with this b2b trade management ecommerce management kpi dashboard returning vs new customers brochure pdf. Use them to share invaluable insights on profit and roi by channel, revenue product, returning vs new customers, revenue, expenses and impress your audience. This template can be altered and modified as per your expectations. So, grab it now.
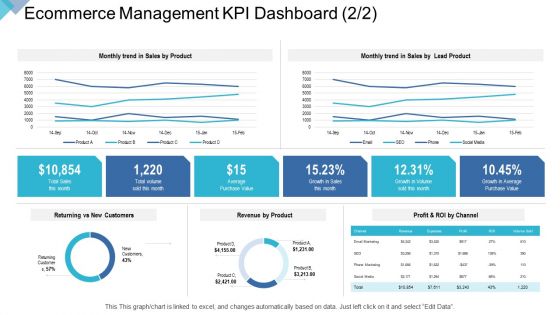
Digital Enterprise Management Ecommerce Management KPI Dashboard Average Ppt PowerPoint Presentation Summary Graphics PDF
Deliver an awe-inspiring pitch with this creative digital enterprise management ecommerce management kpi dashboard average ppt powerpoint presentation summary graphics pdf bundle. Topics like returning vs new customers, revenue by product, profit and roi by channel, returning customers can be discussed with this completely editable template. It is available for immediate download depending on the needs and requirements of the user.
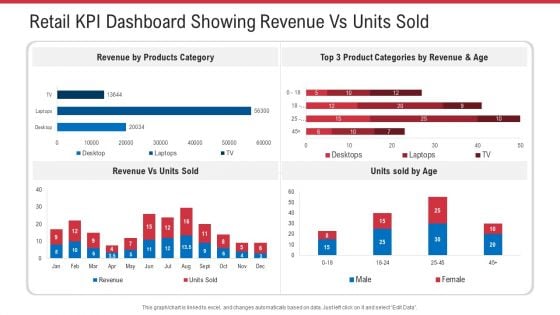
Retail KPI Dashboard Showing Revenue Vs Units Sold Ppt Pictures Influencers PDF
Deliver and pitch your topic in the best possible manner with this retail KPI dashboard showing revenue vs units sold ppt pictures influencers pdf. Use them to share invaluable insights on revenue vs units sold, revenue by product category and impress your audience. This template can be altered and modified as per your expectations. So, grab it now.
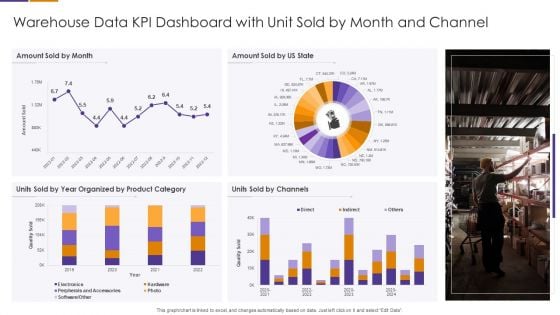
Warehouse Data KPI Dashboard With Unit Sold By Month And Channel Elements PDF
Showcasing this set of slides titled Warehouse Data KPI Dashboard With Unit Sold By Month And Channel Elements PDF The topics addressed in these templates are Organized By Product Category, Units Sold By Channels, Peripherals And Accessories All the content presented in this PPT design is completely editable. Download it and make adjustments in color, background, font etc. as per your unique business setting.
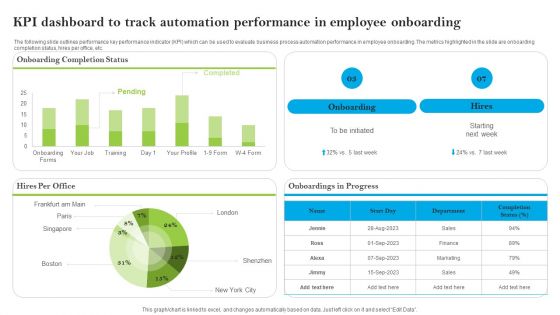
Introducing AI Tools KPI Dashboard To Track Automation Performance In Employee Formats PDF
The following slide outlines performance key performance indicator KPI which can be used to evaluate business process automation performance in employee onboarding. The metrics highlighted in the slide are onboarding completion status, hires per office, etc. This modern and well-arranged Introducing AI Tools KPI Dashboard To Track Automation Performance In Employee Formats PDF provides lots of creative possibilities. It is very simple to customize and edit with the Powerpoint Software. Just drag and drop your pictures into the shapes. All facets of this template can be edited with Powerpoint, no extra software is necessary. Add your own material, put your images in the places assigned for them, adjust the colors, and then you can show your slides to the world, with an animated slide included.
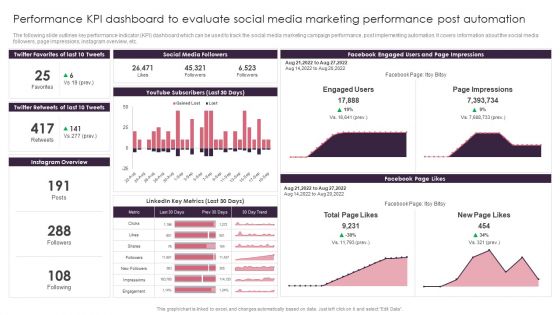
Performance KPI Dashboard To Evaluate Social Media Marketing Performance Post Automation Formats PDF
The following slide outlines key performance indicator KPI dashboard which can be used to track the social media marketing campaign performance, post implementing automation. It covers information about the social media followers, page impressions, instagram overview, etc. Slidegeeks is here to make your presentations a breeze with Performance KPI Dashboard To Evaluate Social Media Marketing Performance Post Automation Formats PDF With our easy to use and customizable templates, you can focus on delivering your ideas rather than worrying about formatting. With a variety of designs to choose from, you are sure to find one that suits your needs. And with animations and unique photos, illustrations, and fonts, you can make your presentation pop. So whether you are giving a sales pitch or presenting to the board, make sure to check out Slidegeeks first.
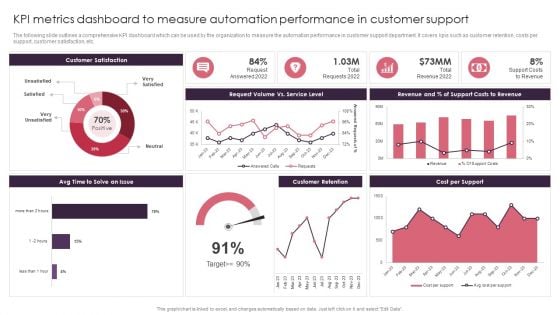
KPI Metrics Dashboard To Measure Automation Performance In Customer Support Themes PDF
The following slide outlines a comprehensive KPI dashboard which can be used by the organization to measure the automation performance in customer support department. It covers kpis such as customer retention, costs per support, customer satisfaction, etc. Present like a pro with KPI Metrics Dashboard To Measure Automation Performance In Customer Support Themes PDF Create beautiful presentations together with your team, using our easy to use presentation slides. Share your ideas in real time and make changes on the fly by downloading our templates. So whether you are in the office, on the go, or in a remote location, you can stay in sync with your team and present your ideas with confidence. With Slidegeeks presentation got a whole lot easier. Grab these presentations today.
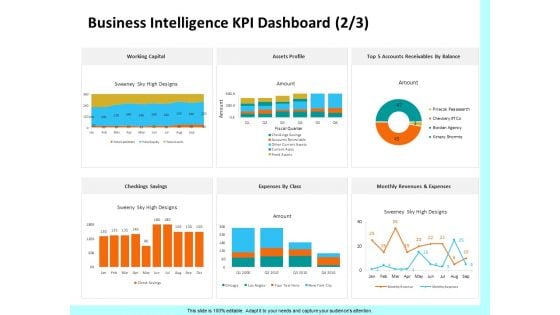
Firm Productivity Administration Business Intelligence KPI Dashboard Assets Ppt PowerPoint Presentation Slides Background Designs PDF
Presenting this set of slides with name firm productivity administration business intelligence kpi dashboard assets ppt powerpoint presentation slides background designs pdf. The topics discussed in these slides are expenses class, top 5 accounts receivables balance, assets profile, working capital, checking savings, monthly revenues and expenses. This is a completely editable PowerPoint presentation and is available for immediate download. Download now and impress your audience.
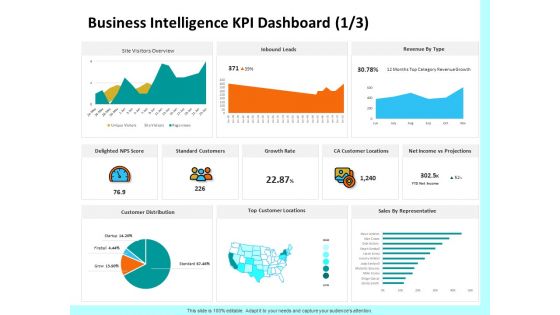
Firm Productivity Administration Business Intelligence KPI Dashboard Score Ppt PowerPoint Presentation Infographic Template Display PDF
Presenting this set of slides with name firm productivity administration business intelligence kpi dashboard score ppt powerpoint presentation infographic template display pdf. The topics discussed in these slides are sales representative, delighted nps score, standard customers, growth rate, ca customer locations, net income vs projections, revenue type, top customer locations, customer distribution. This is a completely editable PowerPoint presentation and is available for immediate download. Download now and impress your audience.
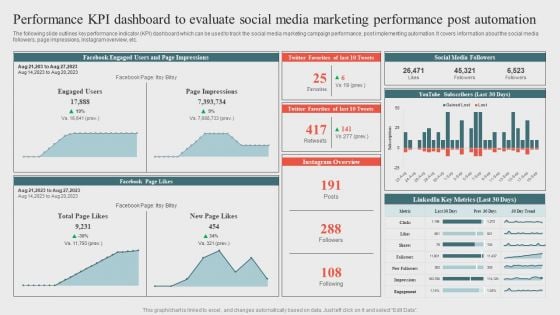
Performance Kpi Dashboard To Evaluate Social Mediaoptimizing Business Processes Through Automation Slides PDF
The following slide outlines key performance indicator KPI dashboard which can be used to track the social media marketing campaign performance, post implementing automation. It covers information about the social media followers, page impressions, Instagram overview, etc.Present like a pro with Performance Kpi Dashboard To Evaluate Social Mediaoptimizing Business Processes Through Automation Slides PDF Create beautiful presentations together with your team, using our easy to use presentation slides. Share your ideas in real time and make changes on the fly by downloading our templates. So whether you are in the office, on the go, or in a remote location, you can stay in sync with your team and present your ideas with confidence. With Slidegeeks presentation got a whole lot easier. Grab these presentations today.
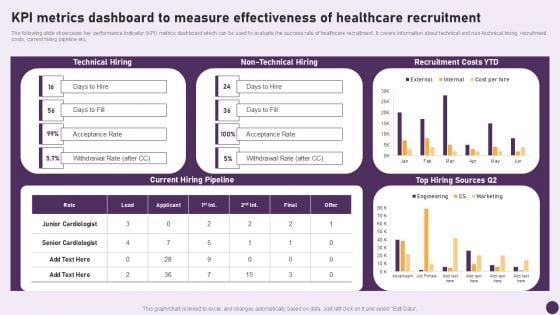
Guide To Healthcare Services Administration KPI Metrics Dashboard To Measure Effectiveness Healthcare Information PDF
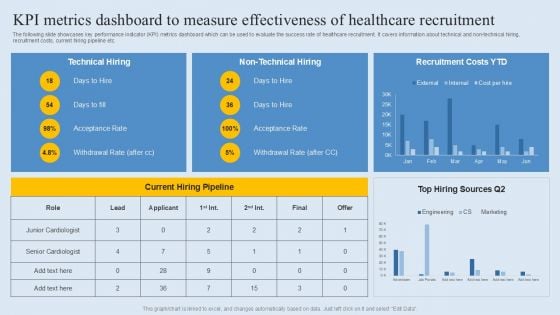
KPI Metrics Dashboard To Measure Effectiveness Of Healthcare Recruitment Demonstration PDF
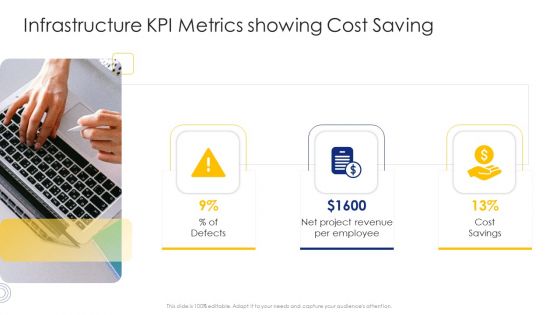
Construction Engineering And Industrial Facility Management Infrastructure KPI Metrics Showing Cost Saving Demonstration PDF
This is a construction engineering and industrial facility management infrastructure kpi metrics showing cost saving demonstration pdf template with various stages. Focus and dispense information on three stages using this creative set, that comes with editable features. It contains large content boxes to add your information on topics like net project revenue per employee, cost savings, defects. You can also showcase facts, figures, and other relevant content using this PPT layout. Grab it now.
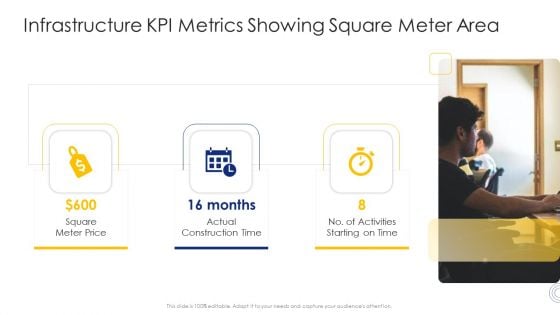
Construction Engineering And Industrial Facility Management Infrastructure KPI Metrics Showing Square Meter Area Ideas PDF
Presenting construction engineering and industrial facility management infrastructure kpi metrics showing square meter area ideas pdf to provide visual cues and insights. Share and navigate important information on three stages that need your due attention. This template can be used to pitch topics like square meter price, actual construction time, no of activities starting on time . In addtion, this PPT design contains high resolution images, graphics, etc, that are easily editable and available for immediate download.
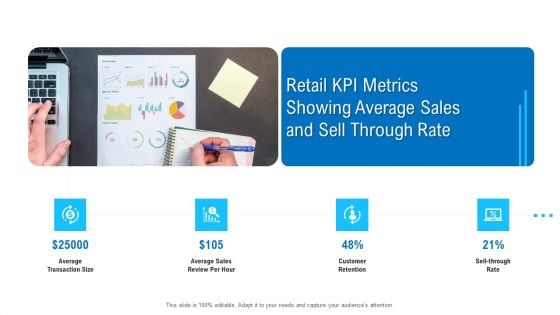
Merchandising Industry Analysis Retail KPI Metrics Showing Average Sales And Sell Through Rate Clipart PDF
Presenting merchandising industry analysis retail kpi metrics showing average sales and sell through rate clipart pdf to provide visual cues and insights. Share and navigate important information on four stages that need your due attention. This template can be used to pitch topics like average transaction size, average sales review per hour, customer retention. In addtion, this PPT design contains high resolution images, graphics, etc, that are easily editable and available for immediate download.
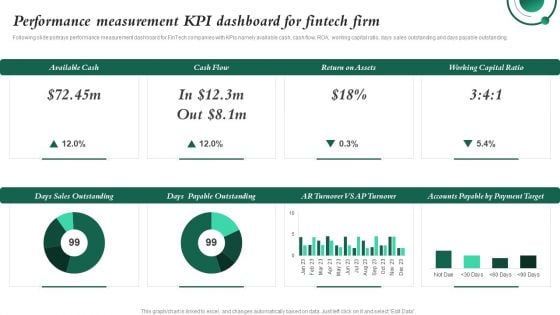
Performance Measurement KPI Dashboard For Fintech Firm Investment In Latest Technology To Ensure Portrait PDF
Following slide portrays performance measurement dashboard for FinTech companies with KPIs namely available cash, cash flow, ROA, working capital ratio, days sales outstanding and days payable outstanding.Whether you have daily or monthly meetings, a brilliant presentation is necessary. Performance Measurement KPI Dashboard For Fintech Firm Investment In Latest Technology To Ensure Portrait PDF can be your best option for delivering a presentation. Represent everything in detail using Performance Measurement KPI Dashboard For Fintech Firm Investment In Latest Technology To Ensure Portrait PDF and make yourself stand out in meetings. The template is versatile and follows a structure that will cater to your requirements. All the templates prepared by Slidegeeks are easy to download and edit. Our research experts have taken care of the corporate themes as well. So, give it a try and see the results.
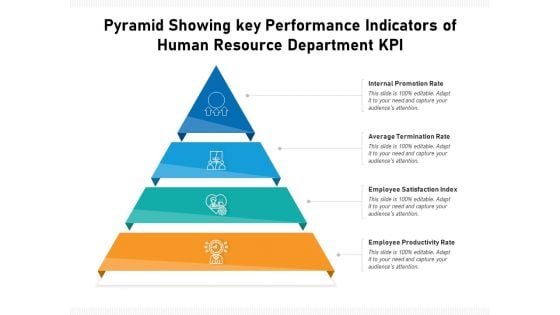
Pyramid Showing Key Performance Indicators Of Human Resource Department KPI Ppt PowerPoint Presentation Infographics Samples PDF
Persuade your audience using this pyramid showing key performance indicators of human resource department kpi ppt powerpoint presentation infographics samples pdf. This PPT design covers four stages, thus making it a great tool to use. It also caters to a variety of topics including internal promotion rate, average termination rate, employee satisfaction index, employee productivity rate. Download this PPT design now to present a convincing pitch that not only emphasizes the topic but also showcases your presentation skills.
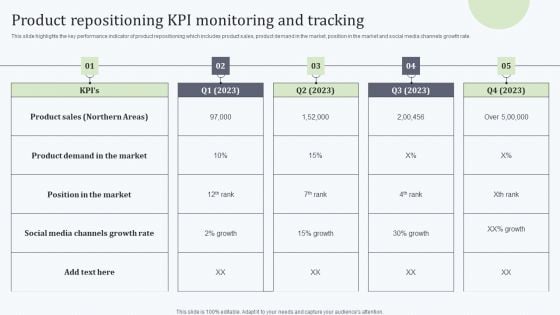
Deploying Revitalization Strategy Enhance Product And Service Sales Product Repositioning KPI Monitoring Information PDF
This slide highlights the key performance indicator of product repositioning which includes product sales, product demand in the market, position in the market and social media channels growth rate. Whether you have daily or monthly meetings, a brilliant presentation is necessary. Deploying Revitalization Strategy Enhance Product And Service Sales Product Repositioning KPI Monitoring Information PDF can be your best option for delivering a presentation. Represent everything in detail using Deploying Revitalization Strategy Enhance Product And Service Sales Product Repositioning KPI Monitoring Information PDF and make yourself stand out in meetings. The template is versatile and follows a structure that will cater to your requirements. All the templates prepared by Slidegeeks are easy to download and edit. Our research experts have taken care of the corporate themes as well. So, give it a try and see the results.
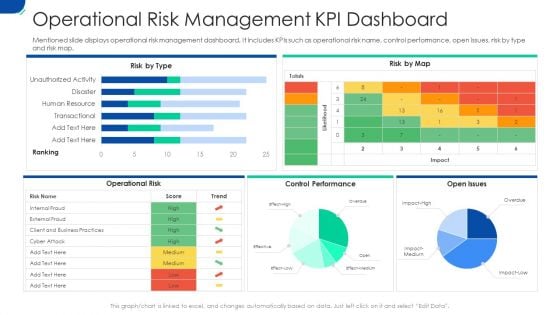
Initiating Hazard Managing Structure Firm Operational Risk Management KPI Dashboard Rules PDF
Mentioned slide displays operational risk management dashboard. It includes KPIs such as operational risk name, control performance, open issues, risk by type and risk map. Deliver and pitch your topic in the best possible manner with this initiating hazard managing structure firm operational risk management kpi dashboard rules pdf. Use them to share invaluable insights on control performance, operational risk management dashboard and impress your audience. This template can be altered and modified as per your expectations. So, grab it now.
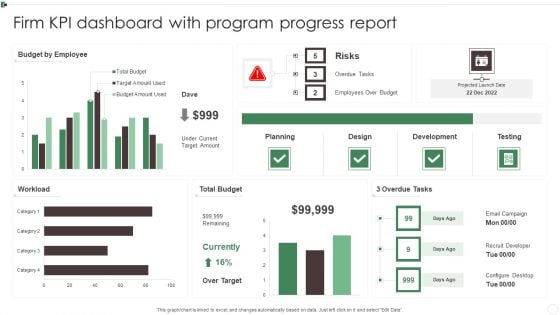
Firm KPI Dashboard With Program Progress Report Ppt Pictures Deck PDF
This graph or chart is linked to excel, and changes automatically based on data. Just left click on it and select Edit Data. Showcasing this set of slides titled Firm KPI Dashboard With Program Progress Report Ppt Pictures Deck PDF. The topics addressed in these templates are Budget By Employee, Total Budget, 3 Overdue Tasks, Workload. All the content presented in this PPT design is completely editable. Download it and make adjustments in color, background, font etc. as per your unique business setting.
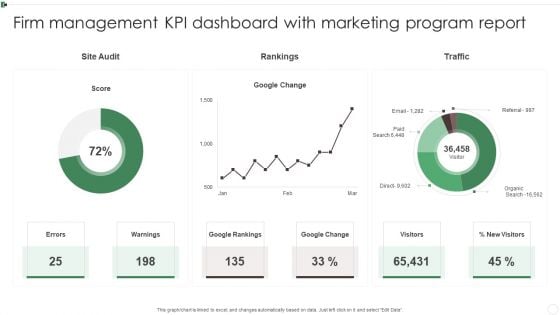
Firm Management KPI Dashboard With Marketing Program Report Ppt Styles Introduction PDF
This graph or chart is linked to excel, and changes automatically based on data. Just left click on it and select Edit Data. Showcasing this set of slides titled Firm Management KPI Dashboard With Marketing Program Report Ppt Styles Introduction PDF. The topics addressed in these templates are Google Rankings, Google Change, Warnings, Visitors. All the content presented in this PPT design is completely editable. Download it and make adjustments in color, background, font etc. as per your unique business setting.
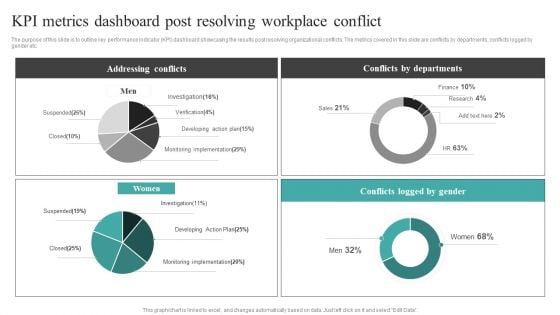
Common Conflict Situations Kpi Metrics Dashboard Post Resolving Workplace Information PDF
The purpose of this slide is to outline key performance indicator KPI dashboard showcasing the results post resolving organizational conflicts. The metrics covered in this slide are conflicts by departments, conflicts logged by gender etc. The Common Conflict Situations Kpi Metrics Dashboard Post Resolving Workplace Information PDF is a compilation of the most recent design trends as a series of slides. It is suitable for any subject or industry presentation, containing attractive visuals and photo spots for businesses to clearly express their messages. This template contains a variety of slides for the user to input data, such as structures to contrast two elements, bullet points, and slides for written information. Slidegeeks is prepared to create an impression.
Energy Tracking Device KPI Metrics Production Ppt PowerPoint Presentation Portfolio Ideas PDF
Deliver and pitch your topic in the best possible manner with this energy tracking device kpi metrics production ppt powerpoint presentation portfolio ideas pdf. Use them to share invaluable insights on average performance ratio, actual vs, expected energy production, coal, wind, solar, biomass, hydro energy, petroleum, nuclear and impress your audience. This template can be altered and modified as per your expectations. So, grab it now.
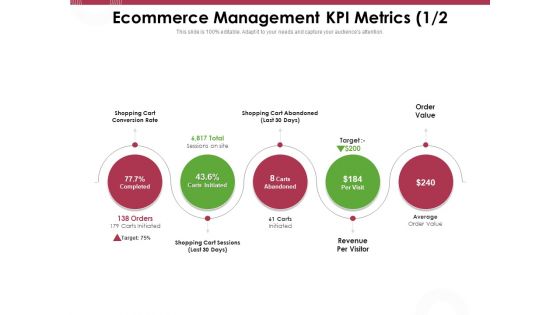
Online Product Planning Ecommerce Management KPI Metrics Target Ppt Ideas Visual Aids PDF
Presenting this set of slides with name online product planning ecommerce management kpi metrics target ppt ideas visual aids pdf. This is a one stage process. The stages in this process are coupon conversion, product views per session, new customer of first visit, on time delivery. This is a completely editable PowerPoint presentation and is available for immediate download. Download now and impress your audience.
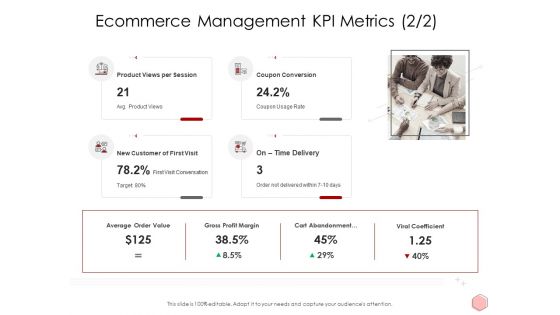
Digitalization Corporate Initiative Ecommerce Management KPI Metrics Product Ppt Show Shapes Pdf
This is a digitalization corporate initiative ecommerce management kpi metrics product ppt show shapes pdf template with various stages. Focus and dispense information on four stages using this creative set, that comes with editable features. It contains large content boxes to add your information on topics like average, product, customer, gross profit margin. You can also showcase facts, figures, and other relevant content using this PPT layout. Grab it now.
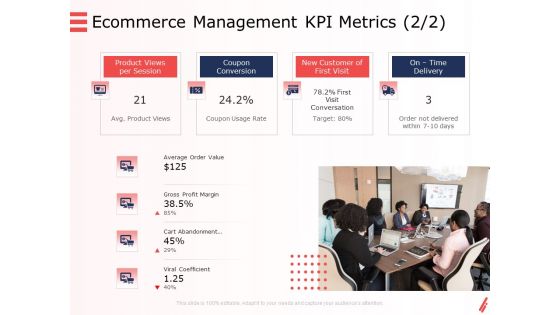
Digital Products And Services Ecommerce Management KPI Metrics Delivery Ppt Summary Images PDF
This is a digital products and services ecommerce management kpi metrics delivery ppt summary images pdf template with various stages. Focus and dispense information on four stages using this creative set, that comes with editable features. It contains large content boxes to add your information on topics like average order value, gross profit margin, cart abandonment, viral coefficient. You can also showcase facts, figures, and other relevant content using this PPT layout. Grab it now.
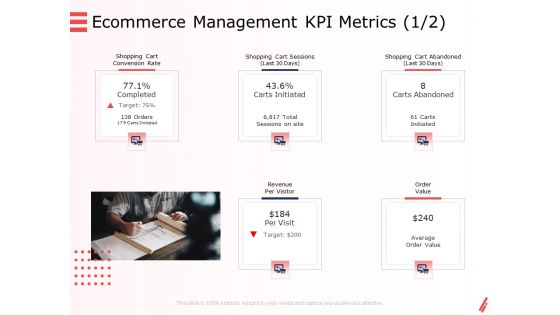
Digital Products And Services Ecommerce Management KPI Metrics Management Ppt Slides Gridlines PDF
Presenting digital products and services ecommerce management kpi metrics management ppt slides gridlines pdf to provide visual cues and insights. Share and navigate important information on five stages that need your due attention. This template can be used to pitch topics like conversion rate, revenue, value, target. In addtion, this PPT design contains high resolution images, graphics, etc, that are easily editable and available for immediate download.
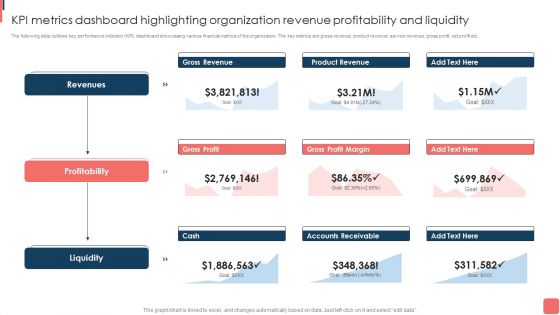
KPI Metrics Dashboard Highlighting Organization Revenue Profitability And Liquidity Template PDF
The following slide outlines key performance indicator KPI dashboard showcasing various financial metrics of the organization. The key metrics are gross revenue, product revenue, service revenue, gross profit, net profit etc. This KPI Metrics Dashboard Highlighting Organization Revenue Profitability And Liquidity Template PDF from Slidegeeks makes it easy to present information on your topic with precision. It provides customization options, so you can make changes to the colors, design, graphics, or any other component to create a unique layout. It is also available for immediate download, so you can begin using it right away. Slidegeeks has done good research to ensure that you have everything you need to make your presentation stand out. Make a name out there for a brilliant performance.
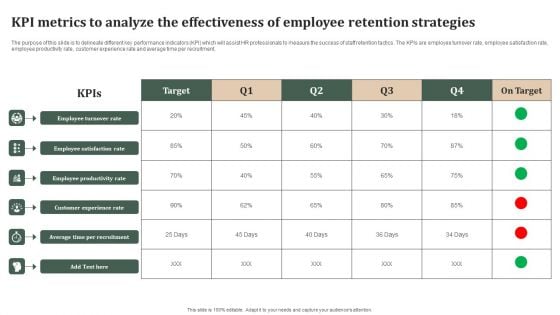
KPI Metrics To Analyze The Effectiveness Of Employee Retention Strategies Topics PDF
The purpose of this slide is to delineate different key performance indicators KPI which will assist HR professionals to measure the success of staff retention tactics. The KPIs are employee turnover rate, employee satisfaction rate, employee productivity rate, customer experience rate and average time per recruitment. Are you in need of a template that can accommodate all of your creative concepts This one is crafted professionally and can be altered to fit any style. Use it with Google Slides or PowerPoint. Include striking photographs, symbols, depictions, and other visuals. Fill, move around, or remove text boxes as desired. Test out color palettes and font mixtures. Edit and save your work, or work with colleagues. Download KPI Metrics To Analyze The Effectiveness Of Employee Retention Strategies Topics PDF and observe how to make your presentation outstanding. Give an impeccable presentation to your group and make your presentation unforgettable.
Product Repositioning KPI Monitoring And Tracking Ppt PowerPoint Presentation File Infographic Template PDF
This slide highlights the key performance indicator of product repositioning which includes product sales, product demand in the market, position in the market and social media channels growth rate. If you are looking for a format to display your unique thoughts, then the professionally designed Product Repositioning KPI Monitoring And Tracking Ppt PowerPoint Presentation File Infographic Template PDF is the one for you. You can use it as a Google Slides template or a PowerPoint template. Incorporate impressive visuals, symbols, images, and other charts. Modify or reorganize the text boxes as you desire. Experiment with shade schemes and font pairings. Alter, share or cooperate with other people on your work. Download Product Repositioning KPI Monitoring And Tracking Ppt PowerPoint Presentation File Infographic Template PDF and find out how to give a successful presentation. Present a perfect display to your team and make your presentation unforgettable.
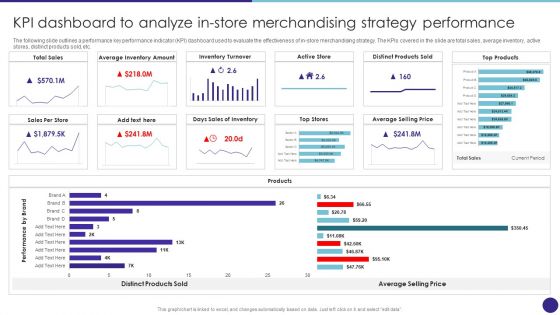
Kpi Dashboard To Analyze In Store Merchandising Strategy Performance Retail Merchandising Techniques Structure PDF
The following slide outlines a performance key performance indicator KPI dashboard used to evaluate the effectiveness of in-store merchandising strategy. The KPIs covered in the slide are total sales, average inventory, active stores, distinct products sold, etc.The Kpi Dashboard To Analyze In Store Merchandising Strategy Performance Retail Merchandising Techniques Structure PDF is a compilation of the most recent design trends as a series of slides. It is suitable for any subject or industry presentation, containing attractive visuals and photo spots for businesses to clearly express their messages. This template contains a variety of slides for the user to input data, such as structures to contrast two elements, bullet points, and slides for written information. Slidegeeks is prepared to create an impression.
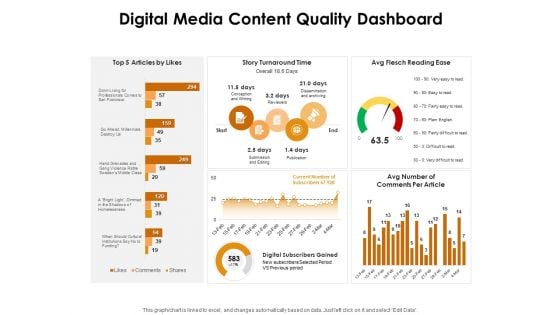
KPI Dashboards Per Industry Digital Media Content Quality Dashboard Ppt PowerPoint Presentation Layouts Clipart Images PDF
Deliver an awe-inspiring pitch with this creative kpi dashboards per industry digital media content quality dashboard ppt powerpoint presentation layouts clipart images pdf bundle. Topics like top 5 articles by likes, story turnaround time, avg flesch reading ease, avg number of comments per article can be discussed with this completely editable template. It is available for immediate download depending on the needs and requirements of the user.
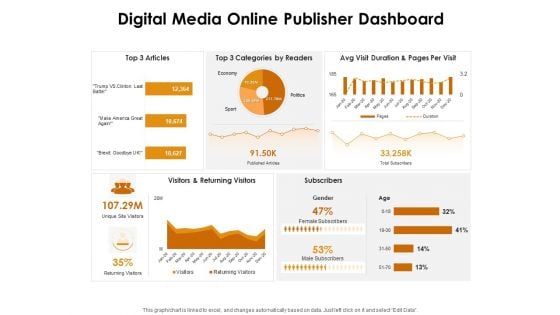
KPI Dashboards Per Industry Digital Media Online Publisher Dashboard Ppt PowerPoint Presentation Summary Good PDF
Deliver and pitch your topic in the best possible manner with this kpi dashboards per industry digital media online publisher dashboard ppt powerpoint presentation summary good pdf. Use them to share invaluable insights on top 3 articles, top 3 categories by readers, avg visit duration and pages per visit and impress your audience. This template can be altered and modified as per your expectations. So, grab it now.
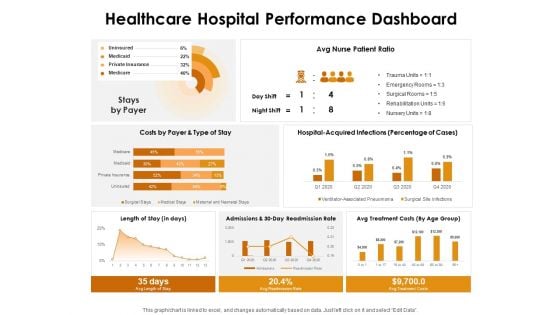
KPI Dashboards Per Industry Healthcare Hospital Performance Dashboard Ppt PowerPoint Presentation Ideas Format Ideas PDF
Deliver and pitch your topic in the best possible manner with this kpi dashboards per industry healthcare hospital performance dashboard ppt powerpoint presentation ideas format ideas pdf. Use them to share invaluable insights on costs payer and type stay, avg nurse patient ratio, hospital acquired infections percentage cases and impress your audience. This template can be altered and modified as per your expectations. So, grab it now.
KPI Dashboards Per Industry Market Research Customer Satisfaction Dashboard Ppt PowerPoint Presentation Icon Outfit PDF
Deliver and pitch your topic in the best possible manner with this kpi dashboards per industry market research customer satisfaction dashboard ppt powerpoint presentation icon outfit pdf. Use them to share invaluable insights on quality, pricing, design, service, net promoter score, customer effort score, nps and ces development month and impress your audience. This template can be altered and modified as per your expectations. So, grab it now.
KPI Dashboards Per Industry Retail Store Dashboard Ppt PowerPoint Presentation Icon Grid PDF
Deliver an awe-inspiring pitch with this creative kpi dashboards per industry retail store dashboard ppt powerpoint presentation icon grid pdf bundle. Topics like total customers and visitors, avg price and units per transaction, out stock items, sales city, top 5 articles by sold items, top 5 articles revenue can be discussed with this completely editable template. It is available for immediate download depending on the needs and requirements of the user.
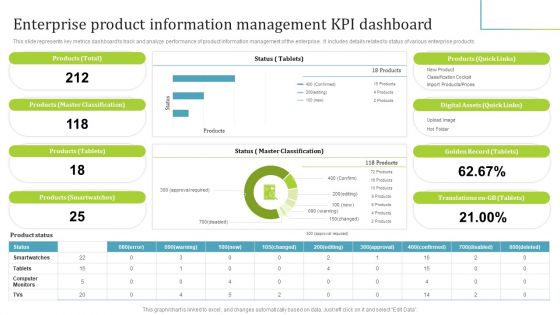
PIM Software Deployment To Enhance Conversion Rates Enterprise Product Information Management KPI Dashboard Infographics PDF
This slide represents key metrics dashboard to track and analyze performance of product information management of the enterprise. It includes details related to status of various enterprise products. Here you can discover an assortment of the finest PowerPoint and Google Slides templates. With these templates, you can create presentations for a variety of purposes while simultaneously providing your audience with an eye catching visual experience. Download PIM Software Deployment To Enhance Conversion Rates Enterprise Product Information Management KPI Dashboard Infographics PDF to deliver an impeccable presentation. These templates will make your job of preparing presentations much quicker, yet still, maintain a high level of quality. Slidegeeks has experienced researchers who prepare these templates and write high quality content for you. Later on, you can personalize the content by editing the PIM Software Deployment To Enhance Conversion Rates Enterprise Product Information Management KPI Dashboard Infographics PDF.
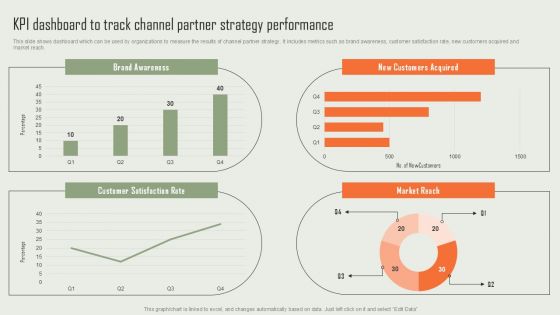
Product Marketing And Sales Expansion Through Channel KPI Dashboard To Track Channel Partner Strategy Diagrams PDF
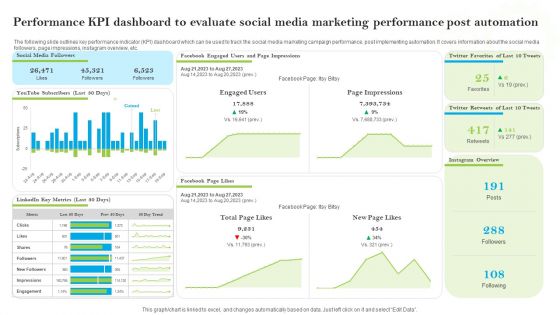
Introducing AI Tools Performance KPI Dashboard To Evaluate Social Media Marketing Ideas PDF
The following slide outlines key performance indicator KPI dashboard which can be used to track the social media marketing campaign performance, post implementing automation. It covers information about the social media followers, page impressions, instagram overview, etc. Retrieve professionally designed Introducing AI Tools Performance KPI Dashboard To Evaluate Social Media Marketing Ideas PDF to effectively convey your message and captivate your listeners. Save time by selecting pre-made slideshows that are appropriate for various topics, from business to educational purposes. These themes come in many different styles, from creative to corporate, and all of them are easily adjustable and can be edited quickly. Access them as PowerPoint templates or as Google Slides themes. You dont have to go on a hunt for the perfect presentation because Slidegeeks got you covered from everywhere.
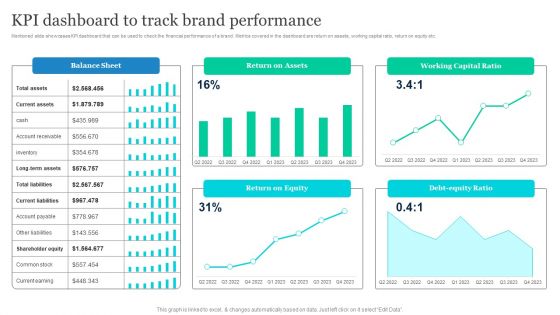
Effective Product Positioning Approach Kpi Dashboard To Track Brand Performance Infographics PDF
Mentioned slide showcases KPI dashboard that can be used to check the financial performance of a brand. Metrics covered in the dashboard are return on assets, working capital ratio, return on equity etc. Slidegeeks is one of the best resources for PowerPoint templates. You can download easily and regulate Effective Product Positioning Approach Kpi Dashboard To Track Brand Performance Infographics PDF for your personal presentations from our wonderful collection. A few clicks is all it takes to discover and get the most relevant and appropriate templates. Use our Templates to add a unique zing and appeal to your presentation and meetings. All the slides are easy to edit and you can use them even for advertisement purposes.
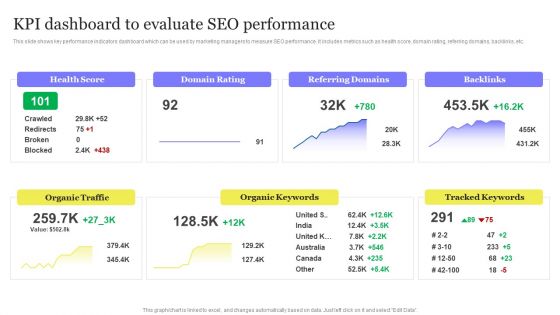
Enhancing Digital Visibility Using SEO Content Strategy KPI Dashboard To Evaluate SEO Performance Diagrams PDF
This slide shows key performance indicators dashboard which can be used by marketing managers to measure SEO performance. It includes metrics such as health score, domain rating, referring domains, backlinks, etc. This Enhancing Digital Visibility Using SEO Content Strategy KPI Dashboard To Evaluate SEO Performance Diagrams PDF is perfect for any presentation, be it in front of clients or colleagues. It is a versatile and stylish solution for organizing your meetings. The Enhancing Digital Visibility Using SEO Content Strategy KPI Dashboard To Evaluate SEO Performance Diagrams PDF features a modern design for your presentation meetings. The adjustable and customizable slides provide unlimited possibilities for acing up your presentation. Slidegeeks has done all the homework before launching the product for you. So, do not wait, grab the presentation templates today
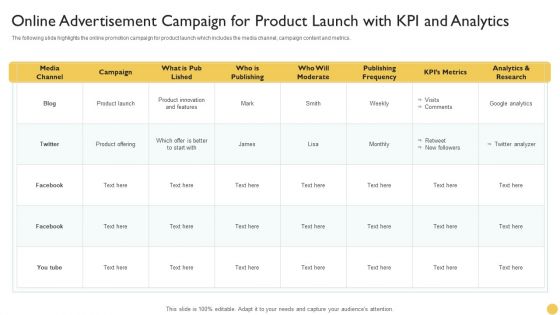
Online Advertisement Campaign For Product Launch With KPI And Analytics Diagrams PDF
The following slide highlights the online promotion campaign for product launch which includes the media channel, campaign content and metrics. Showcasing this set of slides titled Online Advertisement Campaign For Product Launch With KPI And Analytics Diagrams PDF. The topics addressed in these templates are Kpis Metrics, Google Analytics, Product Offering. All the content presented in this PPT design is completely editable. Download it and make adjustments in color, background, font etc. as per your unique business setting.
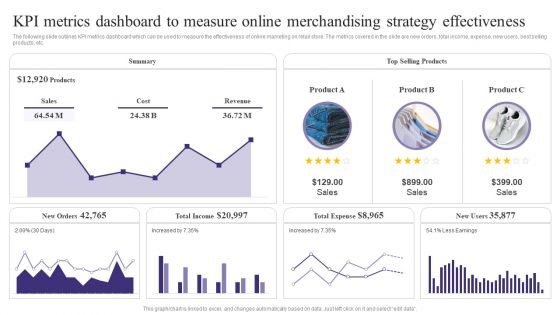
KPI Metrics Dashboard To Measure Online Merchandising Strategy Effectiveness Sample PDF
The following slide outlines KPI metrics dashboard which can be used to measure the effectiveness of online marketing on retail store. The metrics covered in the slide are new orders, total income, expense, new users, best selling products, etc. Coming up with a presentation necessitates that the majority of the effort goes into the content and the message you intend to convey. The visuals of a PowerPoint presentation can only be effective if it supplements and supports the story that is being told. Keeping this in mind our experts created KPI Metrics Dashboard To Measure Online Merchandising Strategy Effectiveness Sample PDF to reduce the time that goes into designing the presentation. This way, you can concentrate on the message while our designers take care of providing you with the right template for the situation.
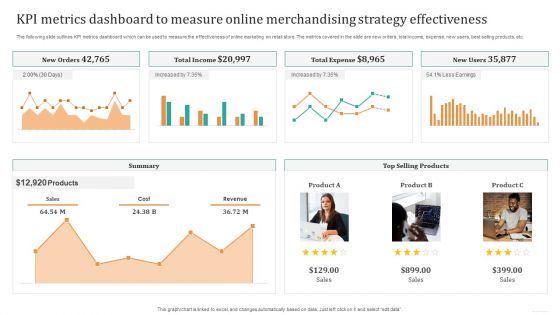
KPI Metrics Dashboard To Measure Online Merchandising Strategy Effectiveness Pictures PDF
The following slide outlines KPI metrics dashboard which can be used to measure the effectiveness of online marketing on retail store. The metrics covered in the slide are new orders, total income, expense, new users, best selling products, etc. Coming up with a presentation necessitates that the majority of the effort goes into the content and the message you intend to convey. The visuals of a PowerPoint presentation can only be effective if it supplements and supports the story that is being told. Keeping this in mind our experts created KPI Metrics Dashboard To Measure Online Merchandising Strategy Effectiveness Pictures PDF to reduce the time that goes into designing the presentation. This way, you can concentrate on the message while our designers take care of providing you with the right template for the situation.


 Continue with Email

 Home
Home


