Manufacturing Plan
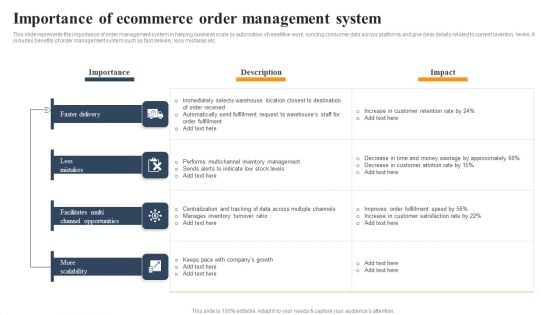
Implementing An Effective Ecommerce Management Framework Importance Of Ecommerce Order Management System Mockup PDF
This slide represents the importance of order management system in helping business scale by automation of repetitive work, syncing consumer data across platforms and give clear details related to current inventory levels. This modern and well-arranged Implementing An Effective Ecommerce Management Framework Importance Of Ecommerce Order Management System Mockup PDF provides lots of creative possibilities. It is very simple to customize and edit with the Powerpoint Software. Just drag and drop your pictures into the shapes. All facets of this template can be edited with Powerpoint no extra software is necessary. Add your own material, put your images in the places assigned for them, adjust the colors, and then you can show your slides to the world, with an animated slide included.
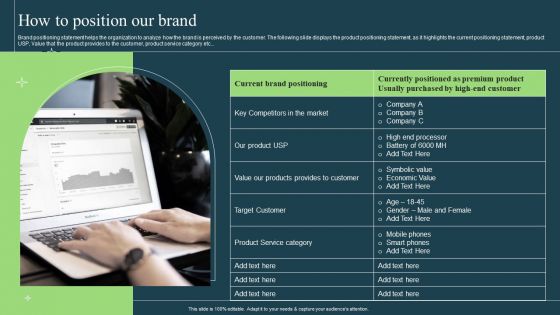
Differentiation Techniques Ways To Surpass Competitors How To Position Our Brand Elements PDF
Brand positioning statement helps the organization to analyze how the brand is perceived by the customer. The following slide displays the product positioning statement, as it highlights the current positioning statement, product USP, Value that the product provides to the customer, product service category etc. Presenting Differentiation Techniques Ways To Surpass Competitors How To Position Our Brand Elements PDF to provide visual cues and insights. Share and navigate important information on one stages that need your due attention. This template can be used to pitch topics like Product, Customer, Economic Value, Symbolic Value. In addtion, this PPT design contains high resolution images, graphics, etc, that are easily editable and available for immediate download.
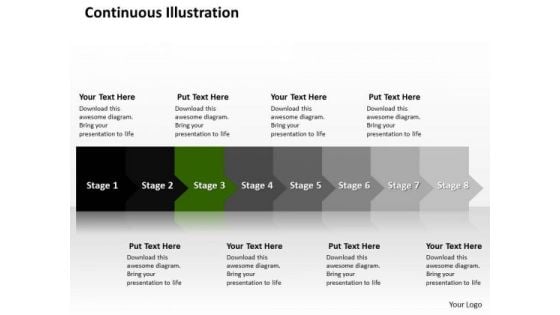
Ppt Sequential Way To Prevent Production Losses Eight Steps Stage 3 PowerPoint Templates
PPT sequential way to prevent production losses eight steps stage 3 PowerPoint Templates-This diagram can be used in analyzing, designing, documenting or managing a process or program in various fields.-PPT sequential way to prevent production losses eight steps stage 3 PowerPoint Templates-3d, Illustration, arrows, business, declining, dim, drop, finances, graphic, image, loss, production, shedding, statistics, agreement, business, cheap, company, earth, exchange, financial, green, holiday, loss, made, nationality, ocean, outsource, production, quality, stand, stock With our Ppt Sequential Way To Prevent Production Losses Eight Steps Stage 3 PowerPoint Templates you won't bat an eyelid. Display your ability with equanimity.
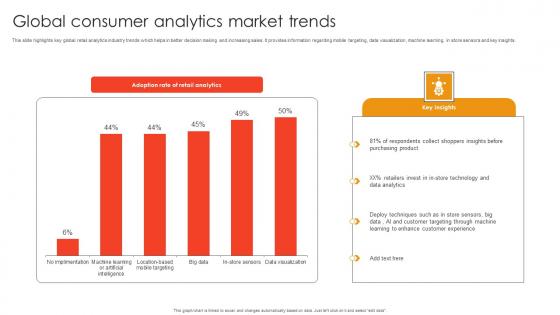
Global Consumer Analytics Market Trends Template Pdf
This slide highlights key global retail analytics industry trends which helps in better decision making and increasing sales. It provides information regarding mobile targeting, data visualization, machine learning, in store sensors and key insights. Pitch your topic with ease and precision using this Global Consumer Analytics Market Trends Template Pdf. This layout presents information on Respondents Collect Shoppers, Retailers Invest Store, Deploy Techniques Store Sensors. It is also available for immediate download and adjustment. So, changes can be made in the color, design, graphics or any other component to create a unique layout. This slide highlights key global retail analytics industry trends which helps in better decision making and increasing sales. It provides information regarding mobile targeting, data visualization, machine learning, in store sensors and key insights.
Usa Ppt Template Arrow Demonstration Of 3 Steps Project Management PowerPoint Graphic
We present our USA PPT template arrow demonstration of 3 steps project management power point Graphic. Use our Arrows PowerPoint Templates because, anticipate the doubts and questions in the minds of your colleagues and enlighten them with your inspired strategy to garner desired success. Use our Symbol PowerPoint Templates because; Use your findings to help arrive at an accurate diagnosis. Use our Business PowerPoint Templates because, Marketing Strategy Business Template: - Maximizing sales of your product is the intended destination. Use our Shapes PowerPoint Templates because, you are buzzing with ideas. Use our Process and Flows PowerPoint Templates because, getting it done in time is the key to success. Use these PowerPoint slides for presentations relating to abstract, age, ancient, arrow, art, artistic, background, colors, contemporary, crack, dark, decoration, design, dirt, dynamic, future, grunge, illustration, index, linear, lines, paper, pattern, pointer, poster, retro, scratch, sign, symbol. The prominent colors used in the PowerPoint template are Blue, Gray, and Black Reorganize your team with our Usa Ppt Template Arrow Demonstration Of 3 Steps Project Management PowerPoint Graphic. Download without worries with our money back guaranteee.
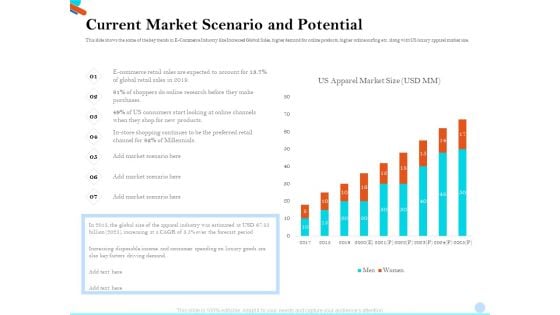
Pitch Presentation Raising Series C Funds Investment Company Current Market Scenario And Potential Mockup PDF
This slide shows the some of the key trends in E Commerce Industry like Increased Global Sales, higher demand for online products, higher online surfing etc. along with US luxury apparel market size. Deliver an awe inspiring pitch with this creative pitch presentation raising series c funds investment company current market scenario and potential mockup pdf bundle. Topics like industry, global, income, consumers, retail sales can be discussed with this completely editable template. It is available for immediate download depending on the needs and requirements of the user.
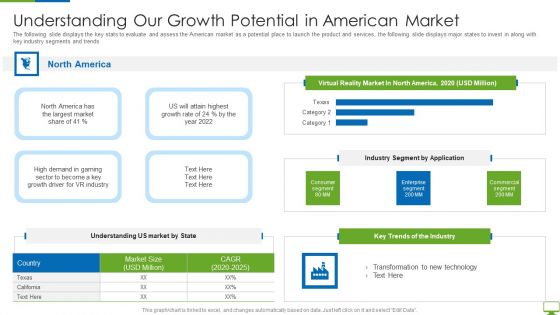
Cyber Network Simulation Platform Capital Funding Pitch Deck Understanding Our Growth Summary PDF
The following slide displays the key stats to evaluate and assess the American market as a potential place to launch the product and services, the following slide displays major states to invest in along with key industry segments and trends Deliver and pitch your topic in the best possible manner with this cyber network simulation platform capital funding pitch deck understanding our growth summary pdf Use them to share invaluable insights on high demand in gaming, transformation technology, key trends of the industry and impress your audience. This template can be altered and modified as per your expectations. So, grab it now.
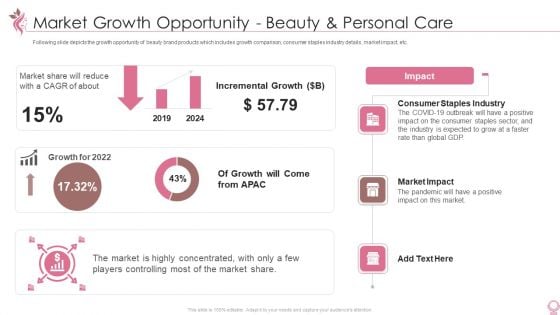
Cosmetics And Personal Care Venture Startup Market Growth Opportunity Beauty And Personal Care Download PDF Brochure PDF
Following slide depicts the growth opportunity of beauty brand products which includes growth comparison, consumer staples industry details, market impact, etc. Deliver and pitch your topic in the best possible manner with this cosmetics and personal care venture startup market growth opportunity beauty and personal care download pdf brochure pdf. Use them to share invaluable insights on market share, growth for 2022, consumer staples industry, market impact, incremental growth and impress your audience. This template can be altered and modified as per your expectations. So, grab it now.
Purpose Digital Twin Internet Things Reducing Costs After COVID Era Impact Of Covid 19 On Oil Icons PDF
This slide focuses on the impact of covid 19 on oil and gas industry which shows the yearly increase in total product stocks and net imports.Deliver and pitch your topic in the best possible manner with this purpose digital twin internet things reducing costs after covid era impact of covid 19 on oil icons pdf. Use them to share invaluable insights on impact of covid 19 on oil and gas industry and impress your audience. This template can be altered and modified as per your expectations. So, grab it now.
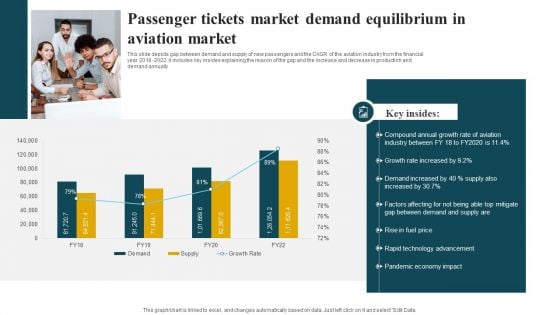
Passenger Tickets Market Demand Equilibrium In Aviation Market Guidelines PDF
This slide depicts gap between demand and supply of new passengers and the CAGR of the aviation industry from the financial year 2018 2022. it includes key insides explaining the reason of the gap and the increase and decrease in production and demand annually. Showcasing this set of slides titled Passenger Tickets Market Demand Equilibrium In Aviation Market Guidelines PDF. The topics addressed in these templates are Growth Rate, Industry, Demand. All the content presented in this PPT design is completely editable. Download it and make adjustments in color, background, font etc. as per your unique business setting.
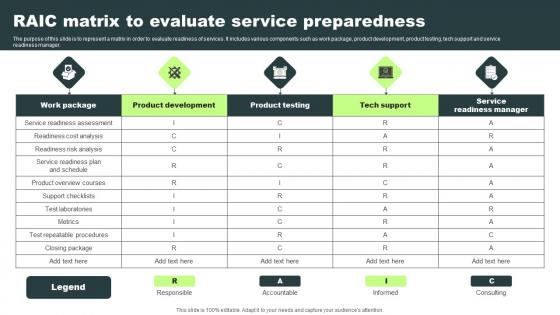
RAIC Matrix To Evaluate Service Preparedness Pictures Pdf
The purpose of this slide is to represent a matrix in order to evaluate readiness of services. It includes various components such as work package, product development, product testing, tech support and service readiness manager. Showcasing this set of slides titled RAIC Matrix To Evaluate Service Preparedness Pictures Pdf. The topics addressed in these templates are Work Package, Product Development, Product Testing. All the content presented in this PPT design is completely editable. Download it and make adjustments in color, background, font etc. as per your unique business setting. The purpose of this slide is to represent a matrix in order to evaluate readiness of services. It includes various components such as work package, product development, product testing, tech support and service readiness manager.
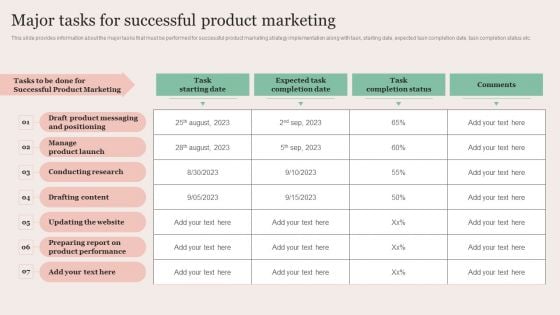
Strategic Brand Promotion For Enhanced Recognition And Revenue Growth Major Tasks For Successful Product Marketing Graphics PDF
This slide provides information about the major tasks that must be performed for successful product marketing strategy implementation along with task, starting date, expected task completion date, task completion status etc. This modern and well arranged Strategic Brand Promotion For Enhanced Recognition And Revenue Growth Major Tasks For Successful Product Marketing Graphics PDF provides lots of creative possibilities. It is very simple to customize and edit with the Powerpoint Software. Just drag and drop your pictures into the shapes. All facets of this template can be edited with Powerpoint no extra software is necessary. Add your own material, put your images in the places assigned for them, adjust the colors, and then you can show your slides to the world, with an animated slide included.

Build Devops Robotization Model Inspiration PDF
This slide provides the glimpse about the building devops automation model which focuses on manifest, code repository, software building and orchestration engine. Presenting build devops robotization model inspiration pdf to provide visual cues and insights. Share and navigate important information on eight stages that need your due attention. This template can be used to pitch topics like software build, assembly procedures, production, quality. In addtion, this PPT design contains high resolution images, graphics, etc, that are easily editable and available for immediate download.
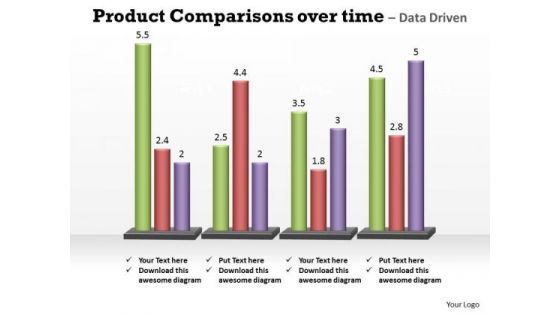
Business Marketing PowerPoint Templates Business Product Comparisons Over Time Ppt Slides
Business Marketing PowerPoint Templates Business product comparisons over time PPT Slides--This chart is useful for showing data changes over a period of time or for illustrating comparisons among items. -Business Marketing PowerPoint Templates Business product comparison over time PPT Slides-This ppt can be used for concepts relating to-chart,, graph, growth, investment, , market, percentage, , presentation report, results, statistics, stock, success and business. Continue growing with our Business Marketing PowerPoint Templates Business Product Comparisons Over Time Ppt Slides. Download without worries with our money back guaranteee.
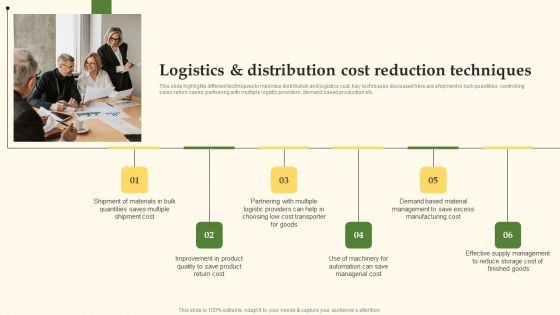
Logistics And Distribution Cost Reduction Techniques Introduction PDF
This slide highlights different techniques to minimize distribution and logistics cost. Key techniques discussed here are shipment in bulk quantities, controlling sales return cases, partnering with multiple logistic providers, demand based production etc. This Logistics And Distribution Cost Reduction Techniques Introduction PDF is perfect for any presentation, be it in front of clients or colleagues. It is a versatile and stylish solution for organizing your meetings. The Logistics And Distribution Cost Reduction Techniques Introduction PDF features a modern design for your presentation meetings. The adjustable and customizable slides provide unlimited possibilities for acing up your presentation. Slidegeeks has done all the homework before launching the product for you. So, do not wait, grab the presentation templates today
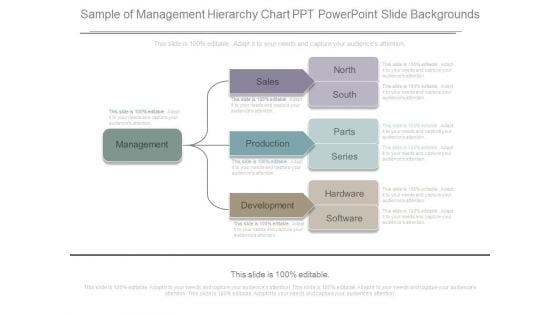
Sample Of Management Hierarchy Chart Ppt Powerpoint Slide Backgrounds
This is a sample of management hierarchy chart ppt powerpoint slide backgrounds. This is a one stage process. The stages in this process are management, sales, production, development, north, south, parts, series, hardware, software.
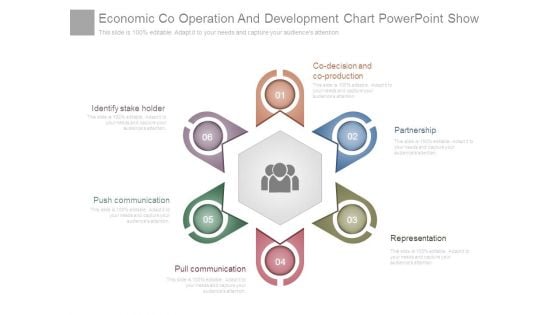
Economic Co Operation And Development Chart Powerpoint Show
This is a economic co operation and development chart powerpoint show. This is a six stage process. The stages in this process are co decision and co production, partnership, representation, pull communication, push communication, identify stake holder.
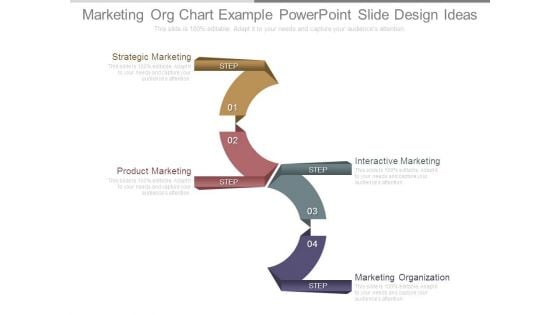
Marketing Org Chart Example Powerpoint Slide Design Ideas
This is a marketing org chart example powerpoint slide design ideas. This is a four stage process. The stages in this process are strategic marketing, product marketing, interactive marketing, marketing organization.
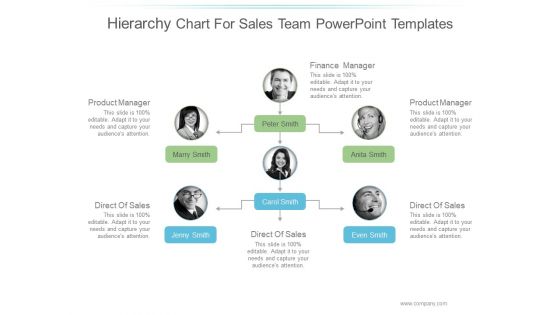
Hierarchy Chart For Sales Team Ppt PowerPoint Presentation Samples
This is a hierarchy chart for sales team ppt powerpoint presentation samples. This is a six stage process. The stages in this process are business, marketing, technology, product, management.
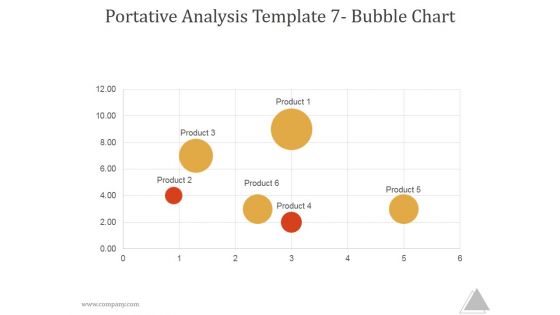
Portative Analysis Template 7 Bubble Chart Ppt PowerPoint Presentation Picture
This is a portative analysis template 7 bubble chart ppt powerpoint presentation picture. This is a six stage process. The stages in this process are product, business, marketing, management.
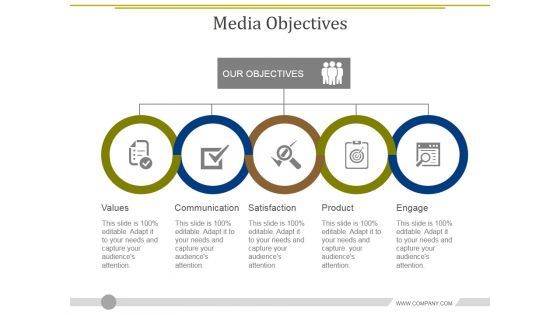
Media Objectives Template 2 Ppt PowerPoint Presentation Diagram Graph Charts
This is a media objectives template 2 ppt powerpoint presentation diagram graph charts. This is a five stage process. The stages in this process are values, communication, satisfaction, product, engage.
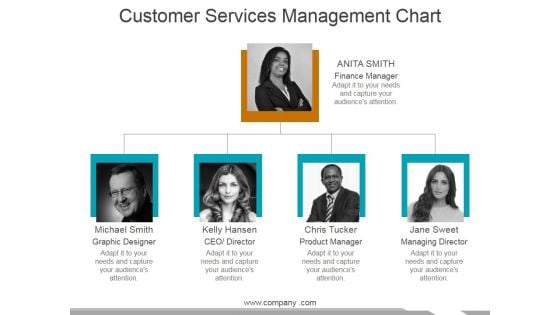
Customer Services Management Chart Ppt PowerPoint Presentation Show Slides
This is a customer services management chart ppt powerpoint presentation show slides. This is a two stage process. The stages in this process are finance manager, graphic designer, ceo director, product manager.
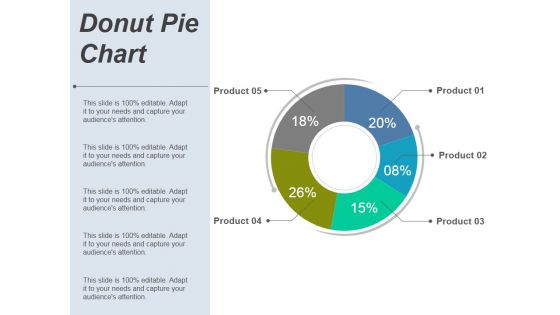
Donut Pie Chart Ppt PowerPoint Presentation Infographic Template Layout Ideas
This is a donut pie chart ppt powerpoint presentation infographic template layout ideas. This is a five stage process. The stages in this process are product, business, finance, marketing.
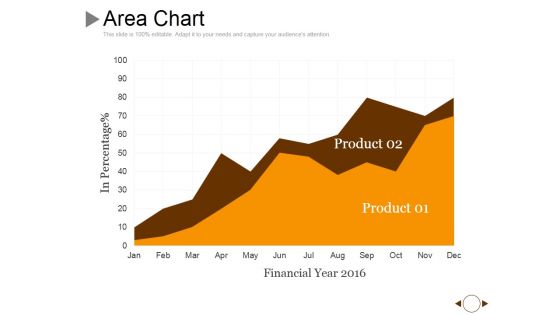
Area Chart Ppt PowerPoint Presentation Show Layout Ideas
This is a area chart ppt powerpoint presentation show layout ideas. This is a two stage process. The stages in this process are product, in percentage, financial year, growth.
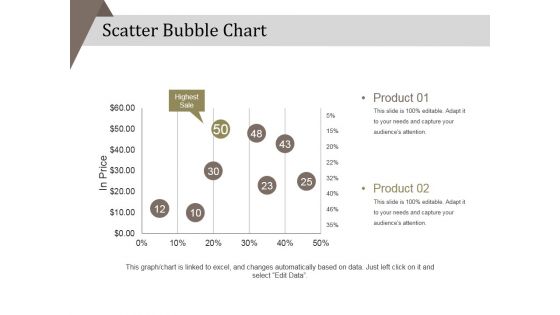
Scatter Bubble Chart Ppt PowerPoint Presentation Diagram Ppt
This is a scatter bubble chart ppt powerpoint presentation diagram ppt. This is a two stage process. The stages in this process are product, in price, highest sale, percentage, business, marketing.
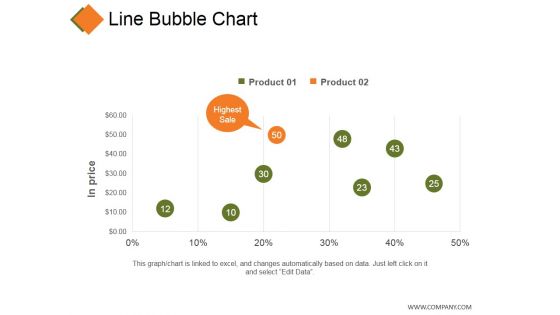
Line Bubble Chart Ppt PowerPoint Presentation Professional Infographic Template
This is a line bubble chart ppt powerpoint presentation professional infographic template. This is a five stage process. The stages in this process are product, in price, highest sale, business, finance.
Donut Pie Chart Ppt PowerPoint Presentation Icon Slide Portrait
This is a donut pie chart ppt powerpoint presentation icon slide portrait. This is a five stage process. The stages in this process are product, percentage, finance, donut, business.
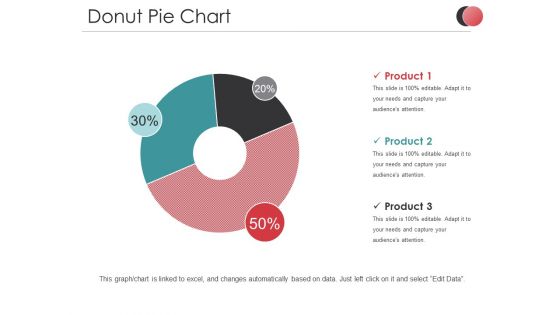
Donut Pie Chart Ppt PowerPoint Presentation Inspiration Background Image
This is a donut pie chart ppt powerpoint presentation inspiration background image. This is a three stage process. The stages in this process are product, percentage, business, marketing, process.
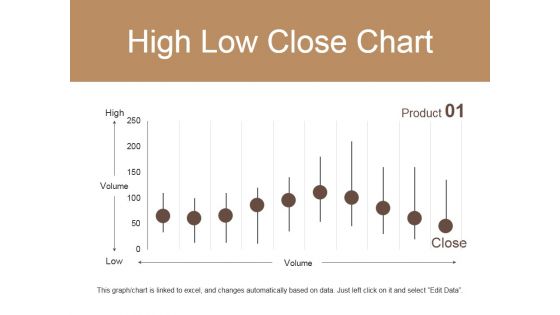
High Low Close Chart Ppt PowerPoint Presentation Infographic Template Vector
This is a high low close chart ppt powerpoint presentation infographic template vector. This is a ten stage process. The stages in this process are high, volume, low, product, close.
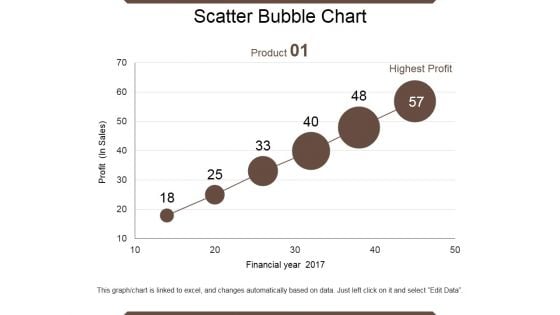
Scatter Bubble Chart Ppt PowerPoint Presentation Summary Files
This is a scatter bubble chart ppt powerpoint presentation summary files. This is a six stage process. The stages in this process are product, financial year, profit, highest profit.
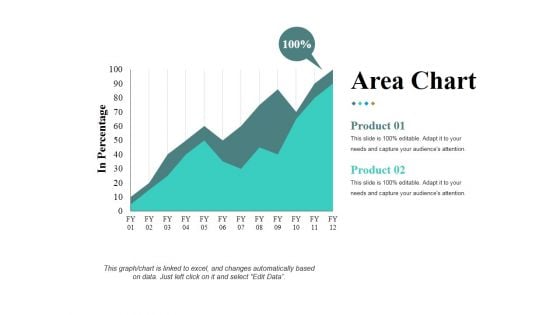
Area Chart Ppt PowerPoint Presentation Infographic Template Samples
This is a area chart ppt powerpoint presentation infographic template samples. This is a two stage process. The stages in this process are in percentage product, business, marketing, growth.
Combo Chart Ppt PowerPoint Presentation Icon Design Templates
This is a combo chart ppt powerpoint presentation icon design templates. This is a three stage process. The stages in this process are market size, growth rate, product, business, success.
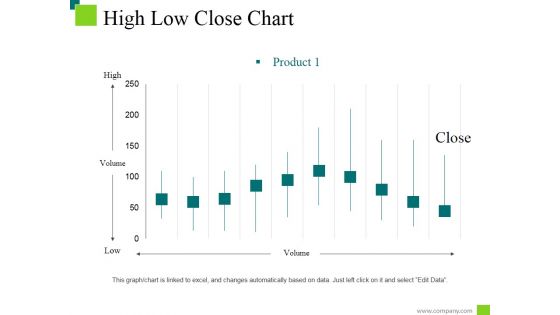
High Low Close Chart Ppt PowerPoint Presentation Styles Information
This is a high low close chart ppt powerpoint presentation styles information. This is a ten stage process. The stages in this process are low, high, product, volume, close.
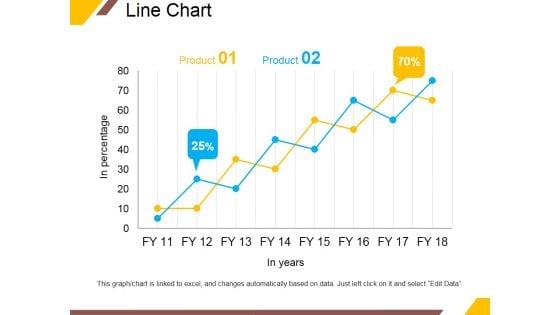
Line Chart Ppt PowerPoint Presentation Portfolio Infographic Template
This is a line chart ppt powerpoint presentation portfolio infographic template. This is a two stage process. The stages in this process are product, in years, business, percentage, growth.
Scatter Bubble Chart Ppt PowerPoint Presentation Icon Elements
This is a scatter bubble chart ppt powerpoint presentation icon elements. This is a six stage process. The stages in this process are highest profit, profit, financial year, product.
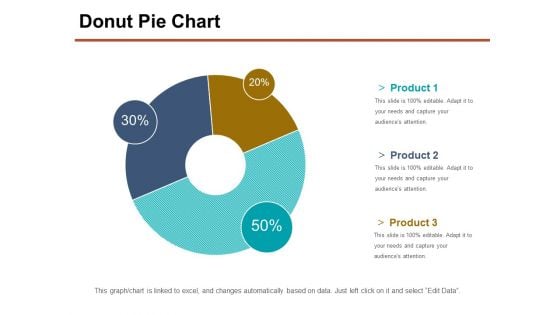
Donut Pie Chart Ppt PowerPoint Presentation Professional Slide Portrait
This is a donut pie chart ppt powerpoint presentation professional slide portrait. This is a three stage process. The stages in this process are product, percentage, business, management, process.
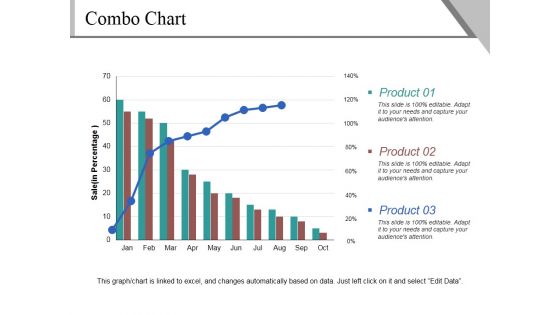
Combo Chart Ppt PowerPoint Presentation Ideas Visual Aids
This is a combo chart ppt powerpoint presentation ideas visual aids. This is a three stage process. The stages in this process are product, sales, bar graph, business, marketing.
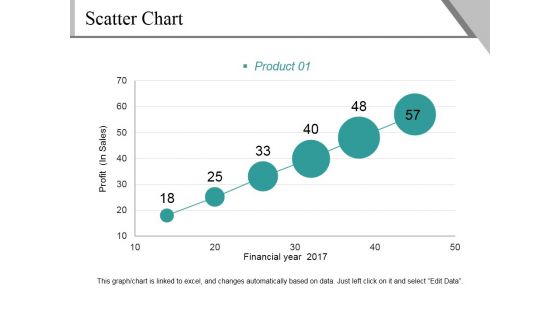
Scatter Chart Ppt PowerPoint Presentation File Background Image
This is a scatter chart ppt powerpoint presentation file background image. This is a six stage process. The stages in this process are profit, financial year, product, growth, success.
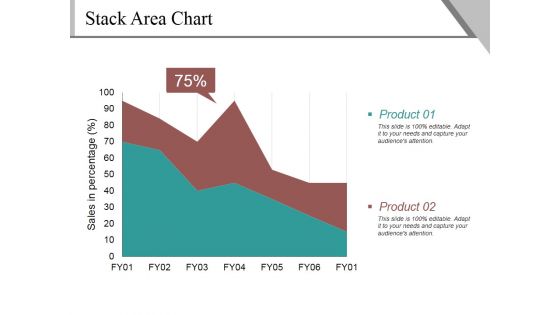
Stack Area Chart Ppt PowerPoint Presentation Gallery Guidelines
This is a stack area chart ppt powerpoint presentation gallery guidelines. This is a two stage process. The stages in this process are sales in percentage, product, percentage, business.
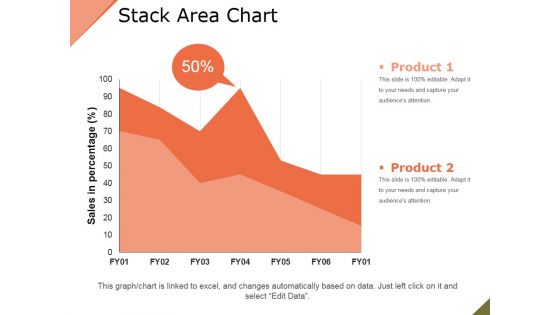
Stack Area Chart Ppt PowerPoint Presentation Example File
This is a stack area chart ppt powerpoint presentation example file. This is a two stage process. The stages in this process are product, sales in percentage, percentage, finance.
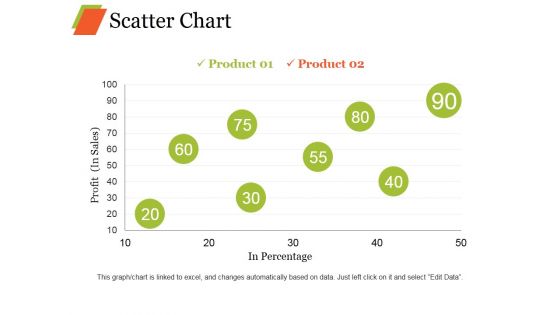
Scatter Chart Ppt PowerPoint Presentation Professional Graphic Images
This is a scatter chart ppt powerpoint presentation professional graphic images. This is a eight stage process. The stages in this process are product, profit, in percentage growth, business.
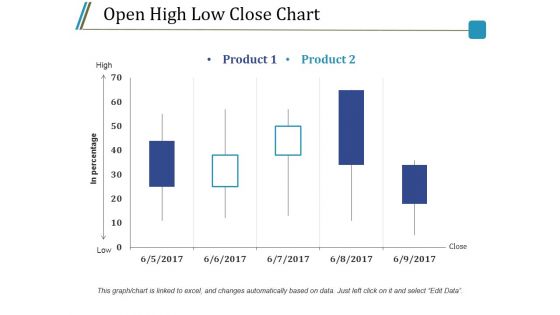
Open High Low Close Chart Ppt PowerPoint Presentation Styles Model
This is a open high low close chart ppt powerpoint presentation styles model. This is a five stage process. The stages in this process are product, high, low, in percentage, close.
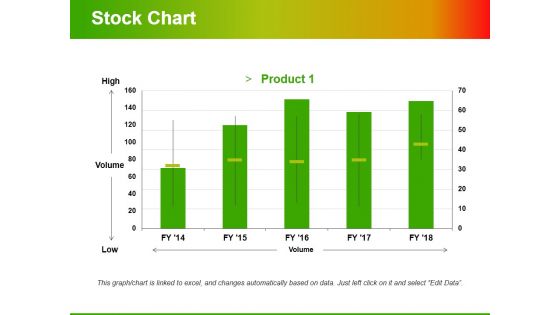
Stock Chart Template 2 Ppt PowerPoint Presentation Infographic Template Styles
This is a stock chart template 2 ppt powerpoint presentation infographic template styles. This is a one stage process. The stages in this process are high, volume, low, product, volume.
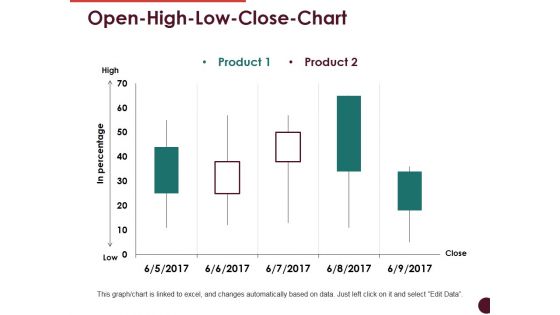
Open High Low Close Chart Ppt PowerPoint Presentation Professional Visuals
This is a open high low close chart ppt powerpoint presentation professional visuals. This is a two stage process. The stages in this process are high, low, in percentage, product, close.
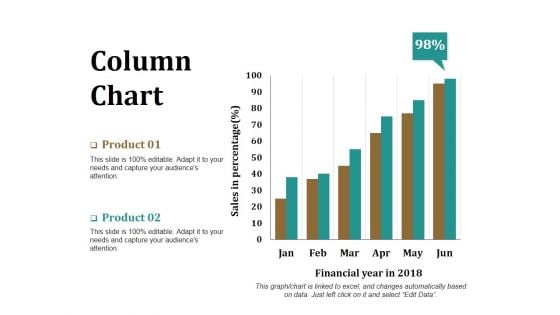
Column Chart Ppt PowerPoint Presentation Model Graphics Download
This is a column chart ppt powerpoint presentation model graphics download. This is a two stage process. The stages in this process are product, financial year, sales in percentage, bar graph, success.
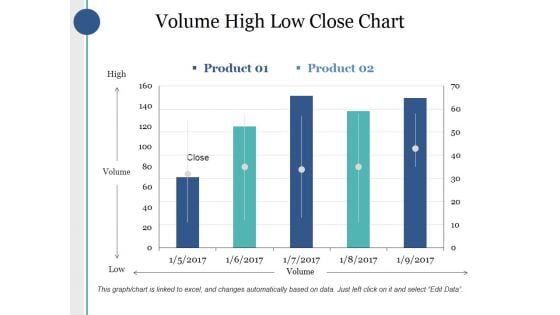
Volume High Low Close Chart Ppt PowerPoint Presentation Infographics Good
This is a volume high low close chart ppt powerpoint presentation infographics good. This is a two stage process. The stages in this process are high, volume, low, product, close.
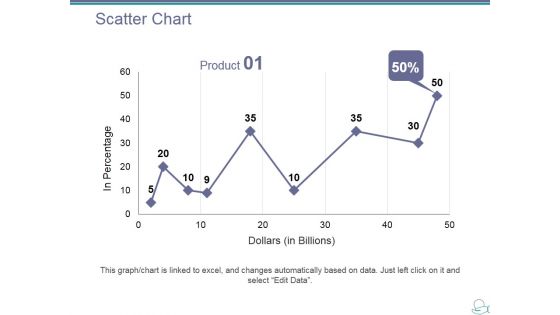
Scatter Chart Ppt PowerPoint Presentation Ideas Designs Download
This is a scatter chart ppt powerpoint presentation ideas designs download. This is a one stage process. The stages in this process are product, dollar, in percentage, growth, success.
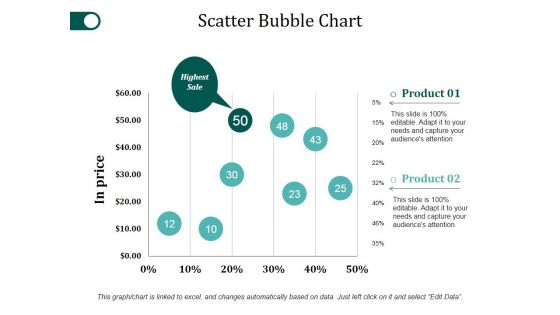
Scatter Bubble Chart Ppt PowerPoint Presentation Styles Objects
This is a scatter bubble chart ppt powerpoint presentation styles objects. This is a two stage process. The stages in this process are product, in price, highest sale, percentage, finance.
Scatter Line Chart Ppt PowerPoint Presentation Icon Files
This is a scatter line chart ppt powerpoint presentation icon files. This is a one stage process. The stages in this process are dollar in millions, product, sales in percentage.
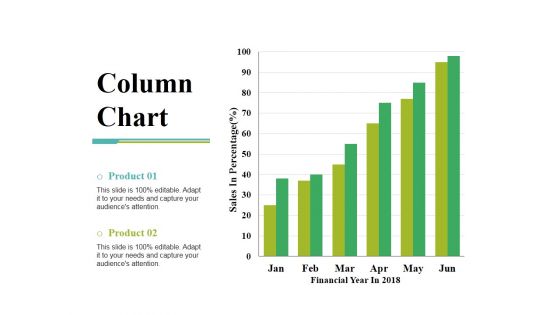
Column Chart Ppt PowerPoint Presentation Gallery Slide Portrait
This is a column chart ppt powerpoint presentation gallery slide portrait. This is a two stage process. The stages in this process are sales in percentage, financial year, product, bar graph, growth.
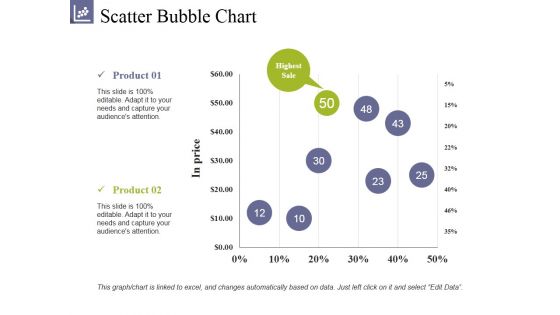
Scatter Bubble Chart Ppt PowerPoint Presentation Summary Clipart
This is a scatter bubble chart ppt powerpoint presentation summary clipart. This is a two stage process. The stages in this process are product, highest sale, in prices, growth, success.
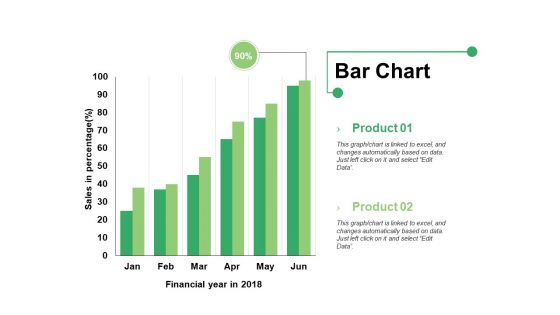
Bar Chart Ppt PowerPoint Presentation Infographics Format Ideas
This is a bar chart ppt powerpoint presentation infographics format ideas. This is a two stage process. The stages in this process are bar graph, product, financial year, sales in percentage.
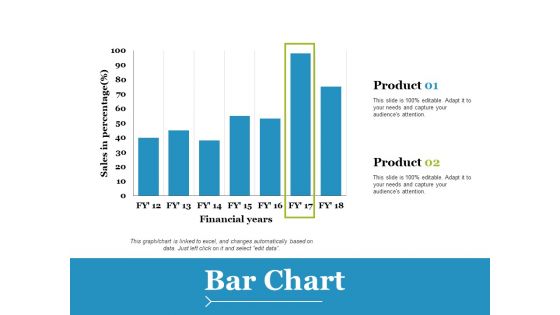
Bar Chart Ppt PowerPoint Presentation Slides Example File
This is a bar chart ppt powerpoint presentation slides example file. This is a two stage process. The stages in this process are product, financial years, sales in percentage.
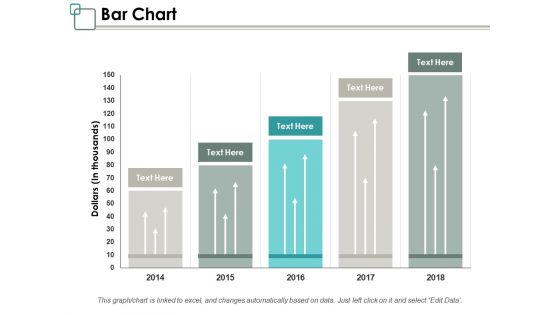
Bar Chart Ppt PowerPoint Presentation Infographic Template Graphics Design
This is a bar chart ppt powerpoint presentation infographic template graphics design. This is a five stage process. The stages in this process are management, marketing, business, percentage, product.
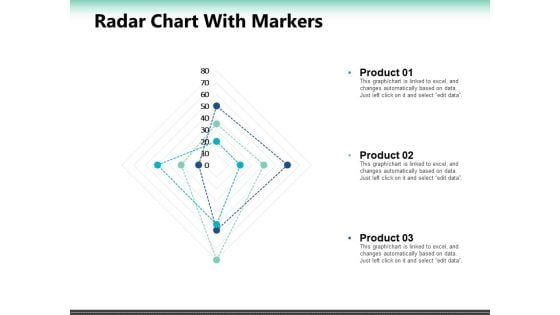
Radar Chart With Markers Ppt PowerPoint Presentation Summary Slide Portrait
This is a radar chart with markers ppt powerpoint presentation summary slide portrait. This is a seven stage process. The stages in this process are percentage, product, business, marketing.
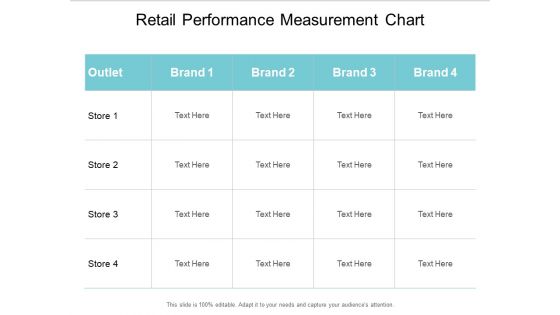
Retail Performance Measurement Chart Ppt PowerPoint Presentation Ideas Structure
This is a retail performance measurement chart ppt powerpoint presentation ideas structure. This is a four stage process. The stages in this process are product distribution, distribution system, numeric distribution.
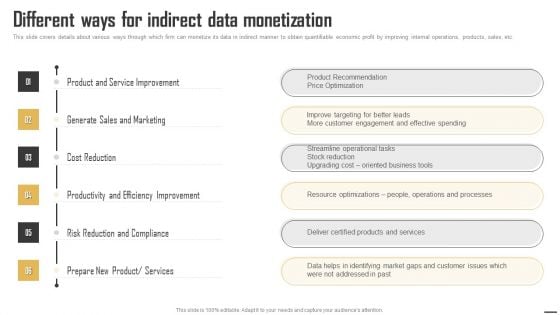
Data Monetization And Management Different Ways For Indirect Data Monetization Structure PDF
This slide covers details about various ways through which firm can monetize its data in indirect manner to obtain quantifiable economic profit by improving internal operations, products, sales, etc. Coming up with a presentation necessitates that the majority of the effort goes into the content and the message you intend to convey. The visuals of a PowerPoint presentation can only be effective if it supplements and supports the story that is being told. Keeping this in mind our experts created Data Monetization And Management Different Ways For Indirect Data Monetization Structure PDF to reduce the time that goes into designing the presentation. This way, you can concentrate on the message while our designers take care of providing you with the right template for the situation.
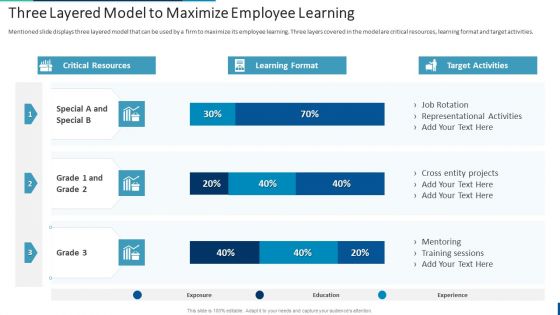
Internal Employee Succession Three Layered Model To Maximize Employee Learning Guidelines PDF
Mentioned slide displays three layered model that can be used by a firm to maximize its employee learning. Three layers covered in the model are critical resources, learning format and target activities. The Internal Employee Succession Three Layered Model To Maximize Employee Learning Guidelines PDF vis a compilation of the most recent design trends as a series of slides. It is suitable for any subject or industry presentation, containing attractive visuals and photo spots for businesses to clearly express their messages. This template contains a variety of slides for the user to input data, such as structures to contrast two elements, bullet points, and slides for written information. Slidegeeks is prepared to create an impression.
Major Clients Of Our Consulting Framework For Brand Perception Enhancement Icons PDF
The purpose of this slide is to showcase the most important clients which have worked with our brand consulting firm. It covers information about the total sales generated for clients by offering. Slidegeeks is here to make your presentations a breeze with Major Clients Of Our Consulting Framework For Brand Perception Enhancement Icons PDF With our easy to use and customizable templates, you can focus on delivering your ideas rather than worrying about formatting. With a variety of designs to choose from, you are sure to find one that suits your needs. And with animations and unique photos, illustrations, and fonts, you can make your presentation pop. So whether you are giving a sales pitch or presenting to the board, make sure to check out Slidegeeks first.
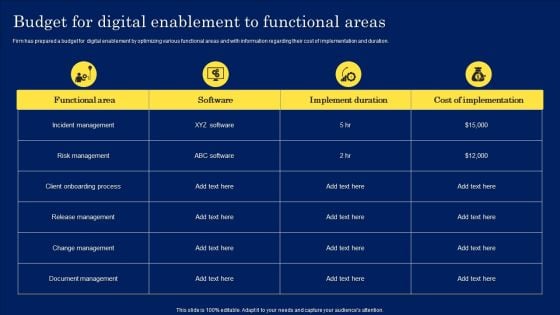
Digitization Framework For Technology Advancement Budget For Digital Enablement To Functional Areas Formats PDF
Firm has prepared a budget for digital enablement by optimizing various functional areas and with information regarding their cost of implementation and duration. This Digitization Framework For Technology Advancement Budget For Digital Enablement To Functional Areas Formats PDF from Slidegeeks makes it easy to present information on your topic with precision. It provides customization options, so you can make changes to the colors, design, graphics, or any other component to create a unique layout. It is also available for immediate download, so you can begin using it right away. Slidegeeks has done good research to ensure that you have everything you need to make your presentation stand out. Make a name out there for a brilliant performance.


 Continue with Email

 Home
Home


