Manufacturing Plan
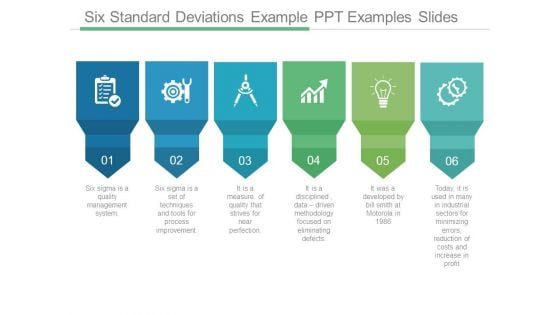
Six Standard Deviations Example Ppt Examples Slides
This is a six standard deviations example ppt examples slides. This is a six stage process. The stages in this process are six sigma is a quality management system, six sigma is a set of techniques and tools for process improvement, it is a measure of quality that strives for near perfection, it is a disciplined data driven methodology focused on eliminating defects, it was a developed by bill smith at motorola in 1986, today it is used in many in industrial sectors for minimizing errors reduction of costs and increase in profit.
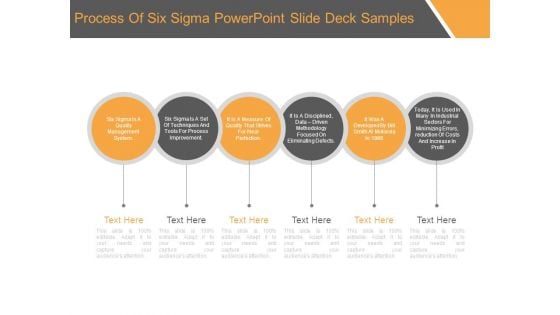
Process Of Six Sigma Powerpoint Slide Deck Samples
This is a process of six sigma powerpoint slide deck samples. This is a six stage process. The stages in this process are six sigma is a quality management system, six sigma is a set of techniques and tools for process improvement, it is a measure of quality that strives for near perfection, it is a disciplined, data driven methodology focused on eliminating defects, it was a developed by bill smith at motorola in 1986, today, it is used in many in industrial sectors for minimizing errors, reduction of costs and increase in profit.
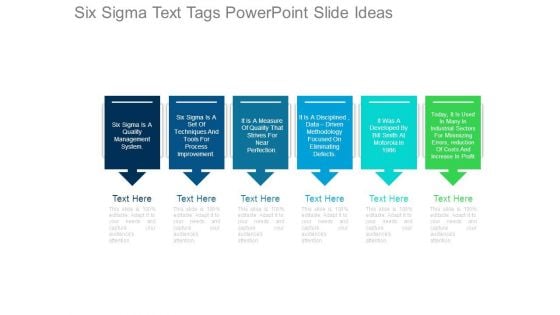
Six Sigma Text Tags Powerpoint Slide Ideas
This is a six sigma text tags powerpoint slide ideas. This is a six stage process. The stages in this process are six sigma is a quality management system, six sigma is a set of techniques and tools for process improvement, it is a measure of quality that strives for near perfection, it is a disciplined data driven methodology focused on eliminating defects, it was a developed by bill smith at motorola in 1986, today, it is used in many in industrial sectors for minimizing errors reduction of costs and increase in profit.
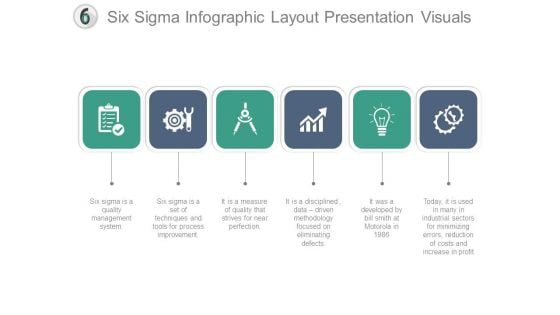
Six Sigma Infographic Layout Presentation Visuals
This is a six sigma infographic layout presentation visuals. This is a six stage process. The stages in this process are six sigma is a quality management system, six sigma is a set of techniques and tools for process improvement, it is a measure of quality that strives for near perfection, it is a disciplined, data driven methodology focused on eliminating defects, it was a developed by bill smith at motorola in 1986, today, it is used in many in industrial sectors for minimizing errors, reduction of costs and increase in profit.
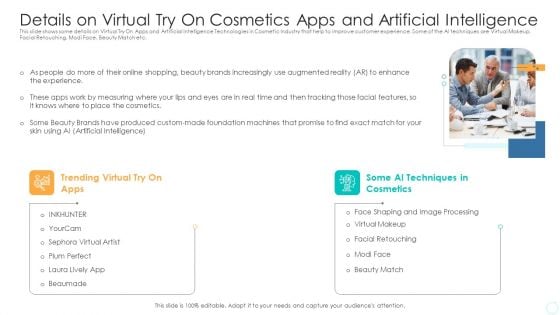
Details On Virtual Try On Cosmetics Apps And Artificial Intelligence Introduction PDF
This slide shows some details on Virtual Try On Apps and Artificial Intelligence Technologies in Cosmetic Industry that help to improve customer experience. Some of the AI techniques are Virtual Makeup, Facial Retouching, Modi Face, Beauty Match etc. Presenting details on virtual try on cosmetics apps and artificial intelligence introduction pdf to provide visual cues and insights. Share and navigate important information on two stages that need your due attention. This template can be used to pitch topics like artificial intelligence technologies, customer experience. In addition, this PPT design contains high-resolution images, graphics, etc, that are easily editable and available for immediate download.
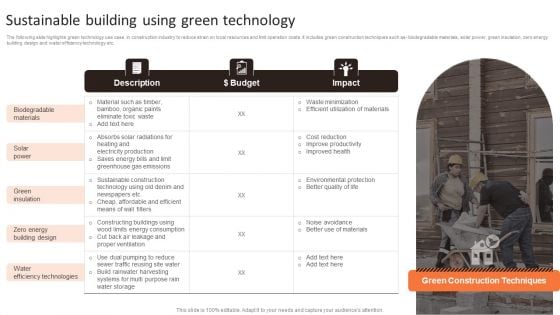
Sustainable Building Using Green Technology Ppt PowerPoint Presentation File Structure PDF
The following slide highlights green technology use case in construction industry to reduce strain on local resources and limit operation costs. It includes green construction techniques such as- biodegradable materials, solar power, green insulation, zero energy building design and water efficiency technology etc. Pitch your topic with ease and precision using this Sustainable Building Using Green Technology Ppt PowerPoint Presentation File Structure PDF. This layout presents information on Biodegradable Materials, Solar Power, Green Insulation. It is also available for immediate download and adjustment. So, changes can be made in the color, design, graphics or any other component to create a unique layout.

2013 Global Business Success PowerPoint Templates Ppt Backgrounds For Slides 1212
We present our 2013 Global Business Success PowerPoint Templates PPT Backgrounds For Slides 1212.Use our Money PowerPoint Templates because it can illustrate your chain of ideas focusing on that aspect or resource in order to enhance the quality of your product. Download our Global PowerPoint Templates because you can Employ the right colours for your brilliant ideas. Download and present our Arrows PowerPoint Templates because our template will illustrate what you want to say. Present our Business PowerPoint Templates because project your ideas to you colleagues and complete the full picture. Download our Finance PowerPoint Templates because our template will illustrate what you want to say.Use these PowerPoint slides for presentations relating to Economic recession in 2013, money, arrows, global, business, finance. The prominent colors used in the PowerPoint template are Red, Green, Gray. Customers tell us our 2013 Global Business Success PowerPoint Templates PPT Backgrounds For Slides 1212 are Bright. Presenters tell us our global PowerPoint templates and PPT Slides are Perfect. Presenters tell us our 2013 Global Business Success PowerPoint Templates PPT Backgrounds For Slides 1212 are Youthful. The feedback we get is that our finance PowerPoint templates and PPT Slides will impress their bosses and teams. Use our 2013 Global Business Success PowerPoint Templates PPT Backgrounds For Slides 1212 will get their audience's attention. You can be sure our arrows PowerPoint templates and PPT Slides are Perfect. Rejuvenate your vision with our 2013 Global Business Success PowerPoint Templates Ppt Backgrounds For Slides 1212. Download without worries with our money back guaranteee.
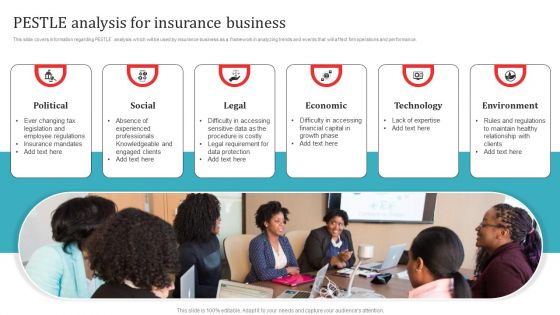
PESTLE Analysis For Insurance Business Background PDF
This slide covers information regarding PESTLE analysis which will be used by insurance business as a framework in analyzing trends and events that will affect firm operations and performance. Explore a selection of the finest PESTLE Analysis For Insurance Business Background PDF here. With a plethora of professionally designed and pre-made slide templates, you can quickly and easily find the right one for your upcoming presentation. You can use our PESTLE Analysis For Insurance Business Background PDF to effectively convey your message to a wider audience. Slidegeeks has done a lot of research before preparing these presentation templates. The content can be personalized and the slides are highly editable. Grab templates today from Slidegeeks.
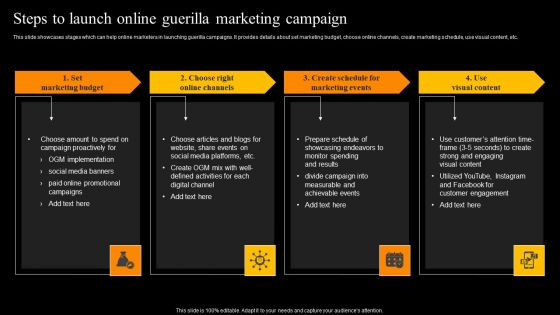
Steps To Launch Online Guerilla Marketing Campaign Microsoft PDF
This slide showcases stages which can help online marketers in launching guerilla campaigns. It provides details about set marketing budget, choose online channels, create marketing schedule, use visual content, etc. This Steps To Launch Online Guerilla Marketing Campaign Microsoft PDF is perfect for any presentation, be it in front of clients or colleagues. It is a versatile and stylish solution for organizing your meetings. The product features a modern design for your presentation meetings. The adjustable and customizable slides provide unlimited possibilities for acing up your presentation. Slidegeeks has done all the homework before launching the product for you. So, do not wait, grab the presentation templates today
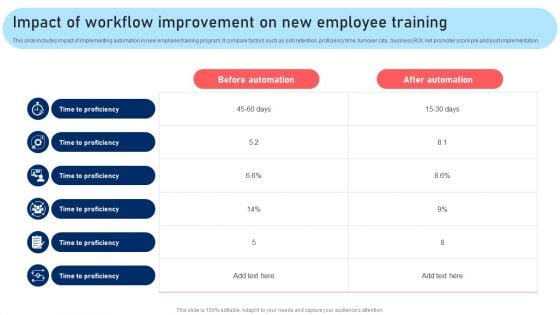
Impact Of Workflow Improvement On New Employee Training Inspiration PDF
This slide includes impact of implementing automation in new employee training program. It compare factors such as skill retention, proficiency time, turnover rate, business ROI, net promoter score pre and post implementation. Do you know about Slidesgeeks Impact Of Workflow Improvement On New Employee Training Inspiration PDF. These are perfect for delivering any kind od presentation. Using it, create PowerPoint presentations that communicate your ideas and engage audiences. Save time and effort by using our pre designed presentation templates that are perfect for a wide range of topic. Our vast selection of designs covers a range of styles, from creative to business, and are all highly customizable and easy to edit. Download as a PowerPoint template or use them as Google Slides themes.
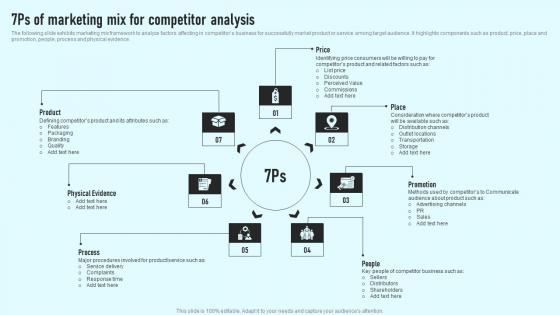
7Ps Of Marketing Mix For Competitor Analysis Comprehensive Guide Themes Pdf
The following slide exhibits marketing mix framework to analyze factors affecting in competitors business for successfully market product or service among target audience. It highlights components such as product, price, place and promotion, people, process and physical evidence. Find a pre-designed and impeccable 7Ps Of Marketing Mix For Competitor Analysis Comprehensive Guide Themes Pdf The templates can ace your presentation without additional effort. You can download these easy-to-edit presentation templates to make your presentation stand out from others. So, what are you waiting for Download the template from Slidegeeks today and give a unique touch to your presentation. The following slide exhibits marketing mix framework to analyze factors affecting in competitors business for successfully market product or service among target audience. It highlights components such as product, price, place and promotion, people, process and physical evidence.
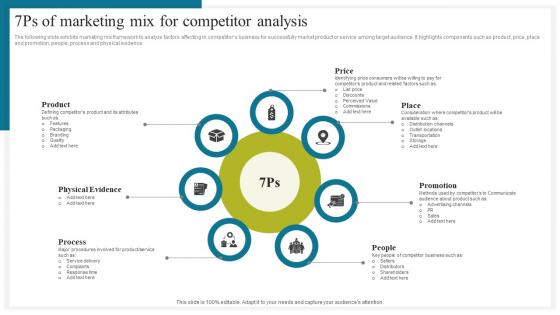
7Ps Of Marketing Mix For How To Conduct Competitive Assessment Information Pdf
The following slide exhibits marketing mix framework to analyze factors affecting in competitors business for successfully market product or service among target audience. It highlights components such as product, price, place and promotion, people, process and physical evidence. Find a pre designed and impeccable 7Ps Of Marketing Mix For How To Conduct Competitive Assessment Information Pdf. The templates can ace your presentation without additional effort. You can download these easy to edit presentation templates to make your presentation stand out from others. So, what are you waiting for Download the template from Slidegeeks today and give a unique touch to your presentation. The following slide exhibits marketing mix framework to analyze factors affecting in competitors business for successfully market product or service among target audience. It highlights components such as product, price, place and promotion, people, process and physical evidence.
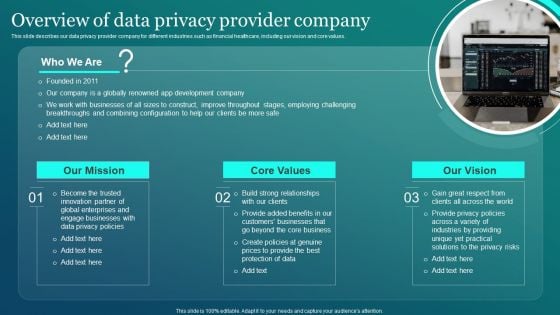
Information Security Overview Of Data Privacy Provider Company Background PDF
This slide describes our data privacy provider company for different industries such as financial healthcare, including our vision and core values. Retrieve professionally designed Information Security Overview Of Data Privacy Provider Company Background PDF to effectively convey your message and captivate your listeners. Save time by selecting pre made slideshows that are appropriate for various topics, from business to educational purposes. These themes come in many different styles, from creative to corporate, and all of them are easily adjustable and can be edited quickly. Access them as PowerPoint templates or as Google Slides themes. You do not have to go on a hunt for the perfect presentation because Slidegeeks got you covered from everywhere.
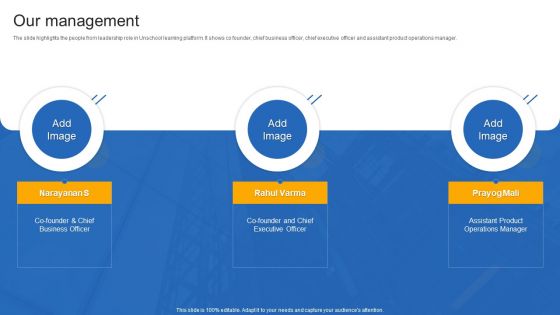
Unschool Platform Business Profile Our Management Rules PDF
The slide highlights the people from leadership role in Unschool learning platform. It shows co founder, chief business officer, chief executive officer and assistant product operations manager. This is a Business Officer, Executive Officer, Operations Manager template with various stages. Focus and dispense information on three stages using this creative set, that comes with editable features. It contains large content boxes to add your information on topics like Business Officer, Executive Officer, Operations Manager. You can also showcase facts, figures, and other relevant content using this PPT layout. Grab it now.
Graph Symbol Business PowerPoint Presentation Slides S
Microsoft PowerPoint Templates and Backgrounds with digital footage of business symbol Our Graph Symbol Business PowerPoint Presentation Slides S are products of detailed craftsmanship. They are exact in every aspect.
Ecological House Environment PowerPoint Presentation Slides R
Microsoft PowerPoint Slides and Backgrounds with symbol of ecological house with solar energy Launch products with our Ecological House Environment PowerPoint Presentation Slides R. Download without worries with our money back guaranteee.
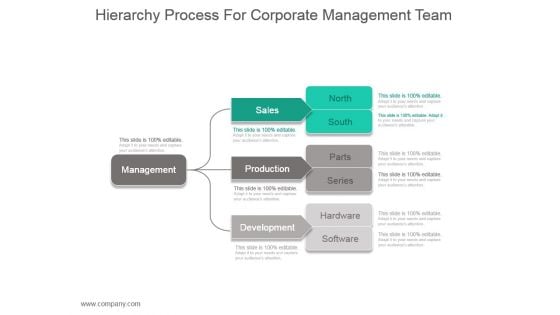
Hierarchy Process For Corporate Management Team Ppt Slide
This is a hierarchy process for corporate management team ppt slide. This is a three stage process. The stages in this process are management, sales, production, development, north, south, parts, series, hardware, software.
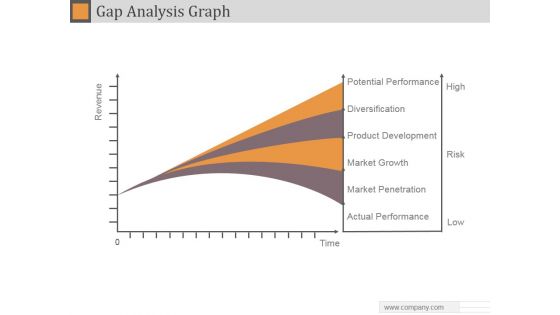
Gap Analysis Graph Ppt PowerPoint Presentation Example 2015
This is a gap analysis graph ppt powerpoint presentation example 2015. This is a four stage process. The stages in this process are potential performance, diversification, product development, market growth, market penetration, actual performance.
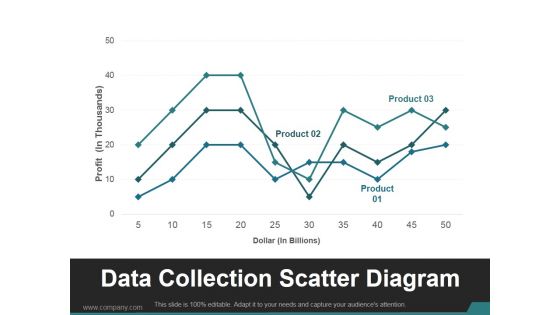
Data Collection Scatter Diagram Ppt PowerPoint Presentation Good
This is a data collection scatter diagram ppt powerpoint presentation good. This is a three stage process. The stages in this process are product, business, marketing, finance, data collection.
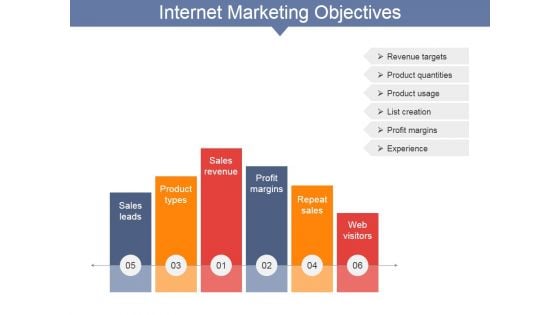
Internet Marketing Objectives Ppt PowerPoint Presentation Layouts Smartart
This is a internet marketing objectives ppt powerpoint presentation layouts smartart. This is a six stage process. The stages in this process are sales leads, product types, sales revenue, profit margins, repeat sales, web visitors.
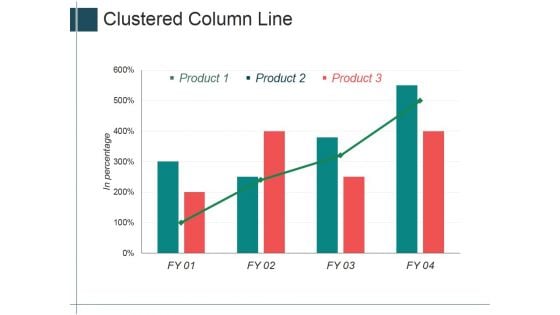
Clustered Column Line Ppt Powerpoint Presentation Ideas Inspiration
This is a clustered column line ppt powerpoint presentation ideas inspiration. This is a four stage process. The stages in this process are product, in percentage, graph, management, business.
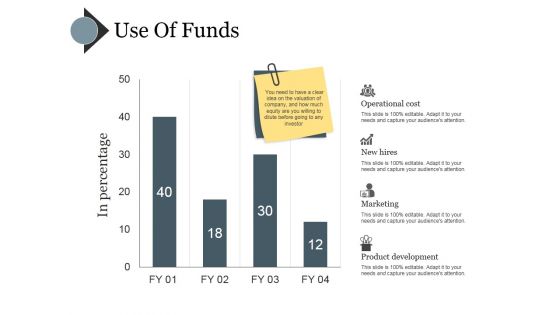
Use Of Funds Ppt PowerPoint Presentation Portfolio Clipart
This is a use of funds ppt powerpoint presentation portfolio clipart. This is a four stage process. The stages in this process are operational cost, new hires, marketing, product development.
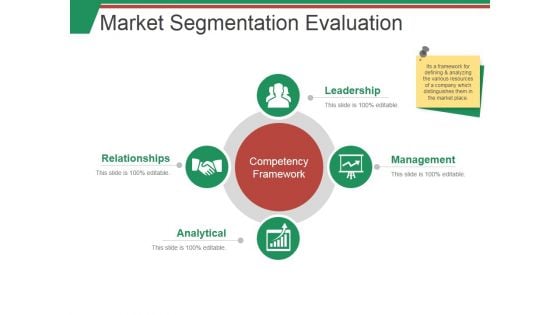
Market Segmentation Evaluation Template 1 Ppt PowerPoint Presentation Summary Smartart
This is a market segmentation evaluation template 1 ppt powerpoint presentation summary smartart. This is a two stage process. The stages in this process are market sales, net profit, beverages, milk product, nutrition.
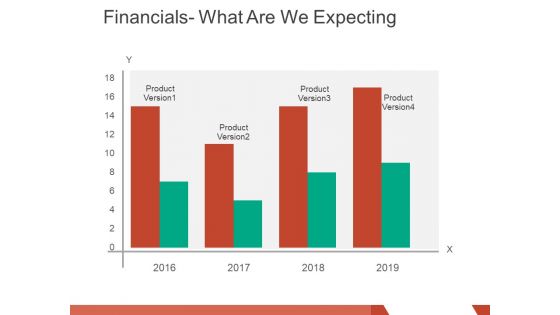
financials what are we expecting ppt powerpoint presentation layouts graphics pictures
This is a financials what are we expecting ppt powerpoint presentation layouts graphics pictures. This is a four stage process. The stages in this process are product version, business, marketing, finance, graph.
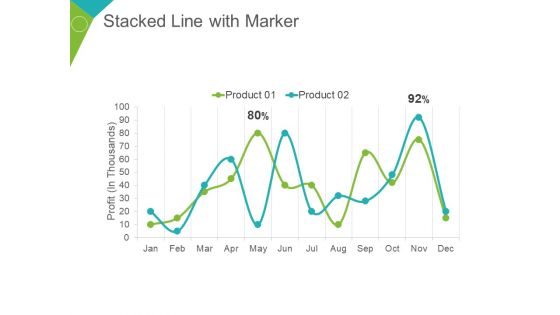
Stacked Line With Marker Ppt PowerPoint Presentation Summary Demonstration
This is a stacked line with marker ppt powerpoint presentation summary demonstration. This is a two stage process. The stages in this process are profit in thousands, product, percentage, finance, business.
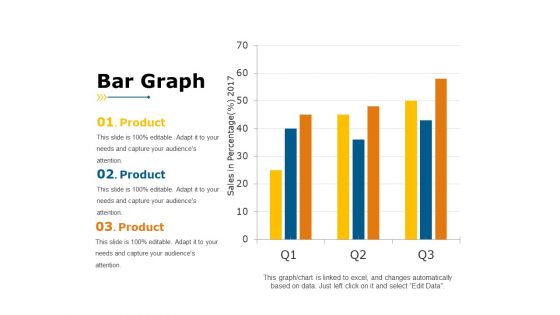
Bar Graph Ppt PowerPoint Presentation Portfolio Example
This is a bar graph ppt powerpoint presentation portfolio example. This is a three stage process. The stages in this process are sales in percentage, year, business, product, business, graph.
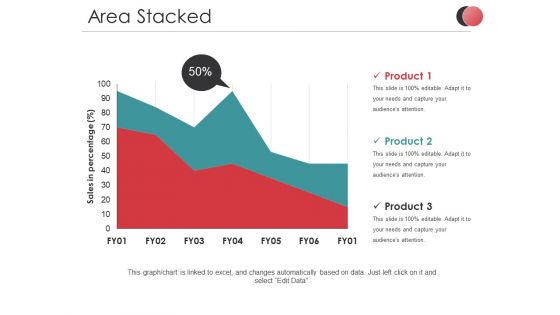
Area Stacked Ppt PowerPoint Presentation Diagram Images
This is a area stacked ppt powerpoint presentation diagram images. This is a two stage process. The stages in this process are sales in percentage, product, business, marketing, finance.
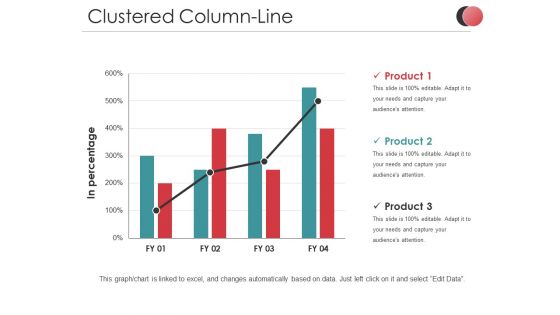
Clustered Column Line Ppt PowerPoint Presentation Infographics Templates
This is a clustered column line ppt powerpoint presentation infographics templates. This is a three stage process. The stages in this process are in percentage, business, marketing, product, finance, graph.
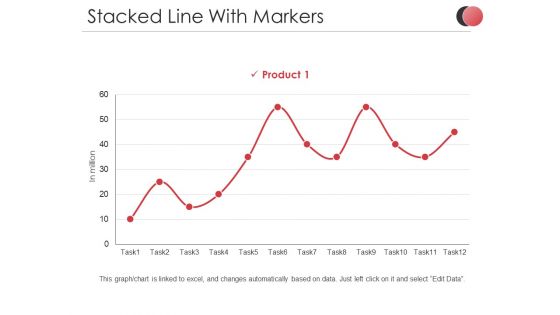
Stacked Line With Markers Ppt PowerPoint Presentation Slides Demonstration
This is a stacked line with markers ppt powerpoint presentation slides demonstration. This is a one stage process. The stages in this process are in million, product, percentage, business, marketing, finance.
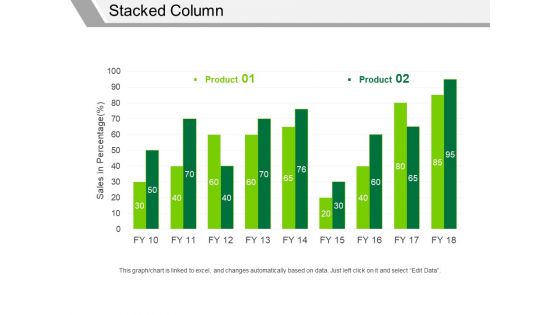
Stacked Column Ppt PowerPoint Presentation Infographics Samples
This is a stacked column ppt powerpoint presentation infographics samples. This is a two stage process. The stages in this process are product, sales in percentage, business, marketing, graph.
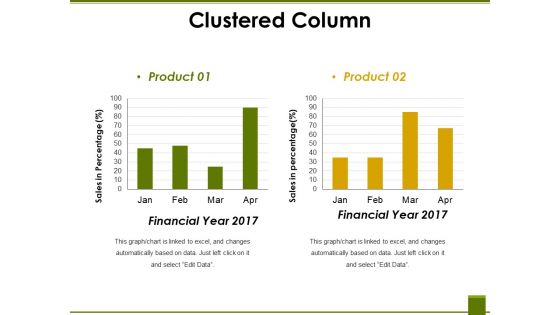
Clustered Column Ppt PowerPoint Presentation Ideas Graphic Tips
This is a clustered column ppt powerpoint presentation ideas graphic tips. This is a two stage process. The stages in this process are financial year, sales in percentage, product, graph, business.
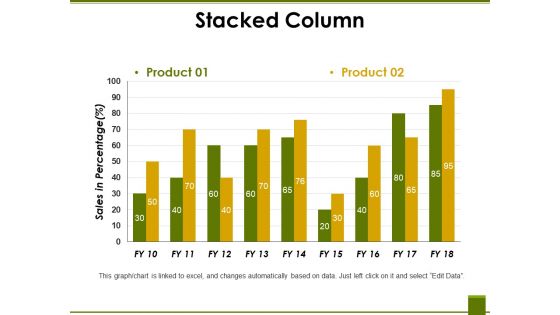
Stacked Column Ppt PowerPoint Presentation Professional Vector
This is a stacked column ppt powerpoint presentation professional vector. This is a two stage process. The stages in this process are product, sales in percentage, business, marketing, graph.
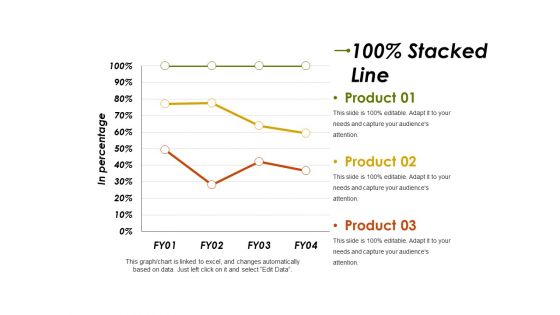
Stacked Line Ppt PowerPoint Presentation Infographic Template Graphics Template
This is a stacked line ppt powerpoint presentation infographic template graphics template. This is a three stage process. The stages in this process are product, in percentage, business, marketing, finance.
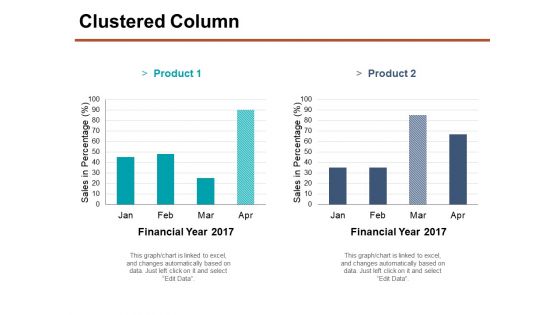
Clustered Column Ppt PowerPoint Presentation Portfolio Smartart
This is a clustered column ppt powerpoint presentation portfolio smartart. This is a two stage process. The stages in this process are financial year, product, sales in percentage, finance, business, graph.
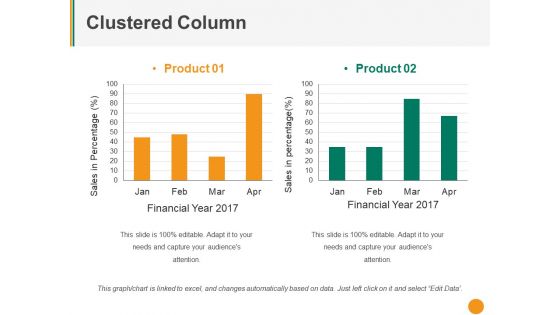
Clustered Column Ppt PowerPoint Presentation Pictures Mockup
This is a clustered column ppt powerpoint presentation pictures mockup. This is a two stage process. The stages in this process are product, sales in percentage, financial year, graph, business.
Open High Low Close Ppt PowerPoint Presentation Icon Model
This is a open high low close ppt powerpoint presentation icon model. This is a five stage process. The stages in this process are high, low, product, business, finance.
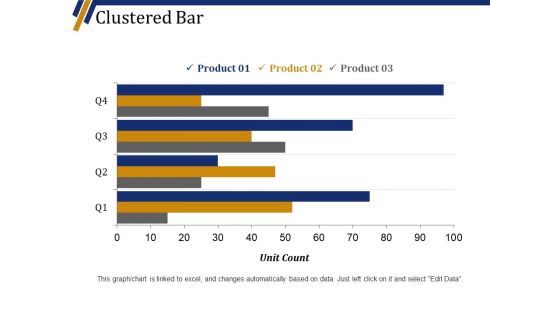
Clustered Bar Ppt PowerPoint Presentation Show Slide Portrait
This is a clustered bar ppt powerpoint presentation show slide portrait. This is a four stage process. The stages in this process are product, unit count, graph, business, marketing.
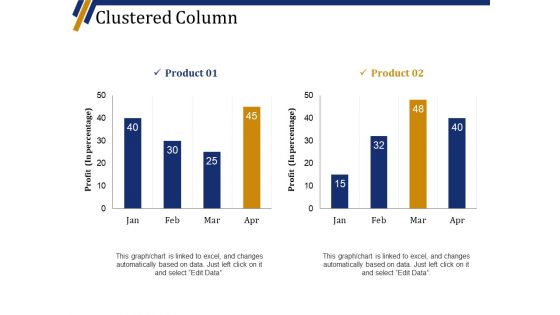
Clustered Column Ppt PowerPoint Presentation Professional Graphic Tips
This is a clustered column ppt powerpoint presentation professional graphic tips. This is a two stage process. The stages in this process are product, profit in percentage, graph, business, marketing.
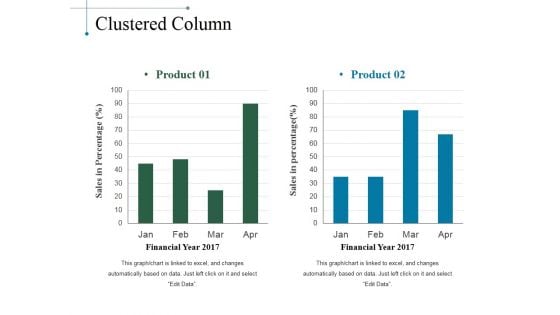
Clustered Column Ppt PowerPoint Presentation Slides Smartart
This is a clustered column ppt powerpoint presentation slides smartart. This is a two stage process. The stages in this process are product, sales in percentage, financial year, bar graph.
Stacked Line Ppt PowerPoint Presentation Icon Format Ideas
This is a stacked line ppt powerpoint presentation icon format ideas. This is a three stage process. The stages in this process are product, in percentage, stacked line, finance.
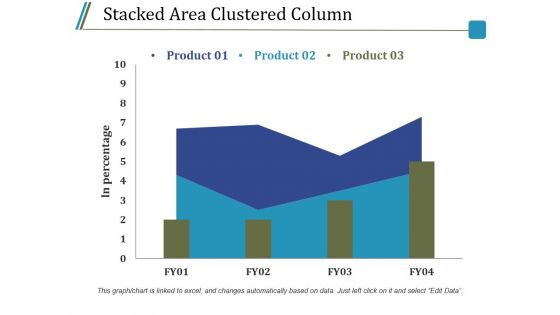
Stacked Area Clustered Column Ppt PowerPoint Presentation Model Guidelines
This is a stacked area clustered column ppt powerpoint presentation model guidelines. This is a three stage process. The stages in this process are product, in percentage, bar graph, growth, success.
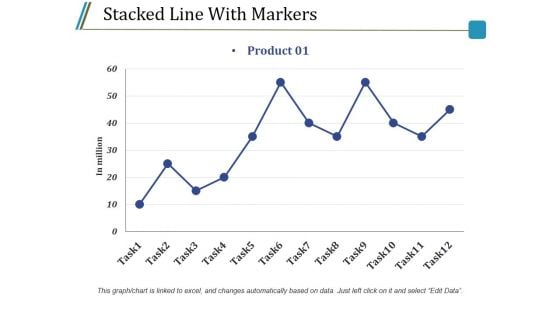
Stacked Line With Markers Ppt PowerPoint Presentation Infographic Template Graphics Example
This is a stacked line with markers ppt powerpoint presentation infographic template graphics example. This is a one stage process. The stages in this process are in million, task, product, finance, line graph.
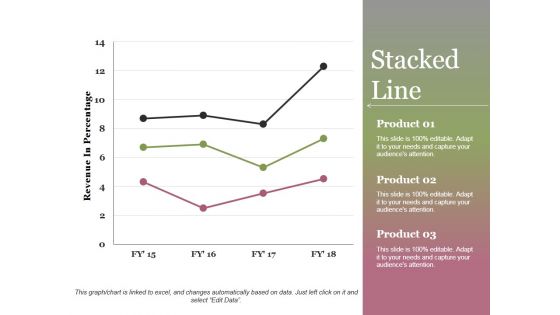
Stacked Line Ppt PowerPoint Presentation Show
This is a stacked line ppt powerpoint presentation show. This is a three stage process. The stages in this process are revenue in percentage, product, stacked line, growth, success.
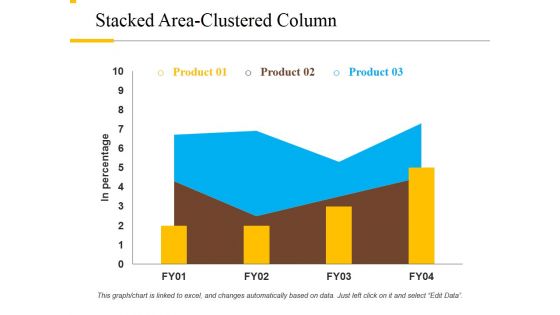
Stacked Area Clustered Column Ppt PowerPoint Presentation File Background Designs
This is a stacked area clustered column ppt powerpoint presentation file background designs. This is a three stage process. The stages in this process are product, in percentage, growth, success, bar graph.
Stacked Line With Markers Ppt PowerPoint Presentation Icon Themes
This is a stacked line with markers ppt powerpoint presentation icon themes. This is a one stage process. The stages in this process are product, in million, tasks, line graph, success.
Clustered Column Line Ppt PowerPoint Presentation Icon Ideas
This is a clustered column line ppt powerpoint presentation icon ideas. This is a three stage process. The stages in this process are product, in percentage, bar graph, success, growth.
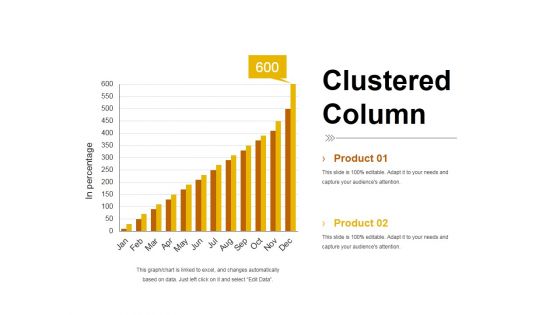
Clustered Column Template 2 Ppt PowerPoint Presentation Summary Smartart
This is a clustered column template 2 ppt powerpoint presentation summary smartart. This is a two stage process. The stages in this process are product, bar graph, in percentage, clustered column, growth.
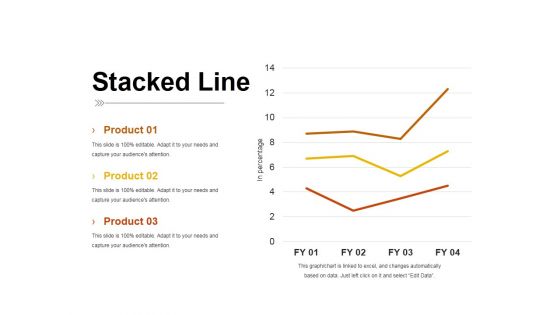
Stacked Line Ppt PowerPoint Presentation Inspiration Pictures
This is a stacked line ppt powerpoint presentation inspiration pictures. This is a three stage process. The stages in this process are product, stacked line, in percentage, business, growth.
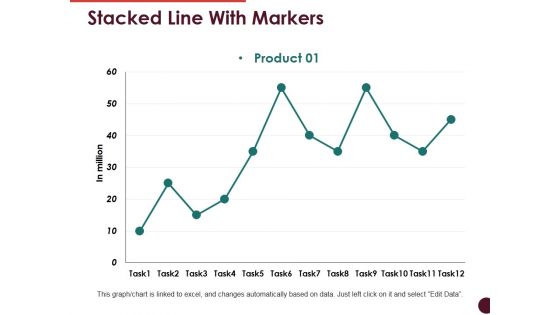
Stacked Line With Markers Ppt PowerPoint Presentation Show Templates
This is a stacked line with markers ppt powerpoint presentation show templates. This is a one stage process. The stages in this process are product, bar graph, growth, success, business.
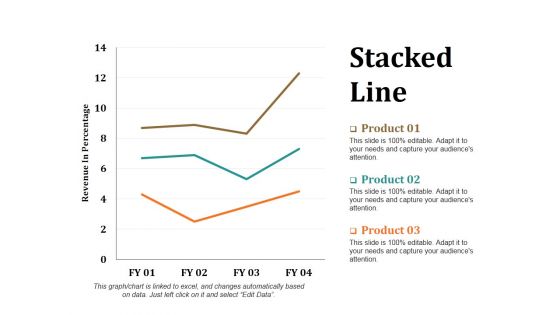
Stacked Line Ppt PowerPoint Presentation Layouts Portrait
This is a stacked line ppt powerpoint presentation layouts portrait. This is a three stage process. The stages in this process are revenue in percentage, stacked line, product, growth, success.
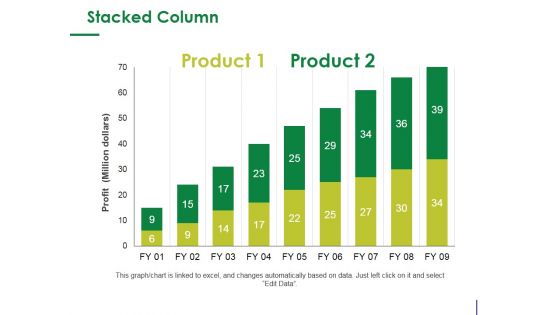
Stacked Column Ppt PowerPoint Presentation Infographic Template Design Ideas
This is a stacked column ppt powerpoint presentation infographic template design ideas. This is a two stage process. The stages in this process are product, profit, bar graph, growth, success.
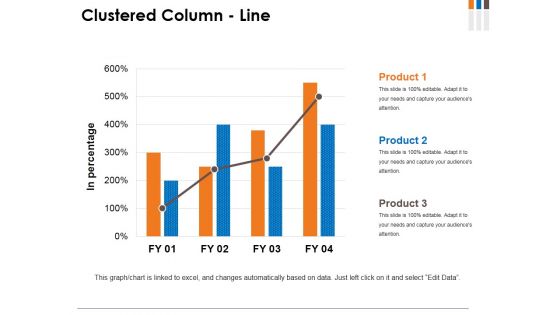
Clustered Column Line Ppt PowerPoint Presentation Summary Background Image
This is a clustered column line ppt powerpoint presentation summary background image. This is a four stage process. The stages in this process are in percentage, product, graph, growth, success.
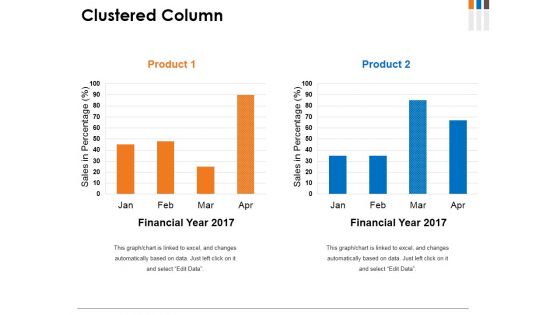
Clustered Column Ppt PowerPoint Presentation File Graphics
This is a clustered column ppt powerpoint presentation file graphics. This is a two stage process. The stages in this process are product, financial year, sales in percentage, graph, growth.
Clustered Column Line Ppt PowerPoint Presentation Icon Good
This is a clustered column line ppt powerpoint presentation icon good. This is a three stage process. The stages in this process are product, financial year, bar graph, business, growth.
Sales KPI Tracker Ppt PowerPoint Presentation Icon Themes
This is a sales kpi tracker ppt powerpoint presentation icon themes. This is a six stage process. The stages in this process are business, marketing, opportunities won, top products in revenue, leads created.

Sales Kpi Performance Summary Ppt PowerPoint Presentation Ideas Graphics Template
This is a sales kpi performance summary ppt powerpoint presentation ideas graphics template. This is a seven stage process. The stages in this process are revenue comparison, quantity comparison, product sales mix, regional sales mix.
Sales Kpi Tracker Ppt PowerPoint Presentation Pictures Designs
This is a sales kpi tracker ppt powerpoint presentation pictures designs. This is a two stage process. The stages in this process are leads created, sales ratio, opportunities won, top products in revenue, win ratio vs last yr.
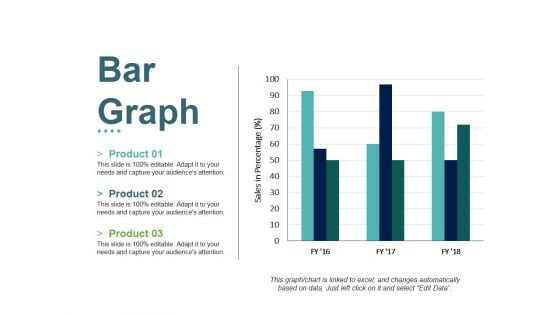
Bar Graph Ppt PowerPoint Presentation File Slides
This is a bar graph ppt powerpoint presentation file slides. This is a three stage process. The stages in this process are product, sales in percentage, bar graph, growth, success.
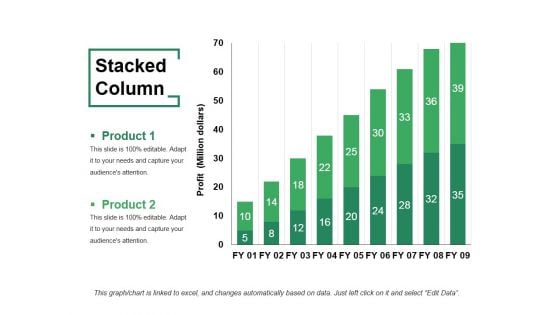
Stacked Column Ppt PowerPoint Presentation Layouts Example
This is a stacked column ppt powerpoint presentation layouts example. This is a two stage process. The stages in this process are product, stacked column, bar graph, growth, success.
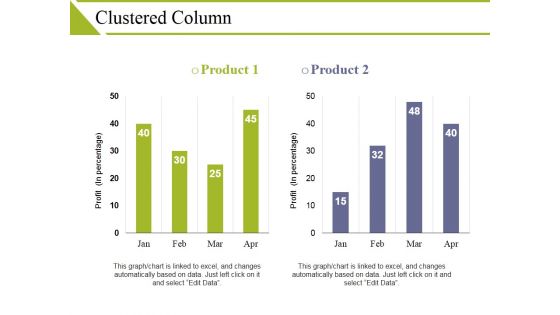
Clustered Column Ppt PowerPoint Presentation Visual Aids Show
This is a clustered column ppt powerpoint presentation visual aids show. This is a two stage process. The stages in this process are product, profit, business, bar graph, finance.


 Continue with Email

 Home
Home


