Map Infographics
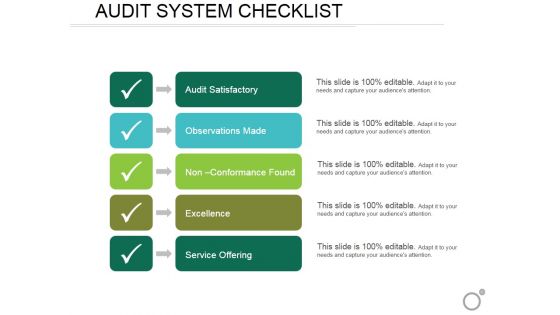
Audit System Checklist Ppt PowerPoint Presentation Infographics Show
This is a audit system checklist ppt powerpoint presentation infographics show. This is a five stage process. The stages in this process are audit satisfactory, observations made, non conformance found, excellence, service offering.
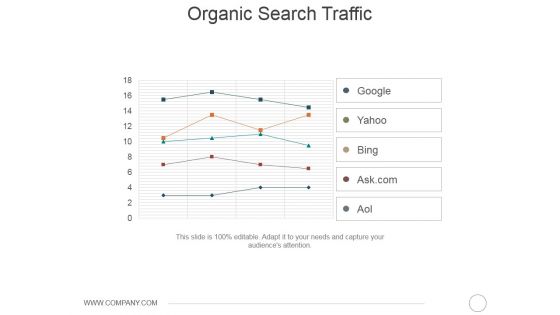
Organic Search Traffic Ppt PowerPoint Presentation Infographics Show
This is a organic search traffic ppt powerpoint presentation infographics show. This is a five stage process. The stages in this process are google, yahoo, bing, ask com, aol.
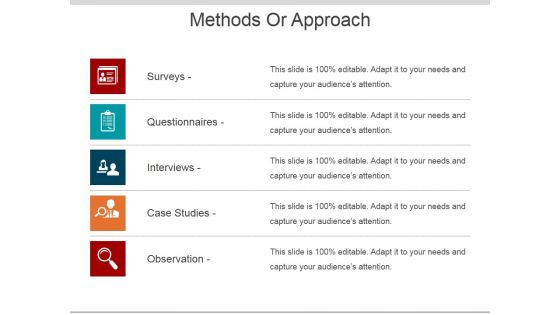
Methods Or Approach Ppt PowerPoint Presentation Infographics Gallery
This is a methods or approach ppt powerpoint presentation infographics gallery. This is a five stage process. The stages in this process are surveys, questionnaires, interviews, case studies, observation.
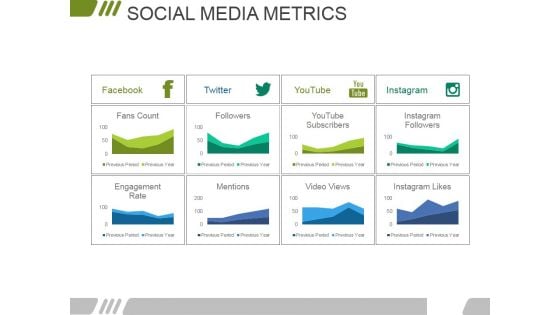
Social Media Metrics Ppt PowerPoint Presentation Infographics Gallery
This is a social media metrics ppt powerpoint presentation infographics gallery. This is a four stage process. The stages in this process are facebook, twitter, youtube, instagram, fans count.
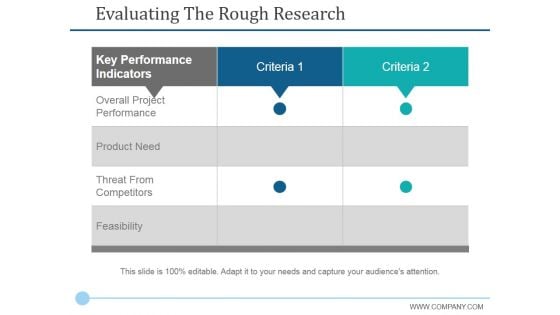
Evaluating The Rough Research Ppt PowerPoint Presentation Infographics Ideas
This is a evaluating the rough research ppt powerpoint presentation infographics ideas. This is a two stage process. The stages in this process are key performance indicators, overall project performance, product need.
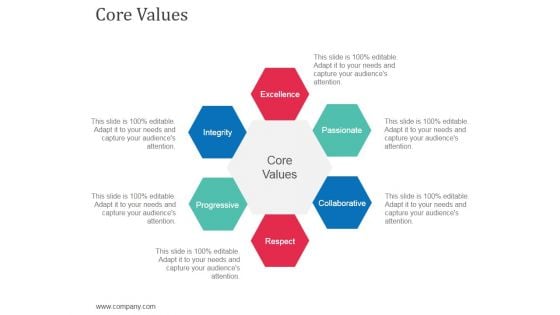
Core Values Template 1 Ppt Powerpoint Presentation Infographics Example Topics
This is a core values template 1 ppt powerpoint presentation infographics example topics. This is a six stage process. The stages in this process are excellence, passionate, core values, integrity.
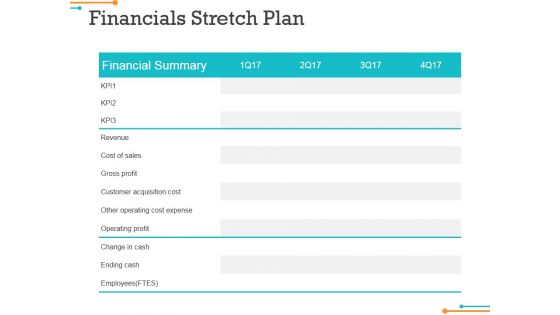
Financials Stretch Plan Ppt Powerpoint Presentation Infographics Background Image
This is a financials stretch plan ppt powerpoint presentation infographics background image. This is a four stage process. The stages in this process are financial summary, revenue, cost of sales, gross profit.
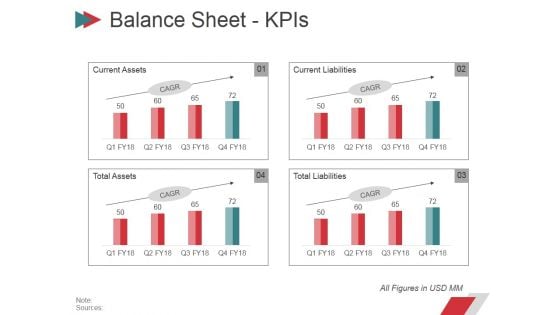
Balance Sheet Kpis Ppt PowerPoint Presentation Infographics Example File
This is a balance sheet kpis ppt powerpoint presentation infographics example file. This is a four stage process. The stages in this process are current investments, inventories, trade receivables, cash and bank balances, current assets.
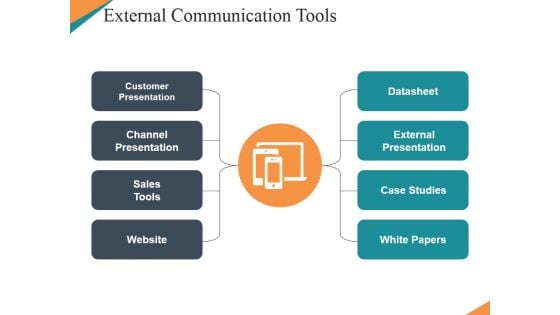
External Communication Tools Ppt PowerPoint Presentation Infographics Summary
This is a external communication tools ppt powerpoint presentation infographics summary. This is a eight stage process. The stages in this process are customer presentation, channel presentation, sales tools, website, datasheet.

About Our Company Ppt PowerPoint Presentation Infographics Guidelines
This is a about our company ppt powerpoint presentation infographics guidelines. This is a three stage process. The stages in this process are target audiences, preferred by many, values client.
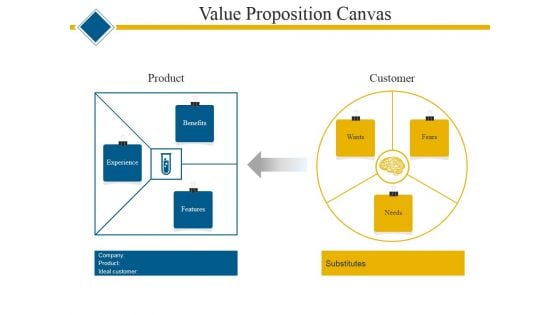
Value Proposition Canvas Ppt PowerPoint Presentation Infographics Example
This is a value proposition canvas ppt powerpoint presentation infographics example. This is a two stage process. The stages in this process are product, customer, benefits, features, experience, wants, fears, needs.
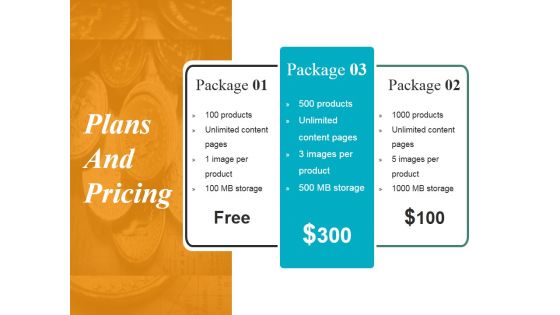
Plans And Pricing Ppt PowerPoint Presentation Infographics Portfolio
This is a plans and pricing ppt powerpoint presentation infographics portfolio. This is a three stage process. The stages in this process are package, free, images per product, unlimited content pages.
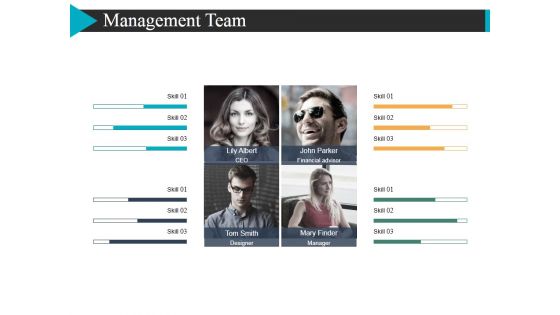
Management Team Template 2 Ppt Powerpoint Presentation Infographics Demonstration
This is a management team template 2 ppt powerpoint presentation infographics demonstration. This is a four stage process. The stages in this process are lily albert ceo, john parker financial advisor, tom smith designer.
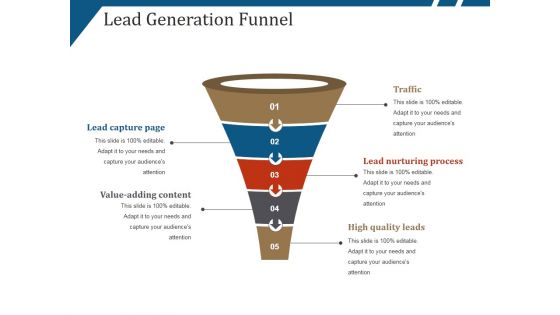
Lead Generation Funnel Ppt PowerPoint Presentation Infographics Background
This is a lead generation funnel ppt powerpoint presentation infographics background. This is a five stage process. The stages in this process are traffic, lead capture page, high quality leads.
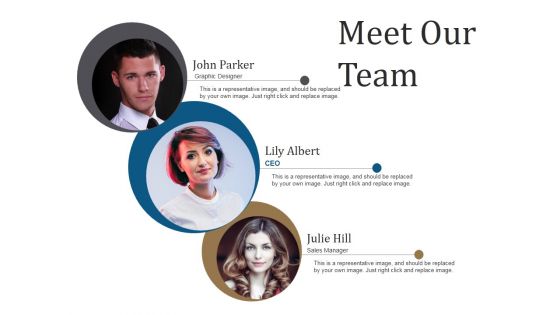
Meet Our Team Ppt PowerPoint Presentation Infographics Templates
This is a meet our team ppt powerpoint presentation infographics templates. This is a three stage process. The stages in this process are graphic designer, ceo, sales manager, teamwork, business.

Client Testimonials Template 1 Ppt PowerPoint Presentation Infographics Clipart Images
This is a client testimonials template 1 ppt powerpoint presentation infographics clipart images. This is a one stage process. The stages in this process are designation, teamwork, communication, business.

Timeline Continued Template 2 Ppt PowerPoint Presentation Infographics Objects
This is a timeline continued template 2 ppt powerpoint presentation infographics objects. This is a two stage process. The stages in this process are year, growth, success, time planning, business.
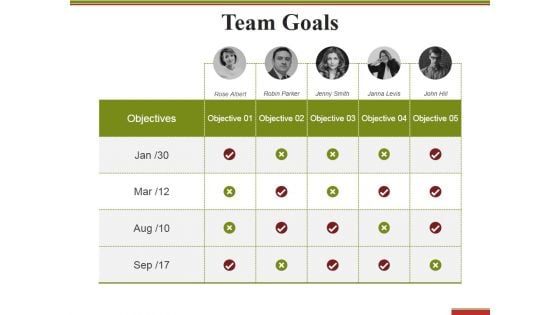
Team Goals Template 2 Ppt PowerPoint Presentation Infographics Structure
This is a team goals template 2 ppt powerpoint presentation infographics structure. This is a five stage process. The stages in this process are objectives, teamwork, table, compare, communication.
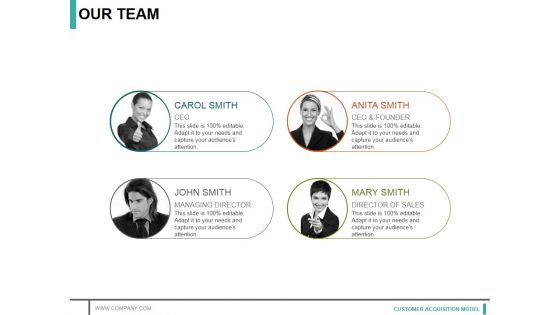
Our Team Ppt PowerPoint Presentation Infographics Background Image
This is a our team ppt powerpoint presentation infographics background image. This is a four stage process. The stages in this process are ceo, ceo and founder, managing director, director of sales.
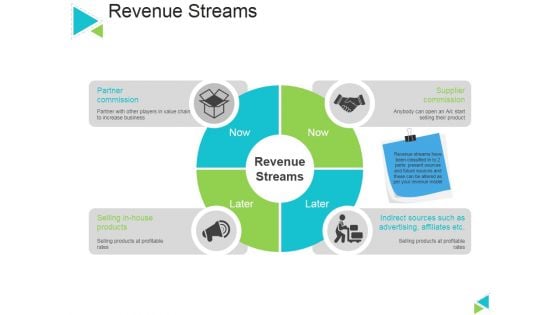
Revenue Streams Ppt PowerPoint Presentation Infographics Example Topics
This is a revenue streams ppt powerpoint presentation infographics example topics. This is a four stage process. The stages in this process are partner commission, selling in house products, indirect sources such as advertising, affiliates etc, supplier commission, revenue streams.
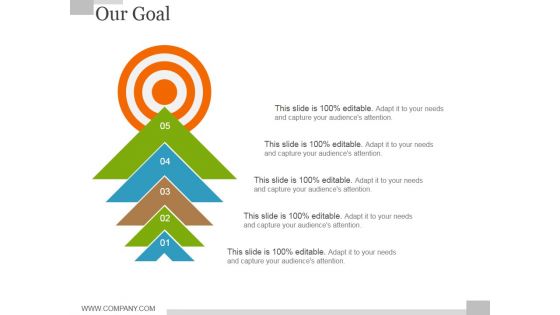
Our Goal Ppt PowerPoint Presentation Infographics Graphics Pictures
This is a our goal ppt powerpoint presentation infographics graphics pictures. This is a five stage process. The stages in this process are our goals, target, success, business, achievement.
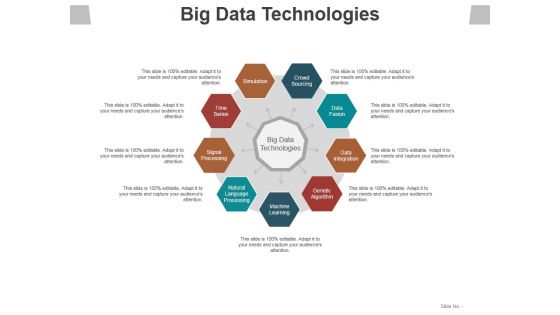
Big Data Technologies Ppt PowerPoint Presentation Infographics Example Introduction
This is a big data technologies ppt powerpoint presentation infographics example introduction. This is a nine stage process. The stages in this process are time series, signal processing, natural language processing, machine learning, genetic algorithm.
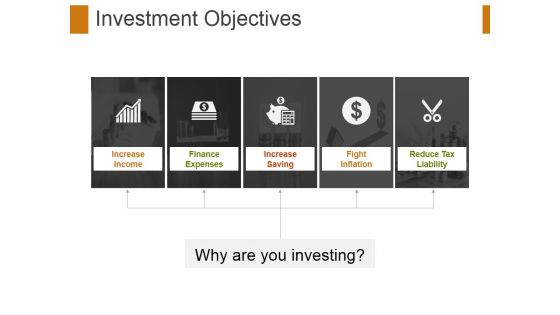
Investment Objectives Ppt PowerPoint Presentation Infographics Graphic Tips
This is a investment objectives ppt powerpoint presentation infographics graphic tips. This is a five stage process. The stages in this process are increase income, finance, finance expenses, increase saving, fight inflation, reduce tax liability.
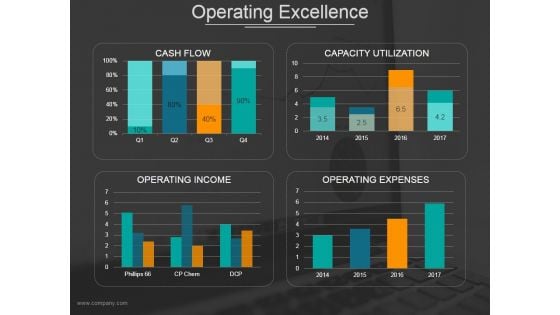
Operating Excellence Ppt PowerPoint Presentation Infographics Example Introduction
This is a operating excellence ppt powerpoint presentation infographics example introduction. This is a four stage process. The stages in this process are cash flow, operating income, capacity utilization, operating expenses.
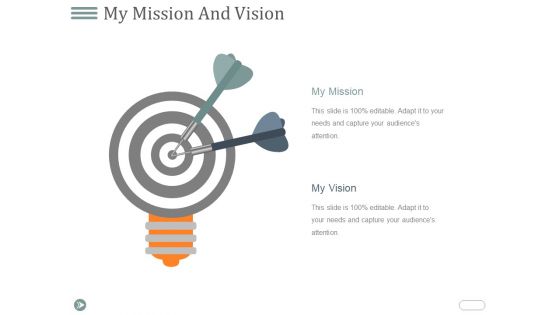
My Mission And Vision Ppt PowerPoint Presentation Infographics Pictures
This is a my mission and vision ppt powerpoint presentation infographics pictures. This is a two stage process. The stages in this process are my mission, my vision, target, vision, mission.
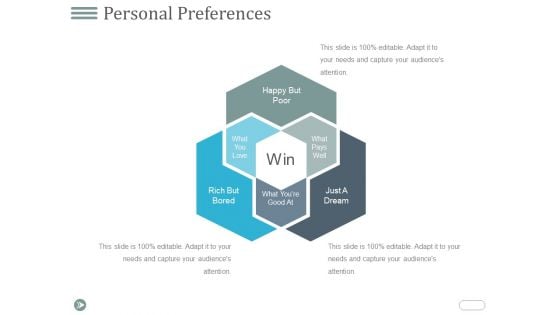
Personal Preferences Template 2 Ppt PowerPoint Presentation Infographics Vector
This is a personal preferences template 2 ppt powerpoint presentation infographics vector. This is a three stage process. The stages in this process are happy but poor, just a dream, rich but bored, win, what pays well.
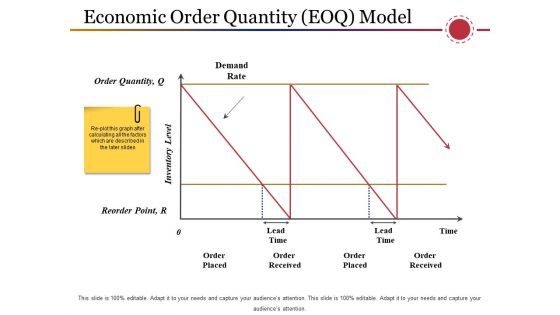
Economic Order Quantity Eoq Model Ppt PowerPoint Presentation Infographics Information
This is a economic order quantity eoq model ppt powerpoint presentation infographics information. This is a four stage process. The stages in this process are order placed, lead time, time, demand rate, lead time.
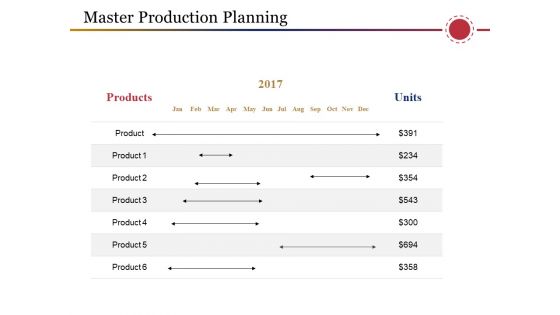
Master Production Planning Template 1 Ppt PowerPoint Presentation Infographics Tips
This is a master production planning template 1 ppt powerpoint presentation infographics tips. This is a two stage process. The stages in this process are products, units, years, business, planning.
My Goal Ppt PowerPoint Presentation Infographics Design Ideas
This is a my goal ppt powerpoint presentation infographics design ideas. This is a three stage process. The stages in this process are our goals, target, success, business, achievement.
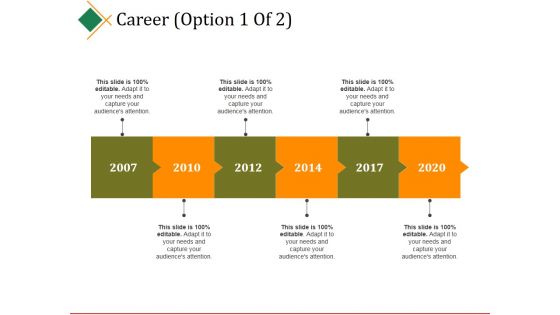
Career Template 1 Ppt PowerPoint Presentation Infographics Tips
This is a career template 1 ppt powerpoint presentation infographics tips. This is a six stage process. The stages in this process are year, growth, success, time planning, business.
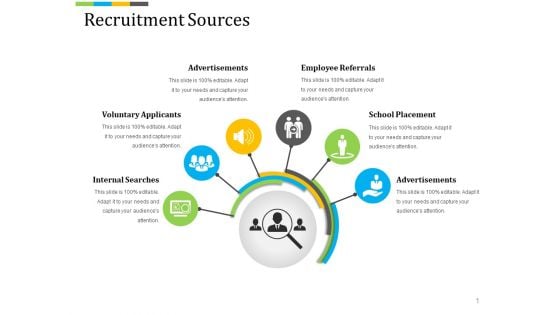
Recruitment Sources Ppt PowerPoint Presentation Infographics Design Ideas
This is a recruitment sources ppt powerpoint presentation infographics design ideas. This is a six stage process. The stages in this process are internal searches, voluntary applicants, advertisements, employee referrals, school placement.
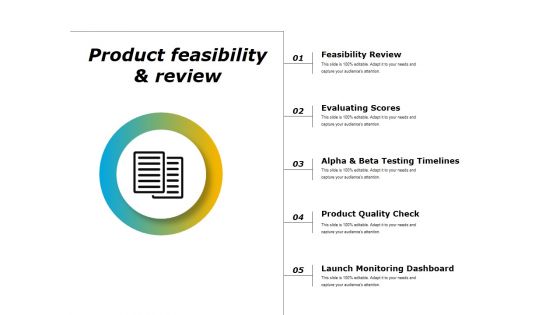
Product Feasibility And Review Ppt PowerPoint Presentation Infographics Design Inspiration
This is a product feasibility and review ppt powerpoint presentation infographics design inspiration. This is a five stage process. The stages in this process are feasibility review, evaluating scores, alpha and beta testing timelines, product quality check, launch monitoring dashboard.
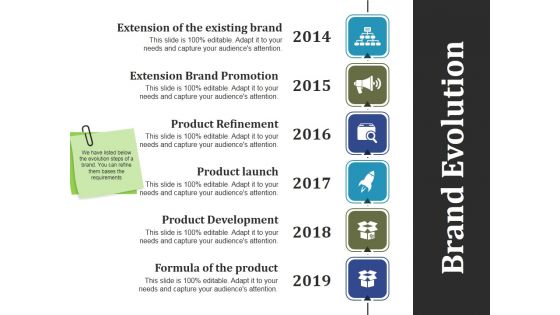
Brand Evolution Template 1 Ppt PowerPoint Presentation Infographics Samples
This is a brand evolution template 1 ppt powerpoint presentation infographics samples. This is a six stage process. The stages in this process are product refinement, product launch, product development, formula of the product, brand evolution.
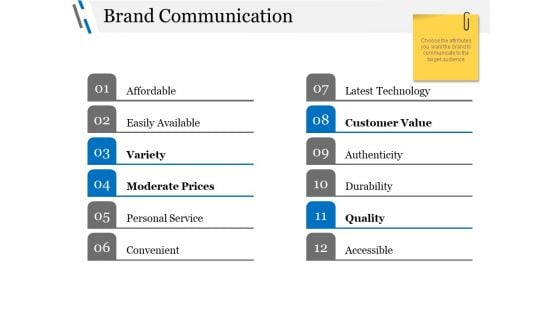
Brand Communication Ppt PowerPoint Presentation Infographics Master Slide
This is a brand communication ppt powerpoint presentation infographics master slide. This is a twelve stage process. The stages in this process are affordable, easily available, variety, moderate prices, personal service.
Brand Tracking Product Awareness Ppt PowerPoint Presentation Infographics Graphics
This is a brand tracking product awareness ppt powerpoint presentation infographics graphics. This is a four stage process. The stages in this process are ad awareness, brand awareness, preference, latest purchase, business.
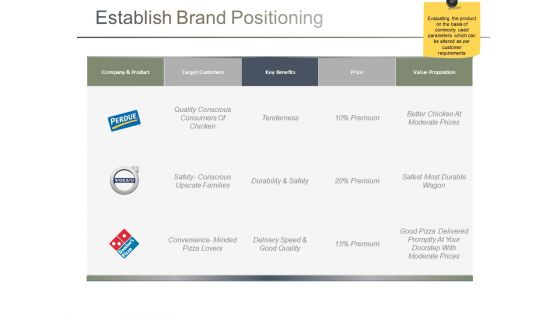
Establish Brand Positioning Ppt PowerPoint Presentation Infographics Themes
This is a establish brand positioning ppt powerpoint presentation infographics themes. This is a three stage process. The stages in this process are target customers, company and product, key benefits, price, value proposition.
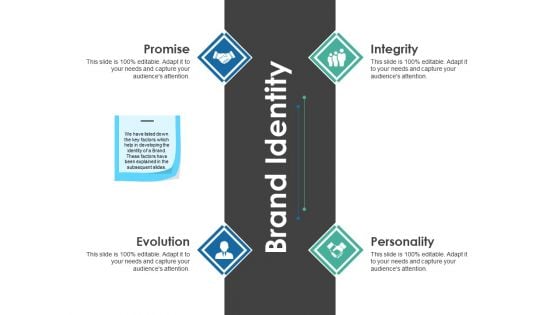
Brand Identity Ppt PowerPoint Presentation Infographics Graphics Template
This is a brand identity ppt powerpoint presentation infographics graphics template. This is a four stage process. The stages in this process are promise, evolution, integrity, personality, business, icons.
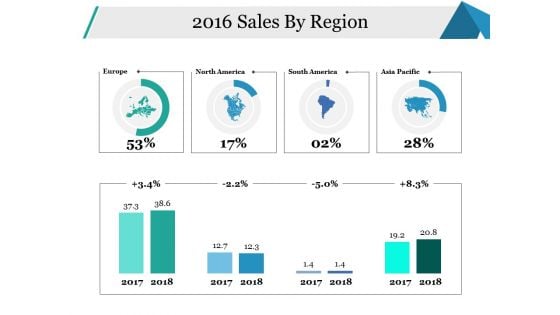
Sales By Region Ppt PowerPoint Presentation Infographics Example
This is a sales by region ppt powerpoint presentation infographics example. This is a five stage process. The stages in this process are europe, north america, south america, asia pacific, business.
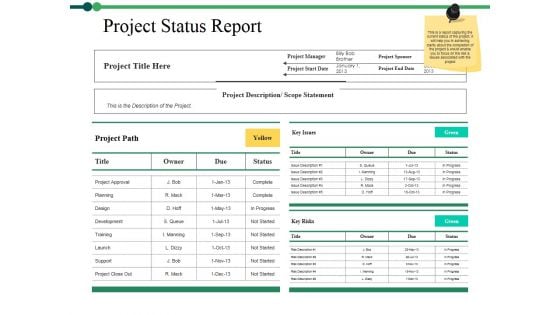
Project Status Report Ppt PowerPoint Presentation Infographics Graphics Example
This is a project status report ppt powerpoint presentation infographics graphics example. This is a three stage process. The stages in this process are project approval, planning, design, training, support.
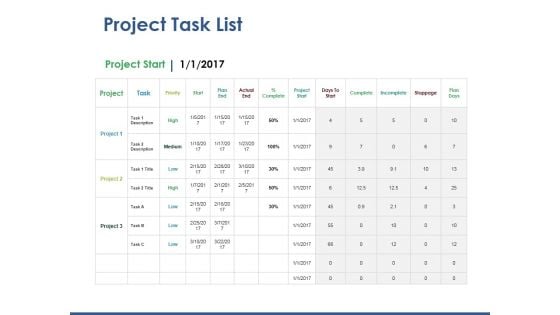
Project Task List Template 1 Ppt PowerPoint Presentation Infographics Portrait
This is a project task list template 1 ppt powerpoint presentation infographics portrait. This is a three stage process. The stages in this process are priority, start, plan end, actual end, complete, incomplete.
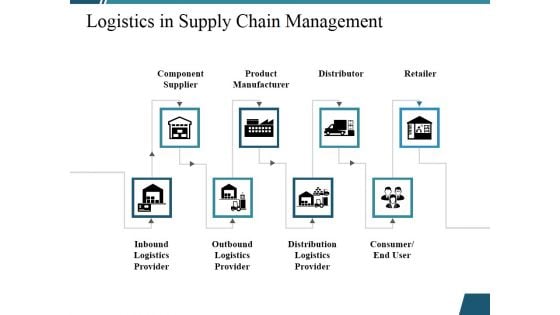
Logistics In Supply Chain Management Ppt PowerPoint Presentation Infographics Layout
This is a logistics in supply chain management ppt powerpoint presentation infographics layout. This is a eight stage process. The stages in this process are component supplier, product manufacturer, distributor, retailer, inbound logistics provider, outbound logistics provider, distribution logistics provider.
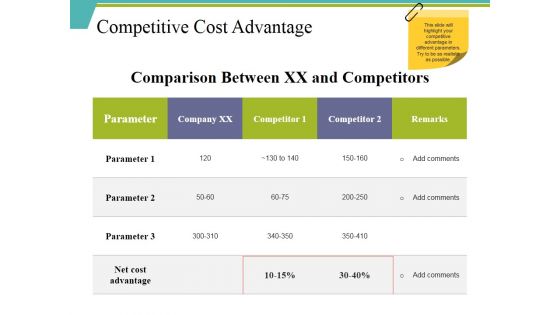
Competitive Cost Advantage Ppt PowerPoint Presentation Infographics Ideas
This is a competitive cost advantage ppt powerpoint presentation infographics ideas. This is a three stage process. The stages in this process are parameter, company, competitor, remarks, net cost advantage.

Business Model Template 2 Ppt PowerPoint Presentation Infographics Guide
This is a business model template 2 ppt powerpoint presentation infographics guide. This is a four stage process. The stages in this process are process, icons, strategy, arrows, business.
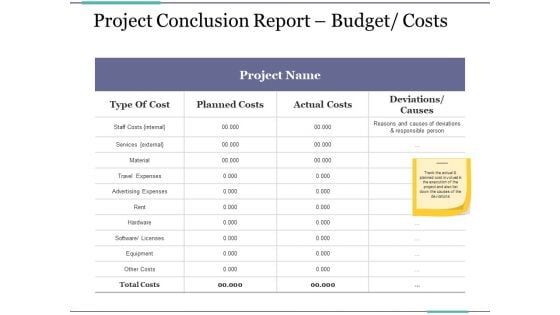
Project Conclusion Report Budget Costs Ppt PowerPoint Presentation Infographics Structure
This is a project conclusion report budget costs ppt powerpoint presentation infographics structure. This is a four stage process. The stages in this process are type of cost, planned costs, actual costs, deviations causes, business.

Risk Assessment Plan Ppt PowerPoint Presentation Infographics Designs Download
This is a risk assessment plan ppt powerpoint presentation infographics designs download. This is a seven stage process. The stages in this process are activity steps, potential hazards risks, risk rating, risk control measures, risk rating.
Technology Intellectual Property Template 2 Ppt PowerPoint Presentation Infographics Ideas
This is a technology intellectual property template 2 ppt powerpoint presentation infographics ideas. This is a one stage process. The stages in this process are technology, intellectual property, business, management, hand.
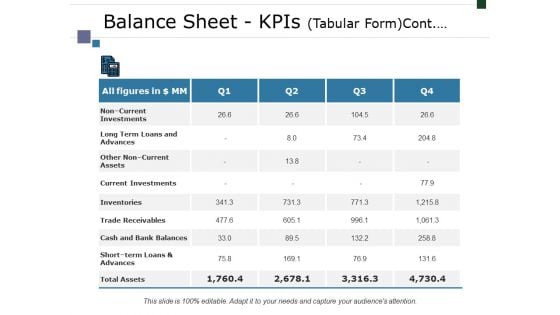
Balance Sheet Kpis Tabular Formcont Ppt PowerPoint Presentation Infographics Visuals
This is a balance sheet kpis tabular formcont ppt powerpoint presentation infographics visuals. This is a four stage process. The stages in this process are noncurrent, investments, long term loans and advances, current investments, inventories.
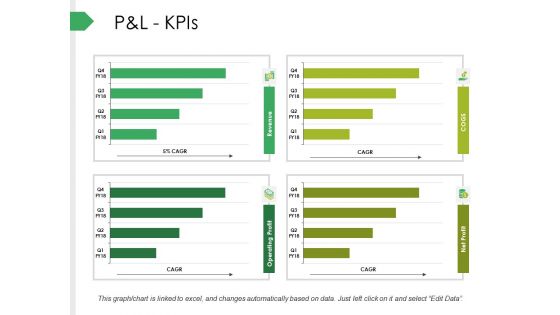
P And L Kpis Ppt PowerPoint Presentation Infographics Background
This is a p and l kpis ppt powerpoint presentation infographics background. This is a four stage process. The stages in this process are net sales, expenses, ebitda, profit before tax, profit after tax.
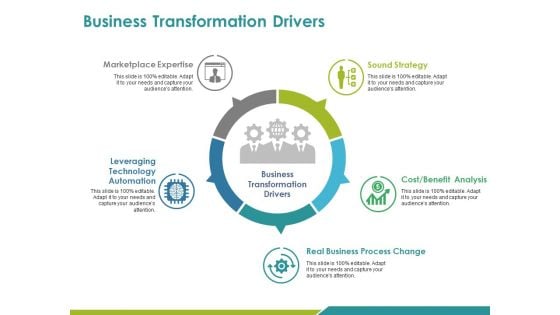
Business Transformation Drivers Ppt PowerPoint Presentation Infographics Display
This is a business transformation drivers ppt powerpoint presentation infographics display. This is a five stage process. The stages in this process are sound strategy, cost, marketplace expertise, business transformation drivers.

Key Financial Ratios Ppt PowerPoint Presentation Infographics Files
This is a key financial ratios ppt powerpoint presentation infographics files. This is a four stage process. The stages in this process are return on assets, return on equity, return on investment, current ratio, debt to equity ratio.
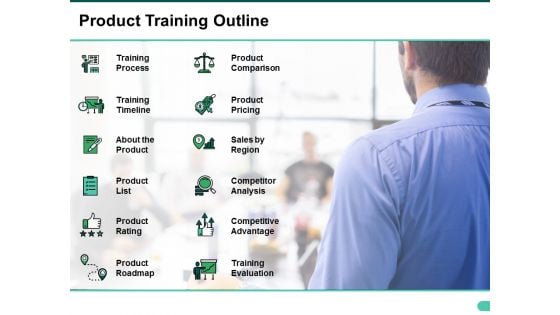
Product Training Outline Ppt PowerPoint Presentation Infographics Design Inspiration
This is a product training outline ppt powerpoint presentation infographics design inspiration. This is a tweleve stage process. The stages in this process are training process, training timeline, about the product, product list, product rating.
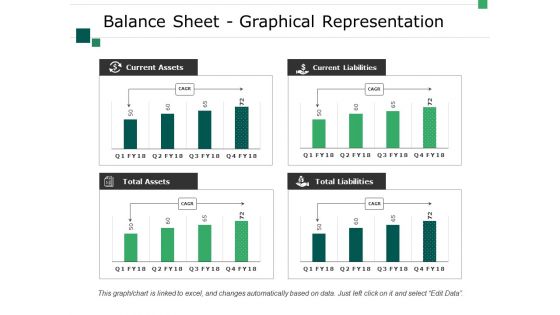
Balance Sheet Graphical Representation Ppt PowerPoint Presentation Infographics Layouts
This is a balance sheet graphical representation ppt powerpoint presentation infographics layouts. This is a four stage process. The stages in this process are business, current assets, total assets, total liabilities, current liabilities.
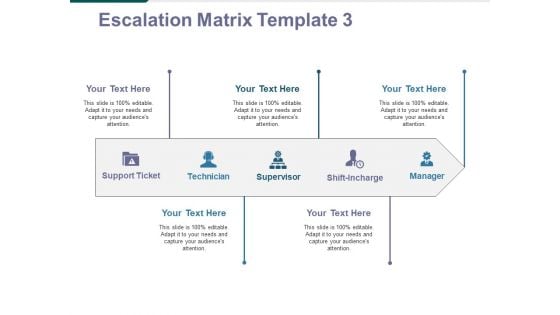
Escalation Matrix Template 3 Ppt PowerPoint Presentation Infographics Diagrams
This is a escalation matrix template 3 ppt powerpoint presentation infographics diagrams. This is a five stage process. The stages in this process are support ticket, technician, supervisor, shift incharge, manager.
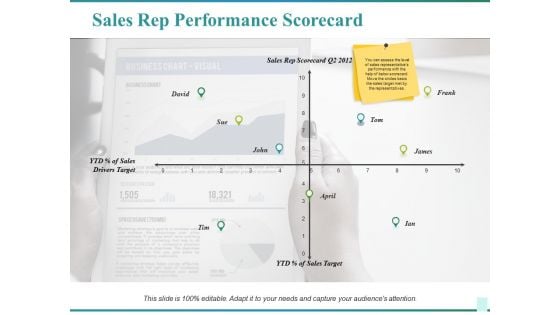
Sales Rep Performance Scorecard Ppt PowerPoint Presentation Infographics Slides
This is a sales rep performance scorecard ppt powerpoint presentation infographics slides. This is a four stage process. The stages in this process are drivers target, david, sales rep scorecard, sales target, frank.
Event Planning Guide With Icons Ppt PowerPoint Presentation Infographics Ideas
This is a event planning guide with icons ppt powerpoint presentation infographics ideas. This is a four stage process. The stages in this process are project management, event management, event planning.
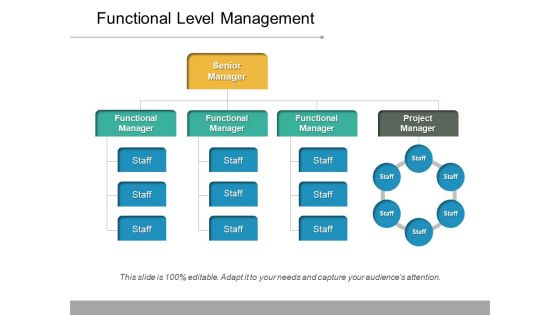
Functional Level Management Ppt PowerPoint Presentation Infographics Images
This is a functional level management ppt powerpoint presentation infographics images. This is a three stage process. The stages in this process are organization chart, org chart, project team structure.

Six Steps Circular Process Ppt PowerPoint Presentation Infographics Background Image
This is a six steps circular process ppt powerpoint presentation infographics background image. This is a six stage process. The stages in this process are 6 circular arrows, 6 circle arrows, 6 cycle arrows.
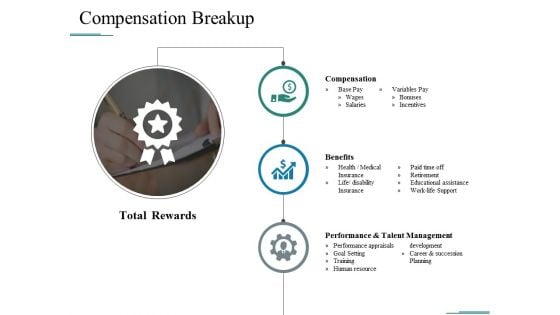
Compensation Breakup Ppt PowerPoint Presentation Infographics Layout Ideas
This is a compensation breakup ppt powerpoint presentation infographics layout ideas. This is a three stage process. The stages in this process are compensation, benefits, performance and talent management, total rewards.
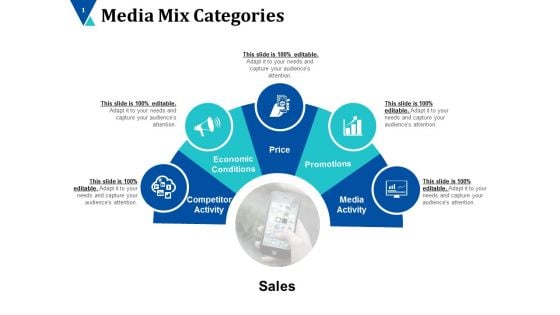
Media Mix Categories Ppt PowerPoint Presentation Infographics Introduction
This is a media mix categories ppt powerpoint presentation infographics introduction. This is a five stage process. The stages in this process are competitor activity, economic conditions, price, promotions, media activity.

Artificial Intelligence Development Phases Ppt PowerPoint Presentation Infographics Good
This is a artificial intelligence development phases ppt powerpoint presentation infographics good. This is a three stage process. The stages in this process are artificial, intelligence, development, phases, planning.


 Continue with Email

 Home
Home


