Map Infographics
State Risk Evaluation Process Icon Infographics Pdf
Showcasing this set of slides titled State Risk Evaluation Process Icon Infographics Pdf. The topics addressed in these templates are State Risk, Evaluation Process. All the content presented in this PPT design is completely editable. Download it and make adjustments in color, background, font etc. as per your unique business setting. Our State Risk Evaluation Process Icon Infographics Pdf are topically designed to provide an attractive backdrop to any subject. Use them to look like a presentation pro.
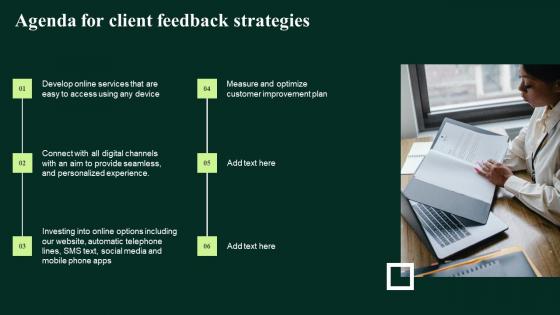
Agenda For Client Feedback Strategies Infographics Pdf
Do you have an important presentation coming up Are you looking for something that will make your presentation stand out from the rest Look no further than Agenda For Client Feedback Strategies Infographics Pdf. With our professional designs, you can trust that your presentation will pop and make delivering it a smooth process. And with Slidegeeks, you can trust that your presentation will be unique and memorable. So why wait Grab Agenda For Client Feedback Strategies Infographics Pdf today and make your presentation stand out from the rest Our Agenda For Client Feedback Strategies Infographics Pdf are topically designed to provide an attractive backdrop to any subject. Use them to look like a presentation pro.

Financial Transition Tools Comparative Analysis Infographics Pdf
This slide presents top financial transformation tools and solutions for organisations, helpful in managing quick and easy evolution. It includes Redwood Finance Automation, Blackline, PWC, Deloitte and Accenture Pitch your topic with ease and precision using this Financial Transition Tools Comparative Analysis Infographics Pdf This layout presents information on Redwood Finance Automation, Financial Process It is also available for immediate download and adjustment. So, changes can be made in the color, design, graphics or any other component to create a unique layout. This slide presents top financial transformation tools and solutions for organisations, helpful in managing quick and easy evolution. It includes Redwood Finance Automation, Blackline, PWC, Deloitte and Accenture
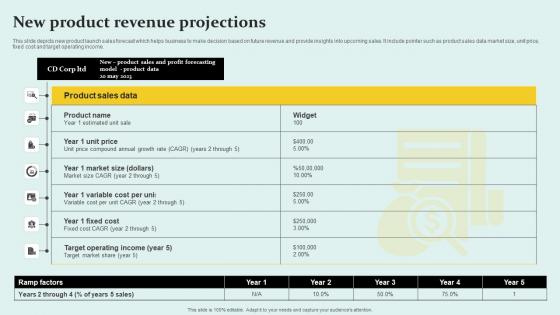
New Product Revenue Projections Infographics Pdf
This slide depicts new product launch sales forecast which helps business to make decision based on future revenue and provide insights into upcoming sales. It include pointer such as product sales data market size, unit price, fixed cost and target operating income. Showcasing this set of slides titled New Product Revenue Projections Infographics Pdf The topics addressed in these templates are Product Sales Data, Market Size, Target Operating All the content presented in this PPT design is completely editable. Download it and make adjustments in color, background, font etc. as per your unique business setting. This slide depicts new product launch sales forecast which helps business to make decision based on future revenue and provide insights into upcoming sales. It include pointer such as product sales data market size, unit price, fixed cost and target operating income.
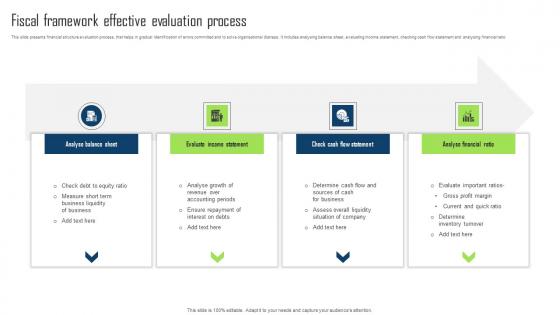
Fiscal Framework Effective Evaluation Process Infographics Pdf
This slide presents financial structure evaluation process, that helps in gradual identification of errors committed and to solve organisational distress. It includes analysing balance sheet, evaluating income statement, checking cash flow statement and analysing financial ratio. Pitch your topic with ease and precision using this Fiscal Framework Effective Evaluation Process Infographics Pdf. This layout presents information on Analyse Balance Sheet, Analyse Financial Ratio, Check Cash Flow Statement. It is also available for immediate download and adjustment. So, changes can be made in the color, design, graphics or any other component to create a unique layout. This slide presents financial structure evaluation process, that helps in gradual identification of errors committed and to solve organisational distress. It includes analysing balance sheet, evaluating income statement, checking cash flow statement and analysing financial ratio.
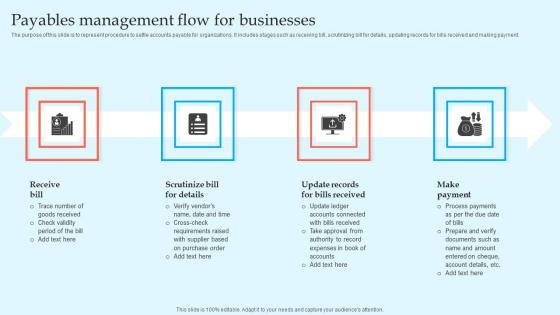
Payables Management Flow For Businesses Infographics Pdf
The purpose of this slide is to represent procedure to settle accounts payable for organizations. It includes stages such as receiving bill, scrutinizing bill for details, updating records for bills received and making payment.Showcasing this set of slides titled Payables Management Flow For Businesses Infographics Pdf The topics addressed in these templates are Accounts Connected, Documents Such, Supplier Based All the content presented in this PPT design is completely editable. Download it and make adjustments in color, background, font etc. as per your unique business setting. The purpose of this slide is to represent procedure to settle accounts payable for organizations. It includes stages such as receiving bill, scrutinizing bill for details, updating records for bills received and making payment.
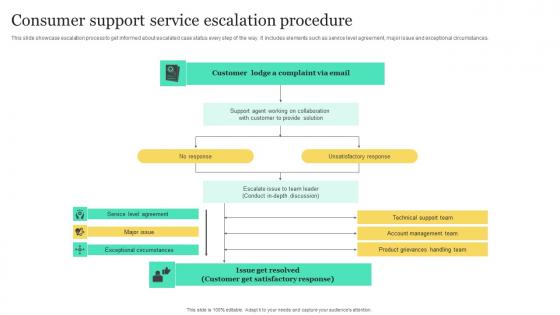
Consumer Support Service Escalation Procedure Infographics Pdf
This slide showcase escalation process to get informed about escalated case status every step of the way. It includes elements such as service level agreement, major issue and exceptional circumstances. Pitch your topic with ease and precision using this Consumer Support Service Escalation Procedure Infographics Pdf. This layout presents information on Consumer Support, Service Escalation Procedure, Service Level Agreement. It is also available for immediate download and adjustment. So, changes can be made in the color, design, graphics or any other component to create a unique layout. This slide showcase escalation process to get informed about escalated case status every step of the way. It includes elements such as service level agreement, major issue and exceptional circumstances.
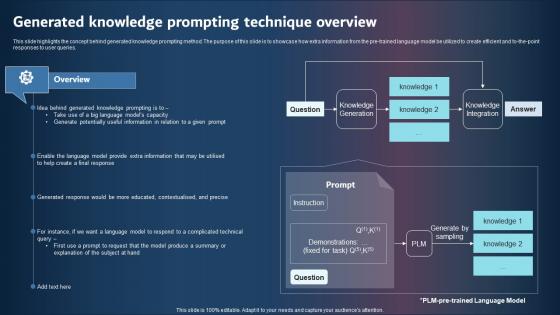
Generated Knowledge Prompting Technique Overview Infographics PDF
This slide highlights the concept behind generated knowledge prompting method. The purpose of this slide is to showcase how extra information from the pre-trained language model be utilized to create efficient and to-the-point responses to user queries. This modern and well-arranged Generated Knowledge Prompting Technique Overview Infographics Pdf provides lots of creative possibilities. It is very simple to customize and edit with the Powerpoint Software. Just drag and drop your pictures into the shapes. All facets of this template can be edited with Powerpoint, no extra software is necessary. Add your own material, put your images in the places assigned for them, adjust the colors, and then you can show your slides to the world, with an animated slide included. This slide highlights the concept behind generated knowledge prompting method. The purpose of this slide is to showcase how extra information from the pre-trained language model be utilized to create efficient and to-the-point responses to user queries.
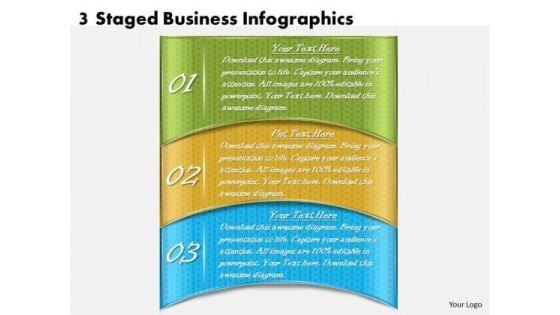
Timeline Ppt Template 3 Staged Business Infographics
Document The Process On Our Timeline Ppt Template 3 Staged Business Infographics Powerpoint Templates. Make A Record Of Every Detail.
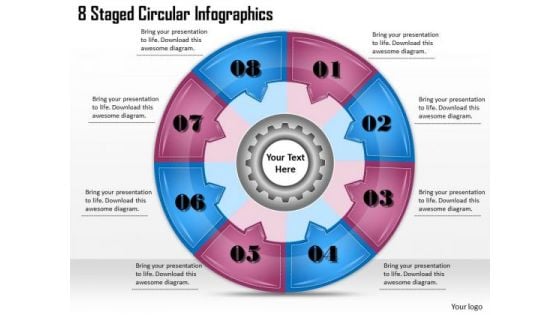
Timeline Ppt Template 8 Staged Circular Infographics
Open Up Doors That Lead To Success. Our Timeline Ppt Template 8 Staged Circular Infographics Powerpoint Templates Provide The Handles.
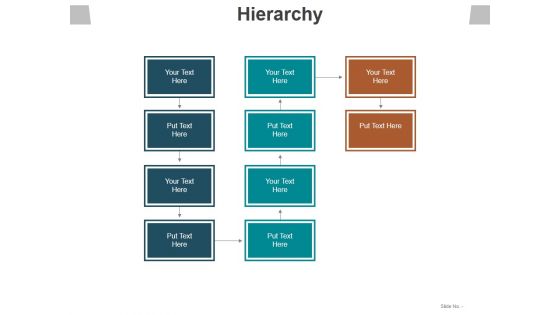
Hierarchy Ppt PowerPoint Presentation Infographics Themes
This is a hierarchy ppt powerpoint presentation infographics themes. This is a three stage process. The stages in this process are hierarchy, business, marketing, plan, management.
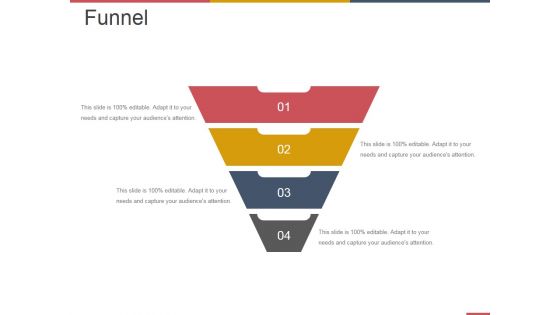
Funnel Ppt PowerPoint Presentation Infographics Deck
This is a funnel ppt powerpoint presentation infographics deck. This is a four stage process. The stages in this process are business, strategy, marketing, funnel.

Funnel Ppt Powerpoint Presentation Infographics Brochure
This is a funnel ppt powerpoint presentation infographics brochure. This is a six stage process. The stages in this process are funnel, marketing, business, strategy.
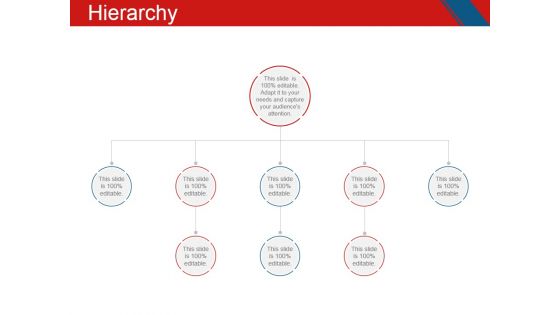
Hierarchy Ppt PowerPoint Presentation Infographics Graphic Images
This is a hierarchy ppt powerpoint presentation infographics graphic images. This is a eight stage process. The stages in this process are business, chart, organization, process, structure.
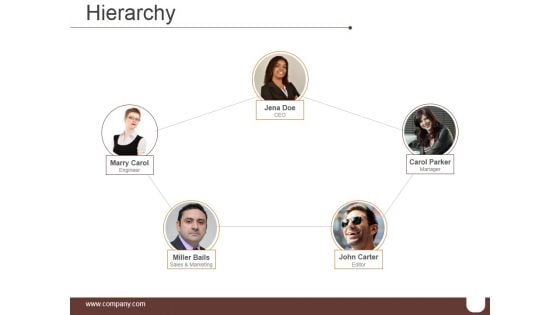
Hierarchy Ppt PowerPoint Presentation Infographics Diagrams
This is a hierarchy ppt powerpoint presentation infographics diagrams. This is a five stage process. The stages in this process are ceo, engineer, sales and marketing, editor, manager.
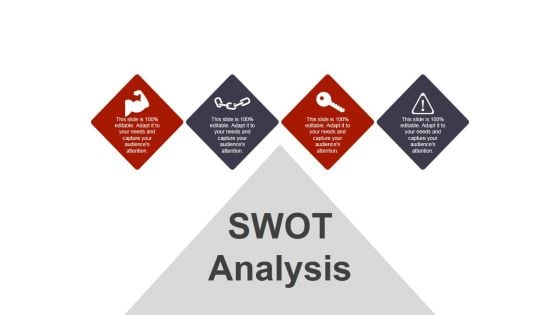
Swot Analysis Ppt PowerPoint Presentation Infographics Outline
This is a swot analysis ppt powerpoint presentation infographics outline. This is a four stage process. The stages in this process are swot analysis, business, marketing, success, strategy.
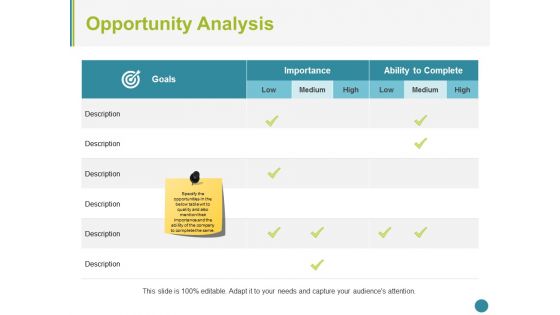
Opportunity Analysis Ppt PowerPoint Presentation Infographics Themes
This is a Opportunity Analysis Ppt PowerPoint Presentation Infographics Themes. This is a three stage process. The stages in this process are opportunity analysis, low, medium, high, business.
Comparison Marketing Ppt PowerPoint Presentation Infographics Icon
This is a comparison marketing ppt powerpoint presentation infographics icon. This is a two stage process. The stages in this process are comparison, marketing, management, business, planning.
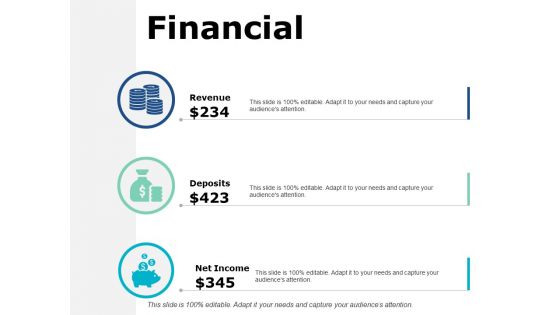
Financial Marketing Ppt PowerPoint Presentation Infographics Pictures
This is a financial marketing ppt powerpoint presentation infographics pictures. This is a three stage process. The stages in this process are finance, analysis, business, investment, marketing.
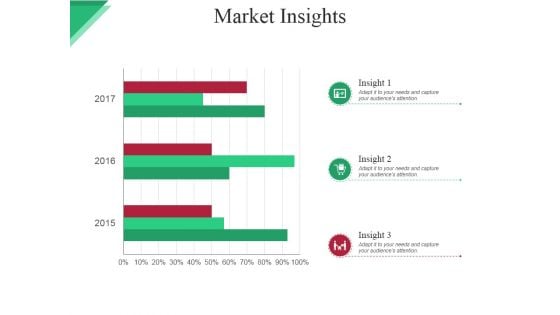
Market Insights Ppt PowerPoint Presentation Infographics Graphics
This is a market insights ppt powerpoint presentation infographics graphics. This is a three stage process. The stages in this process are icons, business, bar, marketing, strategy.
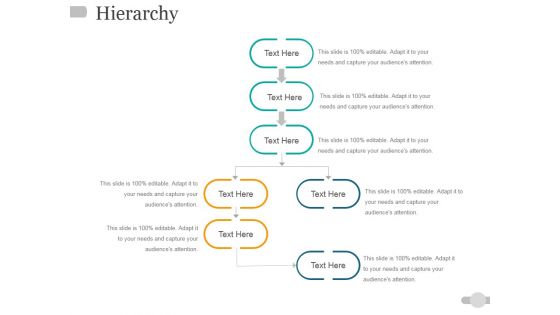
Hierarchy Ppt PowerPoint Presentation Infographics Guidelines
This is a hierarchy ppt powerpoint presentation infographics guidelines. This is a seven stage process. The stages in this process are business, process, marketing, strategy, success.
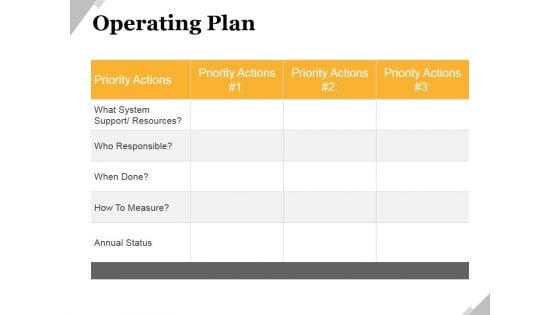
Operating Plan Ppt PowerPoint Presentation Infographics Backgrounds
This is a operating plan ppt powerpoint presentation infographics backgrounds. This is a three stage process. The stages in this process are business, management, planning, strategy, marketing.

Financials Ppt PowerPoint Presentation Infographics Guidelines
This is a financials ppt powerpoint presentation infographics guidelines. This is a three stage process. The stages in this process are business, finance, investment, marketing, strategy, analysis.
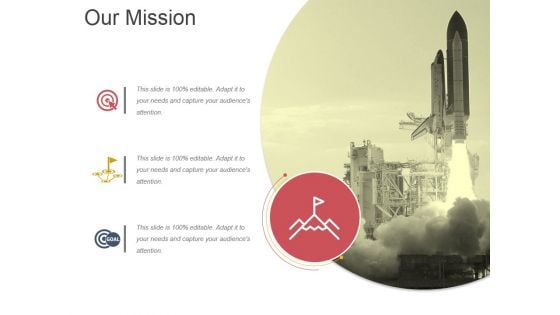
Our Mission Ppt PowerPoint Presentation Infographics Introduction
This is a our mission ppt powerpoint presentation infographics introduction. This is a one stage process. The stages in this process are business, strategy, marketing, analysis, our mission.
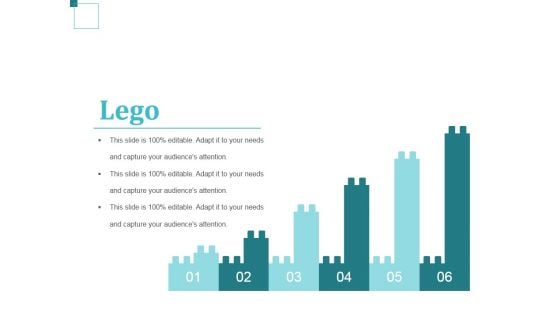
Lego Ppt PowerPoint Presentation Infographics Themes
This is a lego ppt powerpoint presentation infographics themes. This is a six stage process. The stages in this process are business, strategy, analysis, marketing, lego.
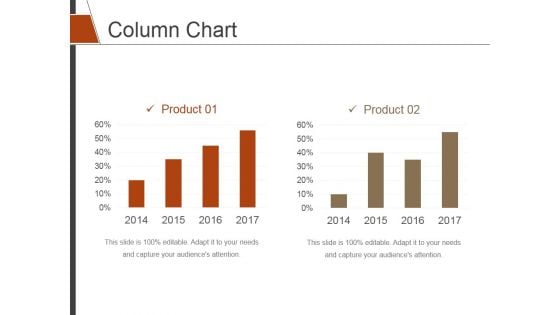
Column Chart Ppt PowerPoint Presentation Infographics Display
This is a column chart ppt powerpoint presentation infographics display. This is a two stage process. The stages in this process are column chart, finance, marketing, strategy, analysis.
Pie Chart Ppt PowerPoint Presentation Infographics Icons
This is a pie chart ppt powerpoint presentation infographics icons. This is a three stage process. The stages in this process are pie chart, finance, analysis, marketing, strategy.
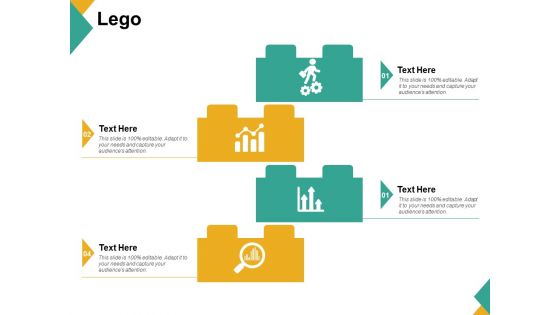
Lego Ppt PowerPoint Presentation Infographics Background Images
This is a lego ppt powerpoint presentation infographics background images. This is a four stage process. The stages in this process are lego, game, management, analysis, business.
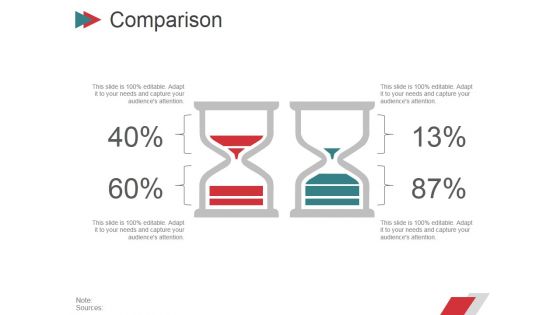
Comparison Ppt PowerPoint Presentation Infographics Images
This is a comparison ppt powerpoint presentation infographics images. This is a two stage process. The stages in this process are business, strategy, marketing, planning, finance, comparison.
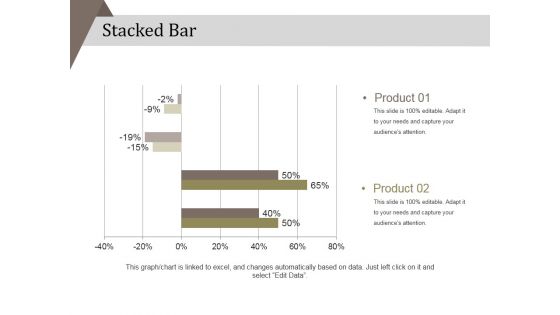
Stacked Bar Ppt PowerPoint Presentation Infographics Inspiration
This is a stacked bar ppt powerpoint presentation infographics inspiration. This is a two stage process. The stages in this process are product, percentage, finance, business, marketing.
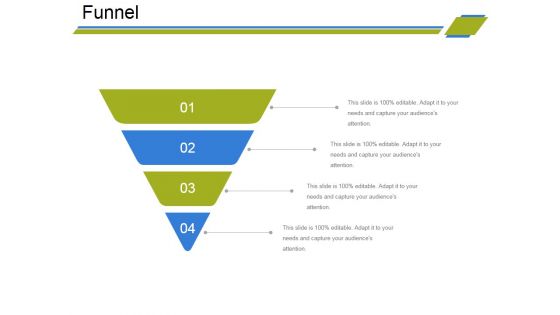
Funnel Ppt PowerPoint Presentation Infographics Guide
This is a funnel ppt powerpoint presentation infographics guide. This is a four stage process. The stages in this process are funnel, marketing, strategy, analysis, sales, business.
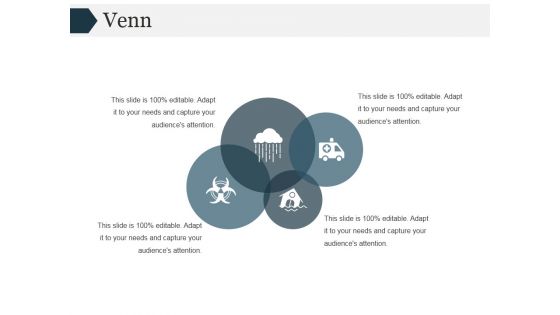
Venn Ppt PowerPoint Presentation Infographics Smartart
This is a venn ppt powerpoint presentation infographics smartart. This is a four stage process. The stages in this process are venn, marketing, sale, analysis, business, management.
Silhouettes Ppt PowerPoint Presentation Infographics Microsoft
This is a silhouettes ppt powerpoint presentation infographics microsoft. This is a three stage process. The stages in this process are business, strategy, marketing, analysis, silhouettes.
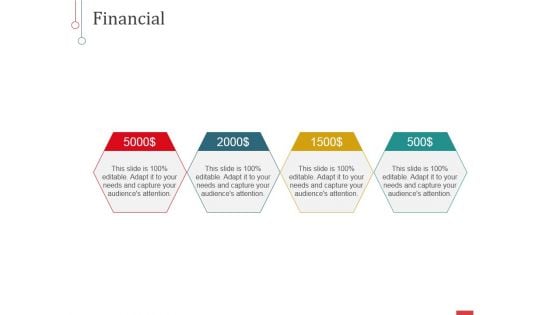
Financial Ppt PowerPoint Presentation Infographics Microsoft
This is a financial ppt powerpoint presentation infographics microsoft. This is a four stage process. The stages in this process are business, finance, marketing, strategy, analysis, investment.
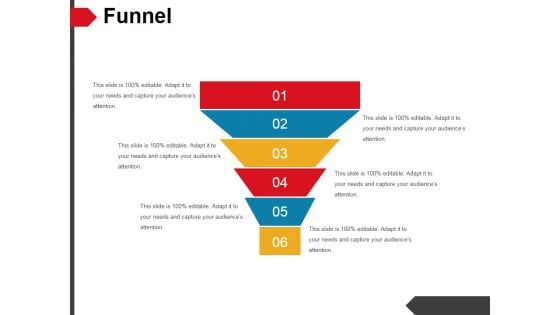
Funnel Ppt PowerPoint Presentation Infographics Templates
This is a funnel ppt powerpoint presentation infographics templates. This is a six stage process. The stages in this process are funnel, marketing, analysis, strategy, business, sales.
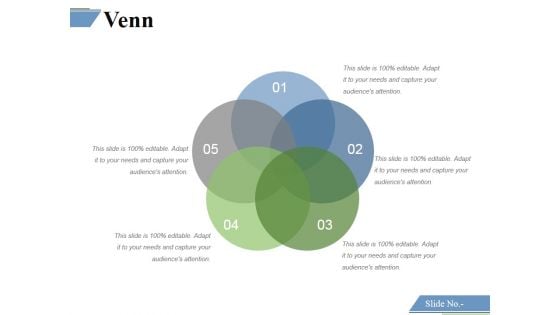
Venn Ppt PowerPoint Presentation Infographics Graphics
This is a venn ppt powerpoint presentation infographics graphics. This is a five stage process. The stages in this process are venn, marketing, strategy, analysis, business.
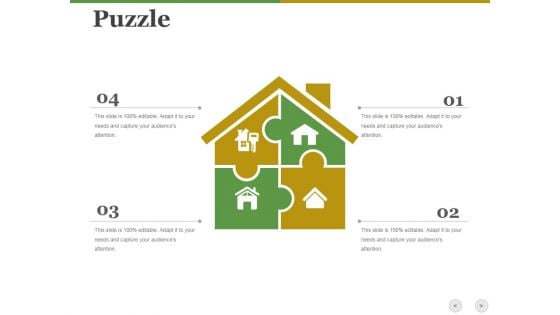
Puzzle Ppt PowerPoint Presentation Infographics Grid
This is a puzzle ppt powerpoint presentation infographics grid. This is a four stage process. The stages in this process are puzzle, marketing, strategy, business, icons, analysis.
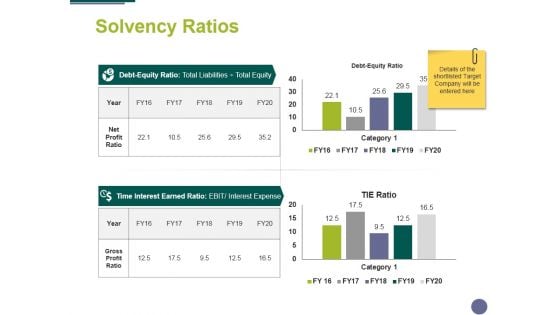
Solvency Ratios Ppt PowerPoint Presentation Infographics Portrait
This is a solvency ratios ppt powerpoint presentation infographics portrait. This is a two stage process. The stages in this process are compere, finance, marketing, analysis, business.
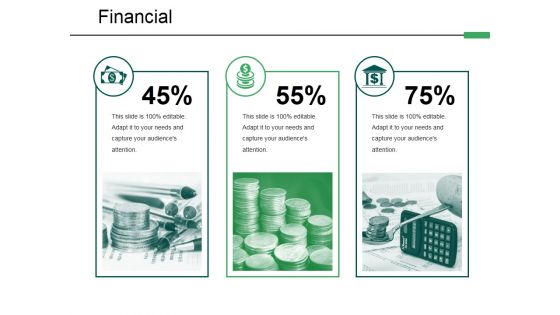
Financial Ppt PowerPoint Presentation Infographics Show
This is a financial ppt powerpoint presentation infographics show. This is a one stage process. The stages in this process are finance, strategy, business, marketing, analysis.

Combo Chart Ppt PowerPoint Presentation Infographics Good
This is a combo chart ppt powerpoint presentation infographics good. This is a three stage process. The stages in this process are combo chart, finance, analysis, business, marketing.
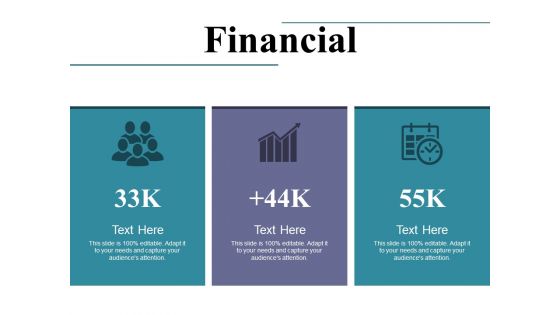
Financial Ppt PowerPoint Presentation Infographics Demonstration
This is a financial ppt powerpoint presentation infographics demonstration. This is a three stage process. The stages in this process are business, marketing, strategy, finance, analysis.
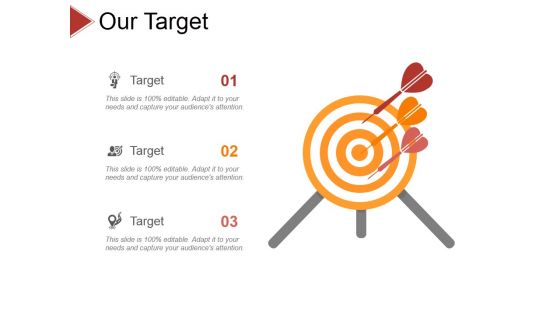
Our Target Ppt PowerPoint Presentation Infographics Summary
This is a our target ppt powerpoint presentation infographics summary. This is a three stage process. The stages in this process are business, strategy, analysis, pretention, target.

Identifying Targets Ppt PowerPoint Presentation Infographics Maker
This is a identifying targets ppt powerpoint presentation infographics maker. This is a six stage process. The stages in this process are identifying targets, management, analysis, business, success.
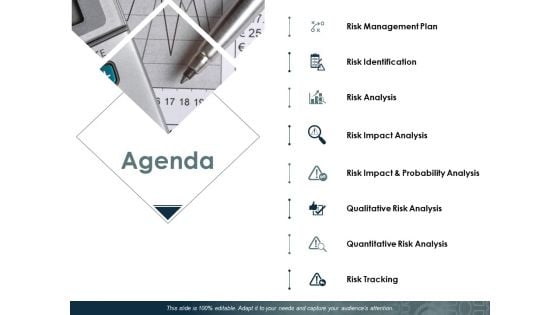
Agenda Ppt PowerPoint Presentation Infographics Designs Download
This is a agenda ppt powerpoint presentation infographics designs download. This is a eight stage process. The stages in this process are risk identification, risk analysis, risk tracking.
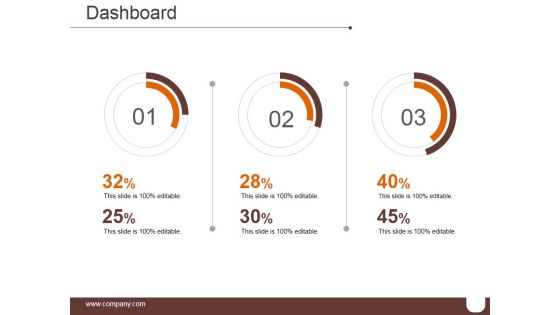
Dashboard Ppt PowerPoint Presentation Infographics Format Ideas
This is a dashboard ppt powerpoint presentation infographics format ideas. This is a three stage process. The stages in this process are speed, meter, business, marketing, equipment.
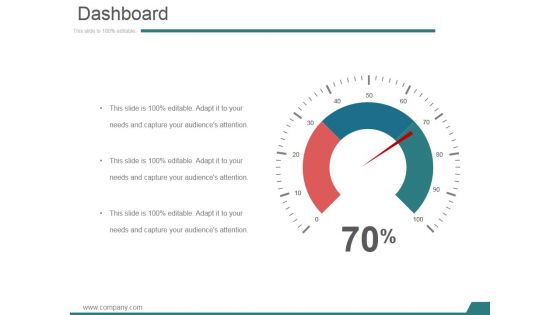
Dashboard Ppt PowerPoint Presentation Infographics Sample
This is a dashboard ppt powerpoint presentation infographics sample. This is a one stage process. The stages in this process are speed, meter, business, marketing, equipment.
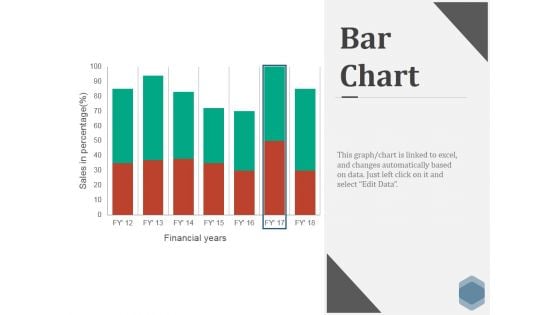
Bar Chart Ppt PowerPoint Presentation Infographics Skills
This is a bar chart ppt powerpoint presentation infographics skills. This is a seven stage process. The stages in this process are business, marketing, strategy, finance, bar.

Customer Focus Ppt PowerPoint Presentation Infographics Samples
This is a customer focus ppt powerpoint presentation infographics samples. This is a one stage process. The stages in this process are customer focus, business, marketing, management, technology.
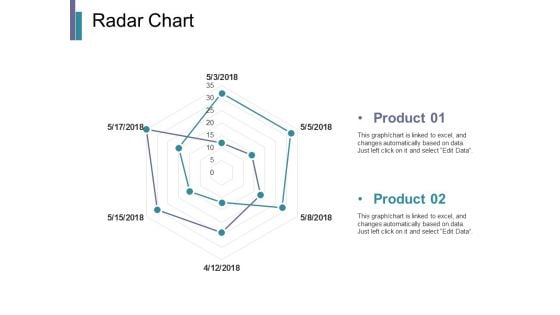
Radar Chart Ppt PowerPoint Presentation Infographics Pictures
This is a radar chart ppt powerpoint presentation infographics pictures. This is a two stage process. The stages in this process are business, marketing, strategy, planning, finance.

Taxation Ppt PowerPoint Presentation Infographics Graphics Example
This is a taxation ppt powerpoint presentation infographics graphics example. This is a one stage process. The stages in this process are finance, marketing, strategy, management, planning.
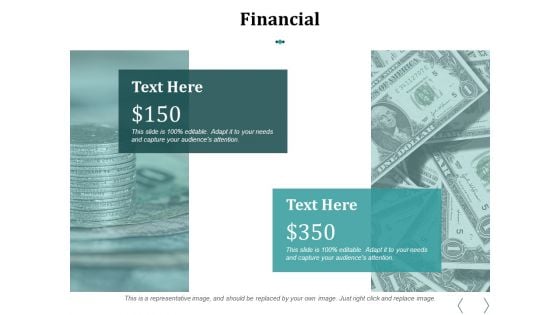
Financial Ppt PowerPoint Presentation Infographics Clipart
This is a financial ppt powerpoint presentation infographics clipart. This is a two stage process. The stages in this process are dollar, business, finance, marketing.
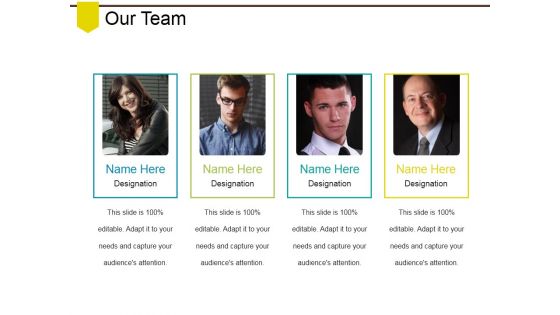
Our Team Ppt PowerPoint Presentation Infographics Files
This is a our team ppt powerpoint presentation infographics files. This is a one stage process. The stages in this process are business, marketing, strategy, planning, analysis.
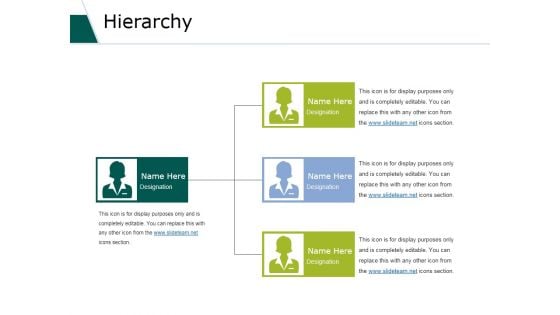
Hierarchy Ppt PowerPoint Presentation Infographics Example
This is a hierarchy ppt powerpoint presentation infographics example. This is a three stage process. The stages in this process are business, marketing, organization, analysis, communication.
Magnifying Glass Ppt PowerPoint Presentation Infographics Templates
This is a magnifying glass ppt powerpoint presentation infographics templates. This is a one stage process. The stages in this process are magnify, technology, marketing, analysis, business.
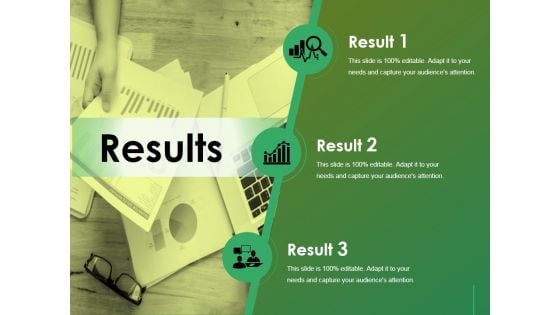
Results Ppt Powerpoint Presentation Infographics File Formats
This is a results ppt powerpoint presentation infographics file formats. This is a three stage process. The stages in this process are analysis, icon, business, marketing, strategy, finance.
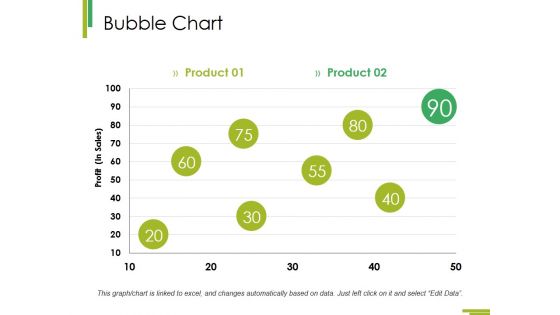
Bubble Chart Ppt PowerPoint Presentation Infographics Objects
This is a bubble chart ppt powerpoint presentation infographics objects. This is a two stage process. The stages in this process are finance, business, analysis, marketing, bubble chart.

Combo Chart Ppt PowerPoint Presentation Infographics Ideas
This is a combo chart ppt powerpoint presentation infographics ideas. This is a four stage process. The stages in this process are bar graph, marketing, strategy, finance, analysis.
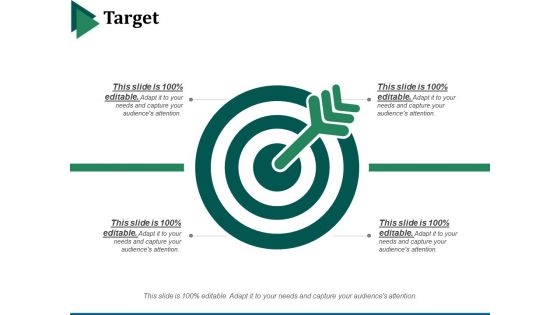
Target Ppt PowerPoint Presentation Infographics Slides
This is a target ppt powerpoint presentation infographics slides. This is a four stage process. The stages in this process are business, marketing, strategy, our goal, analysis.
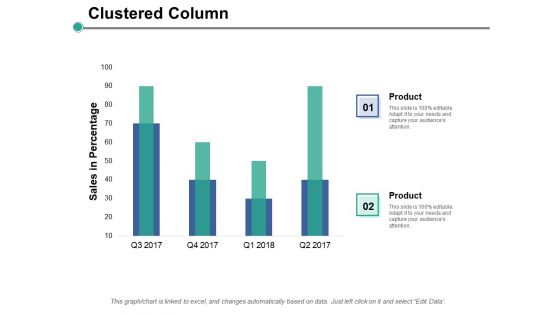
Clustered Column Ppt PowerPoint Presentation Infographics Picture
This is a clustered column ppt powerpoint presentation infographics picture. This is a two stage process. The stages in this process are finance, marketing, management, investment, analysis.
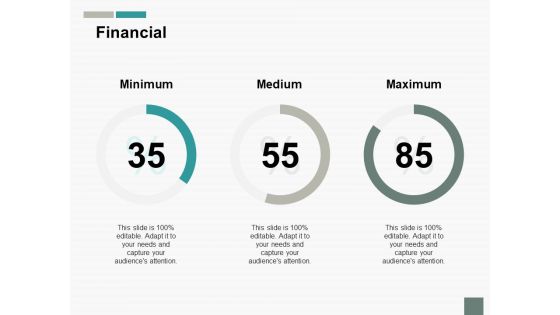
Financial Ppt PowerPoint Presentation Infographics Topics
This is a financial ppt powerpoint presentation infographics topics. This is a three stage process. The stages in this process are finance, marketing, management, investment, analysis.


 Continue with Email

 Home
Home


