Map Infographics
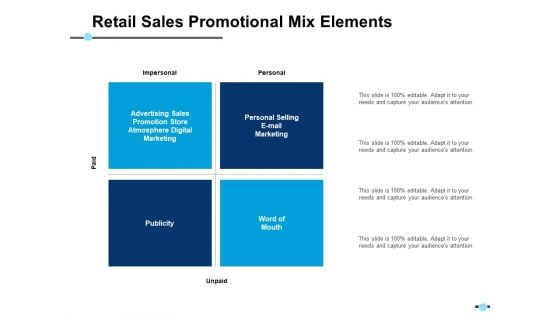
Retail Sales Promotional Mix Elements Personal Selling E Mail Marketing Ppt PowerPoint Presentation Infographics Background Designs
This is a retail sales promotional mix elements personal selling e mail marketing ppt powerpoint presentation infographics background designs. This is a four stage process. The stages in this process are business, management, strategy, analysis, marketing.

Last Year Summary Marketing Channels Ppt PowerPoint Presentation Infographics Background Designs
This is a last year summary marketing channels ppt powerpoint presentation infographics background designs. This is a six stage process. The stages in this process are finance, marketing, management, investment, analysis.

Strategy Chessboard Marketing Converge Or Slice Industry Ppt PowerPoint Presentation Infographics Example File
This is a strategy chessboard marketing converge or slice industry ppt powerpoint presentation infographics example file. This is a four stage process. The stages in this process are communication, business, management, strategy, analysis.
Globe With Wire For Connectivity Vector Icon Ppt PowerPoint Presentation Infographics Template PDF
Presenting this set of slides with name globe with wire for connectivity vector icon ppt powerpoint presentation infographics template pdf. This is a three stage process. The stages in this process are globe with wire for connectivity vector icon. This is a completely editable PowerPoint presentation and is available for immediate download. Download now and impress your audience.

Risk Impact And Probability Analysis Template 1 Ppt PowerPoint Presentation Infographics Templates
This is a risk impact and probability analysis template 1 ppt powerpoint presentation infographics templates. This is a three stage process. The stages in this process are low, medium, high, cost, time, quality.
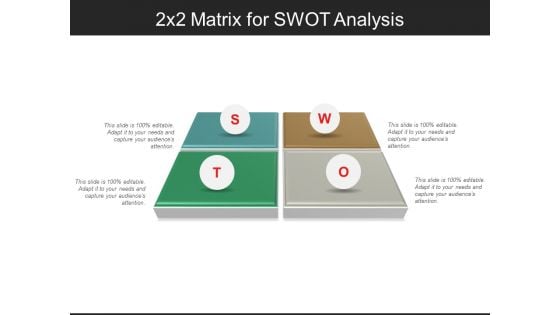
2X2 Matrix For Swot Analysis Ppt PowerPoint Presentation Infographics Background Designs
This is a 2x2 matrix for swot analysis ppt powerpoint presentation infographics background designs. This is a four stage process. The stages in this process are 2x2 matrix, 2x2 table.
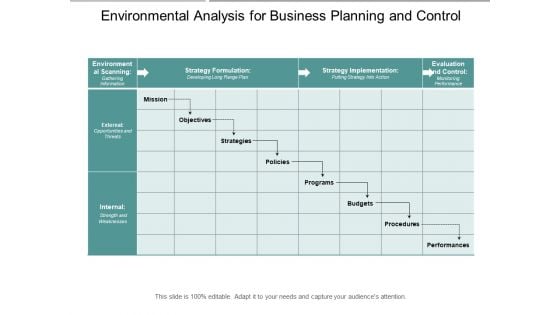
Environmental Analysis For Business Planning And Control Ppt PowerPoint Presentation Infographics Slide Portrait
This is a environmental analysis for business planning and control ppt powerpoint presentation infographics slide portrait. This is a three stage process. The stages in this process are environmental scan, environmental study, environmental examine.
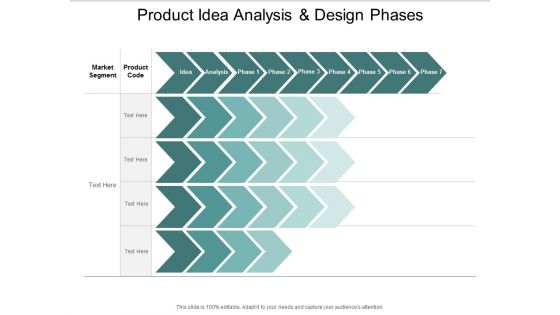
Product Idea Analysis And Design Phases Ppt Powerpoint Presentation Infographics Show
This is a product idea analysis and design phases ppt powerpoint presentation infographics show. This is a seven stage process. The stages in this process are product development pipeline, product development line, product development channel.

Bar Chart With Magnifying Glass For Financial Analysis Ppt Powerpoint Presentation Infographics Designs Download
This is a bar chart with magnifying glass for financial analysis ppt powerpoint presentation infographics designs download. This is a three stage process. The stages in this process are business metrics, business kpi, business dashboard.

Graph Pattern For Network Analysis Ppt PowerPoint Presentation Infographics Graphics Template
This is a graph pattern for network analysis ppt powerpoint presentation infographics graphics template. This is a two stage process. The stages in this process are graph theory, chart theory, business.
Final Destination Icon With Location Pin On Man Ppt PowerPoint Presentation Icon Infographics
Presenting final destination icon with location pin on man ppt powerpoint presentation icon infographics to dispense important information. This template comprises three stages. It also presents valuable insights into the topics including final destination icon with location pin on man. This is a completely customizable PowerPoint theme that can be put to use immediately. So, download it and address the topic impactfully.

Three Pillar Infographics For Scope Of Analysis Ppt PowerPoint Presentation Layouts Layout Ideas PDF
Persuade your audience using this three pillar infographics for scope of analysis ppt powerpoint presentation layouts layout ideas pdf. This PPT design covers three stages, thus making it a great tool to use. It also caters to a variety of topics including three pillar infographics for scope of analysis. Download this PPT design now to present a convincing pitch that not only emphasizes the topic but also showcases your presentation skills.
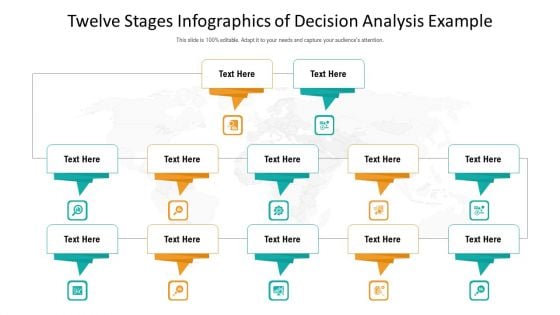
Twelve Stages Infographics Of Decision Analysis Example Ppt PowerPoint Presentation Gallery Good PDF
Persuade your audience using this twelve stages infographics of decision analysis example ppt powerpoint presentation gallery good pdf. This PPT design covers twelve stages, thus making it a great tool to use. It also caters to a variety of topics including twelve stages infographics of decision analysis example. Download this PPT design now to present a convincing pitch that not only emphasizes the topic but also showcases your presentation skills.
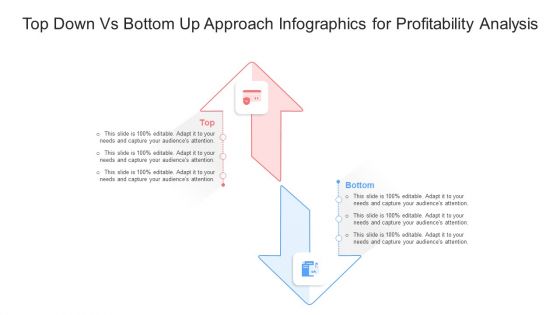
Top Down Vs Bottom Up Approach Infographics For Profitability Analysis Ppt PowerPoint Presentation Slides Guidelines PDF
Persuade your audience using this top down vs bottom up approach infographics for profitability analysis ppt powerpoint presentation slides guidelines pdf. This PPT design covers two stages, thus making it a great tool to use. It also caters to a variety of topics including top down vs bottom up approach infographics for profitability analysis. Download this PPT design now to present a convincing pitch that not only emphasizes the topic but also showcases your presentation skills.
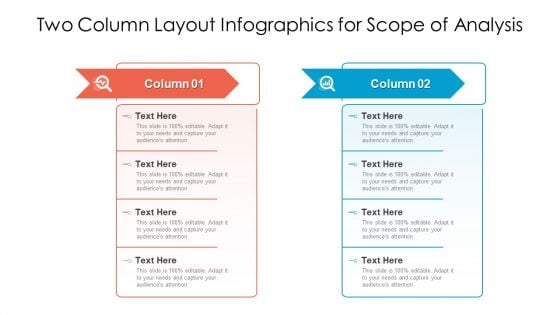
Two Column Layout Infographics For Scope Of Analysis Ppt PowerPoint Presentation Outline Inspiration PDF
Persuade your audience using this two column layout infographics for scope of analysis ppt powerpoint presentation outline inspiration pdf. This PPT design covers two stages, thus making it a great tool to use. It also caters to a variety of topics including two column layout infographics for scope of analysis. Download this PPT design now to present a convincing pitch that not only emphasizes the topic but also showcases your presentation skills.
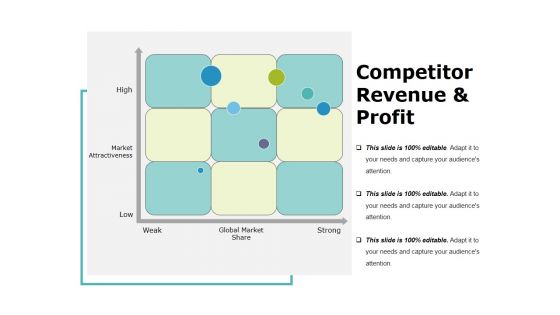
Competitor Revenue And Profit Template 2 Ppt PowerPoint Presentation Infographics Styles
This is a competitor revenue and profit template 2 ppt powerpoint presentation infographics styles. This is a three stage process. The stages in this process are high, market attractiveness, low, weak, global market share, strong.
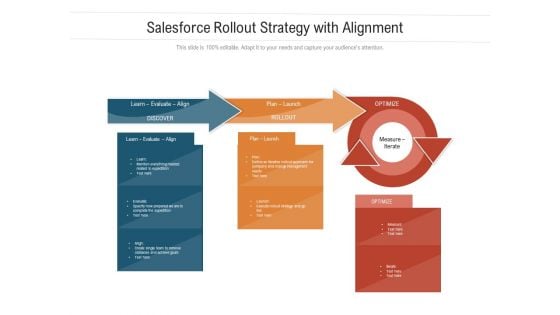
Salesforce Rollout Strategy With Alignment Ppt PowerPoint Presentation Infographics Slideshow PDF
Presenting salesforce rollout strategy with alignment ppt powerpoint presentation infographics slideshow pdf to dispense important information. This template comprises one stages. It also presents valuable insights into the topics including learn evaluate, align, plan, launch, optimize. This is a completely customizable PowerPoint theme that can be put to use immediately. So, download it and address the topic impactfully.

Cash Flow Statement Kpis Tabular Form Ppt PowerPoint Presentation Infographics File Formats
This is a cash flow statement kpis tabular form ppt powerpoint presentation infographics file formats. This is a four stage process. The stages in this process are operations, investing activities, financing activities, net increase in cash.
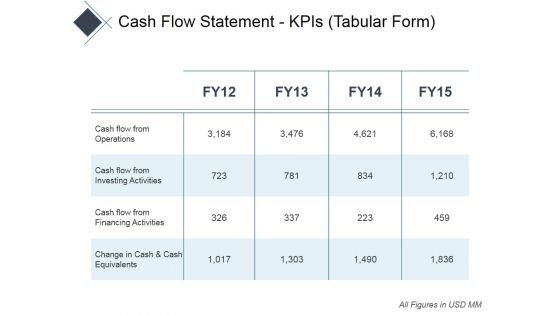
Cash Flow Statement Kpis Tabular Form Ppt PowerPoint Presentation Infographics Professional
This is a cash flow statement kpis tabular form ppt powerpoint presentation infographics professional. This is a four stage process. The stages in this process are operations, financing activities, investing activities, net increase in cash.
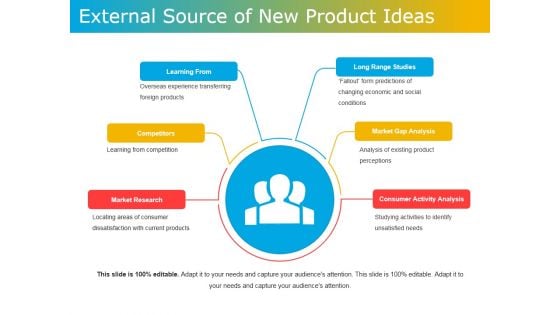
External Source Of New Product Ideas Ppt PowerPoint Presentation Infographics Structure
This is a external source of new product ideas ppt powerpoint presentation infographics structure. This is a six stage process. The stages in this process are learning from, competitors, market research, market gap analysis, long range studies.

Impact Of Milestone Achievement Non Achievement Ppt PowerPoint Presentation Infographics Designs Download
This is a impact of milestone achievement non achievement ppt powerpoint presentation infographics designs download. This is a four stage process. The stages in this process are business, strategy, marketing, analysis, target, leadership.
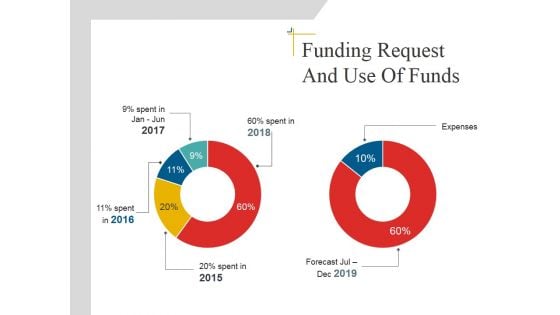
Funding Request And Use Of Funds Template 1 Ppt PowerPoint Presentation Infographics Sample
This is a funding request and use of funds template 1 ppt powerpoint presentation infographics sample. This is a two stage process. The stages in this process are donut, finance, marketing analysis, business.
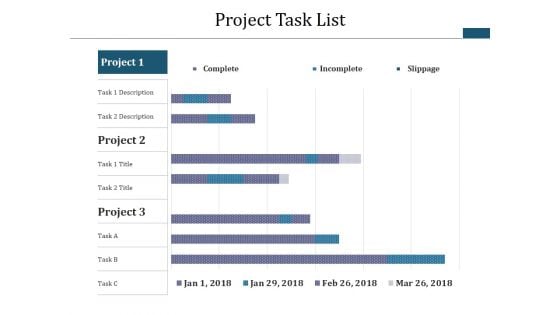
Project Task List Template 2 Ppt PowerPoint Presentation Infographics Example Topics
This is a project task list template 2 ppt powerpoint presentation infographics example topics. This is a three stage process. The stages in this process are business, analysis, strategy, finance, marketing.
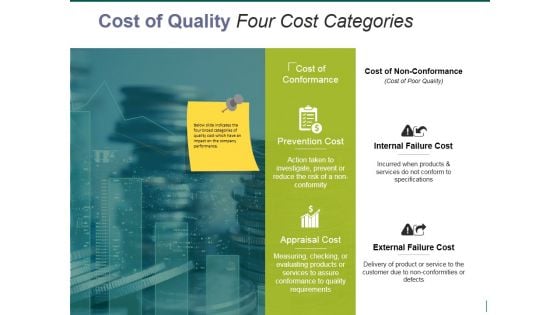
cost of quality four cost categories ppt powerpoint presentation infographics pictures
This is a cost of quality four cost categories ppt powerpoint presentation infographics pictures. This is a three stage process. The stages in this process are business, finance, marketing, strategy, analysis.
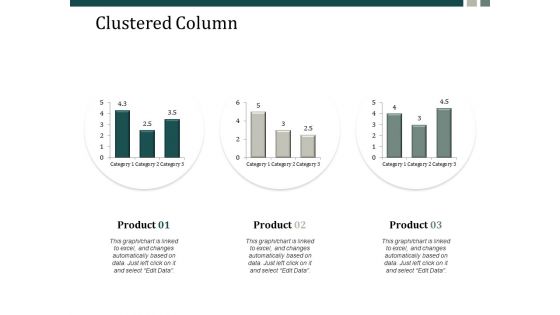
Clustered Column Finance Ppt Powerpoint Presentation Infographics Graphics Pictures Ppt Powerpoint Presentation File Ideas
This is a clustered column finance ppt powerpoint presentation infographics graphics pictures ppt powerpoint presentation file ideas. This is a three stage process. The stages in this process are finance, marketing, management, investment, analysis.
Dashboard Low Medium Ppt Powerpoint Presentation Infographics Icons Ppt Powerpoint Presentation Layouts Format
This is a dashboard low medium ppt powerpoint presentation infographics icons ppt powerpoint presentation layouts format. This is a three stage process. The stages in this process are finance, marketing, management, investment, analysis.
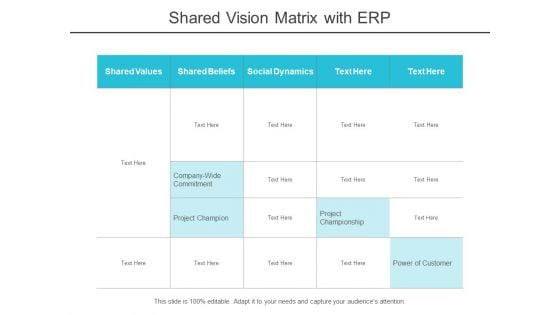
Shared Vision Matrix With Erp Ppt PowerPoint Presentation Infographics Background Images
This is a shared vision matrix with erp ppt powerpoint presentation infographics background images. This is a five stage process. The stages in this process are hared value, shared merit, shared worth.
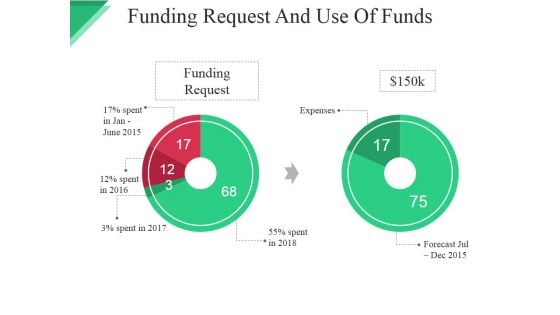
Funding Request And Use Of Funds Template Ppt PowerPoint Presentation Infographics Format
This is a funding request and use of funds template ppt powerpoint presentation infographics format. This is a three stage process. The stages in this process are funding request, exit strategy, marketing, key hires, product development.
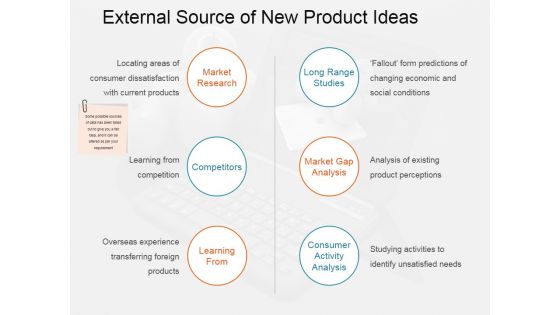
External Source Of New Product Ideas Ppt PowerPoint Presentation Infographics Aids
This is a external source of new product ideas ppt powerpoint presentation infographics aids. This is a six stage process. The stages in this process are market research, long range studies, competitors, market gap analysis, learning from.
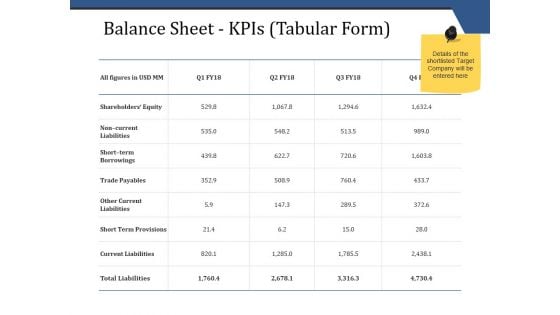
Balance Sheet Kpis Tabular Form Template 1 Ppt PowerPoint Presentation Infographics Picture
This is a balance sheet kpis tabular form template 1 ppt powerpoint presentation infographics picture. This is a four stage process. The stages in this process are business, finance, analysis, investment, strategy.

Projecting The Trend Of Flexible Work Policies Optimizing Staff Retention Rate Infographics Pdf
Do you have an important presentation coming up Are you looking for something that will make your presentation stand out from the rest Look no further than Projecting The Trend Of Flexible Work Policies Optimizing Staff Retention Rate Infographics Pdf With our professional designs, you can trust that your presentation will pop and make delivering it a smooth process. And with Slidegeeks, you can trust that your presentation will be unique and memorable. So why wait Grab Projecting The Trend Of Flexible Work Policies Optimizing Staff Retention Rate Infographics Pdf today and make your presentation stand out from the rest. Our Projecting The Trend Of Flexible Work Policies Optimizing Staff Retention Rate Infographics Pdf are topically designed to provide an attractive backdrop to any subject. Use them to look like a presentation pro.
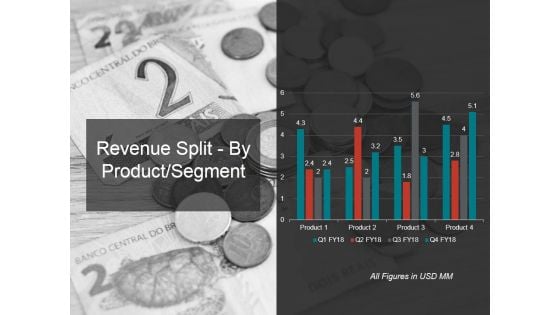
Revenue Split By Product Segment Template 1 Ppt PowerPoint Presentation Infographics Example
This is a revenue split by product segment template 1 ppt powerpoint presentation infographics example. This is a four stage process. The stages in this process are revenue, segment, business, marketing, success.
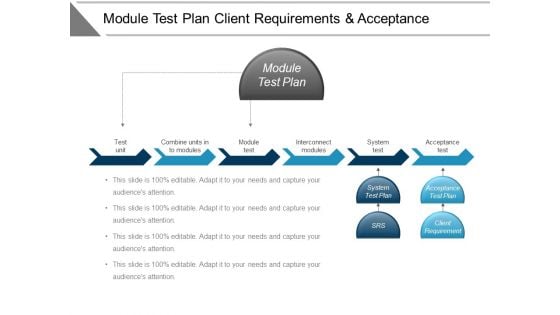
Module Test Plan Client Requirements And Acceptance Ppt PowerPoint Presentation Infographics Structure
This is a module test plan client requirements and acceptance ppt powerpoint presentation infographics structure. This is a three stage process. The stages in this process are quality assurance, quality analysis, qa, testing process, bugs analysis.
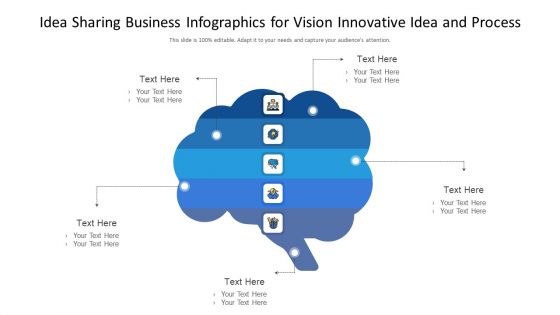
Idea Sharing Business Infographics For Vision Innovative Idea And Process Ppt PowerPoint Presentation Diagram Templates PDF
Presenting idea sharing business infographics for vision innovative idea and process ppt powerpoint presentation diagram templates pdf to dispense important information. This template comprises five stages. It also presents valuable insights into the topics including idea sharing business infographics for vision innovative idea and process. This is a completely customizable PowerPoint theme that can be put to use immediately. So, download it and address the topic impactfully.
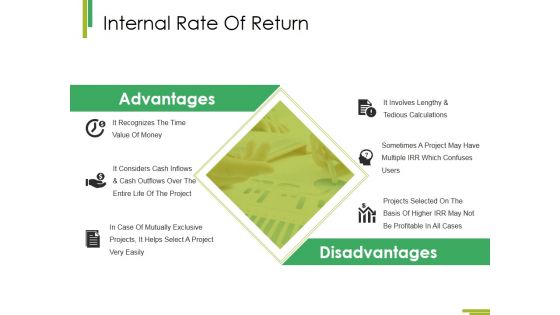
Internal Rate Of Return Template 2 Ppt PowerPoint Presentation Infographics Background
This is a internal rate of return template 2 ppt powerpoint presentation infographics background. This is a two stage process. The stages in this process are advantages, disadvantages, business, marketing, analysis.
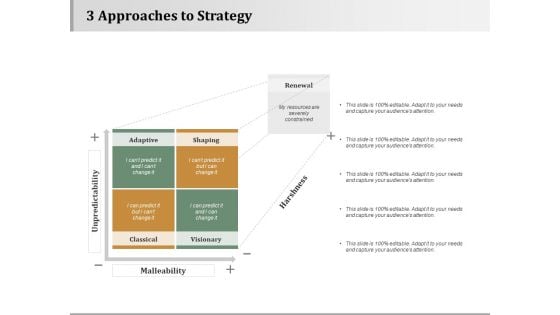
3 Approaches To Strategy Strategy Approaches Ppt PowerPoint Presentation Infographics Examples
This is a 3 approaches to strategy strategy approaches ppt powerpoint presentation infographics examples. This is a four stage process. The stages in this process are business, management, strategy, analysis, marketing.
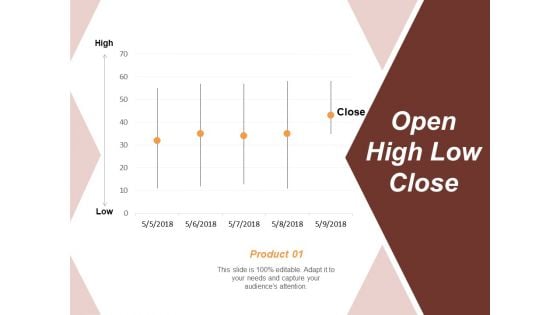
Open High Low Close Risk Estimator Ppt PowerPoint Presentation Infographics Vector
This is a open high low close risk estimator ppt powerpoint presentation infographics vector. This is a five stage process. The stages in this process are business, management, strategy, analysis, marketing.
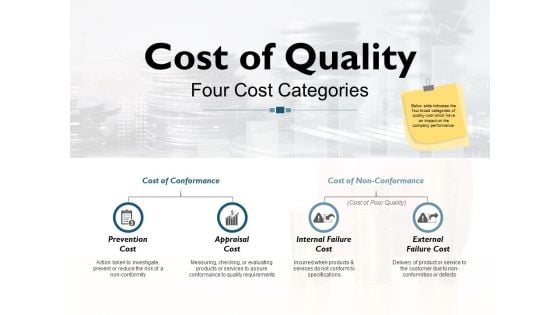
Cost Of Quality Four Cost Categories Ppt PowerPoint Presentation Infographics Design Ideas
This is a cost of quality four cost categories ppt powerpoint presentation infographics design ideas. This is a four stage process. The stages in this process are business, icons, analysis, strategy, marketing.
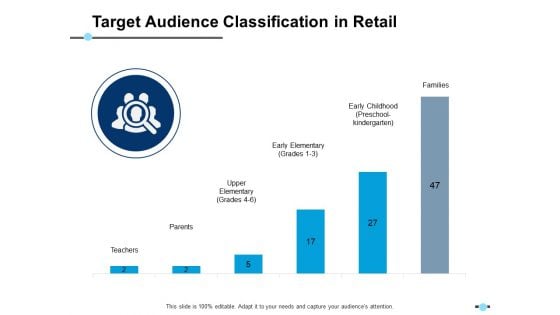
Target Audience Classification In Retail Early Elementary Ppt PowerPoint Presentation Infographics Maker
This is a target audience classification in retail early elementary ppt powerpoint presentation infographics maker. This is a two stage process. The stages in this process are finance, strategy, analysis, marketing.
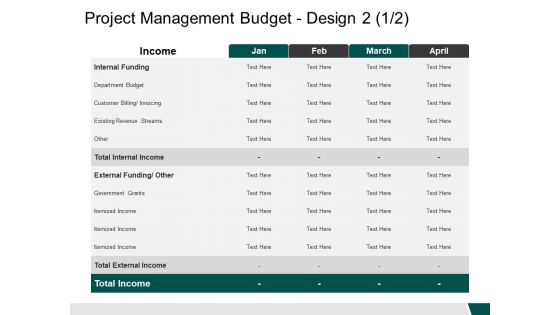
Project Management Budget Design Internal Funding Ppt PowerPoint Presentation Infographics Samples
This is a project management budget design internal funding ppt powerpoint presentation infographics samples. This is a four stage process. The stages in this process are business, management, strategy, analysis, marketing.
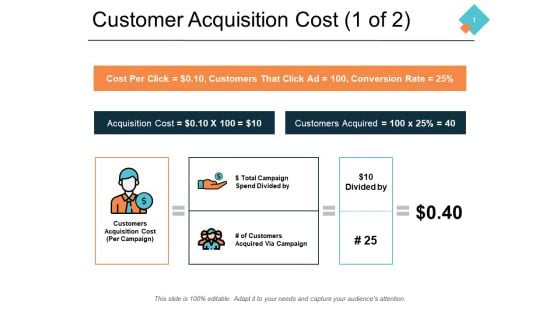
Customer Acquisition Cost 1 Of 2 Ppt PowerPoint Presentation Infographics Outline
This is a customer acquisition cost 1 of 2 ppt powerpoint presentation infographics outline. This is a three stage process. The stages in this process are icons, management, strategy, analysis, marketing.
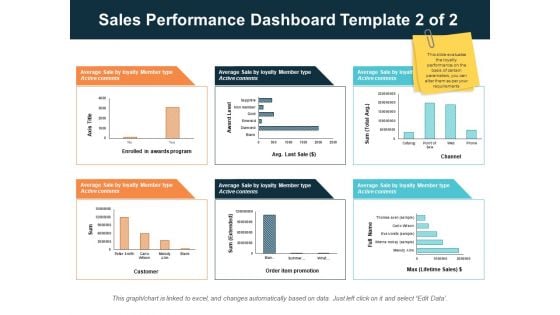
Sales Performance Dashboard Template 2 Of 2 Ppt PowerPoint Presentation Infographics Design Inspiration
This is a sales performance dashboard template 2 of 2 ppt powerpoint presentation infographics design inspiration. This is a three stage process. The stages in this process are finance, management, strategy, analysis, marketing.

Company Id Card With Employee Name And Details Ppt PowerPoint Presentation Infographics Background Designs
This is a company id card with employee name and details ppt powerpoint presentation infographics background designs. This is a one stage process. The stages in this process are identity card, id card, identity document.
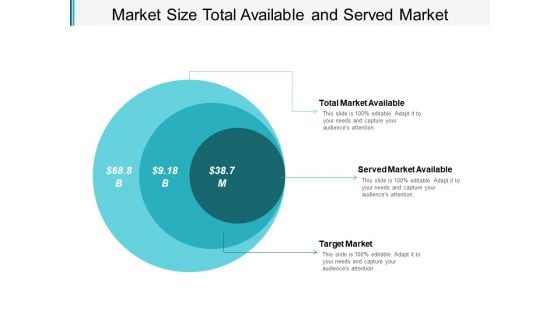
Market Size Total Available And Served Market Ppt PowerPoint Presentation Infographics Demonstration
This is a market size total available and served market ppt powerpoint presentation infographics demonstration. This is a three stage process. The stages in this process are market size, market forecast, market potential.
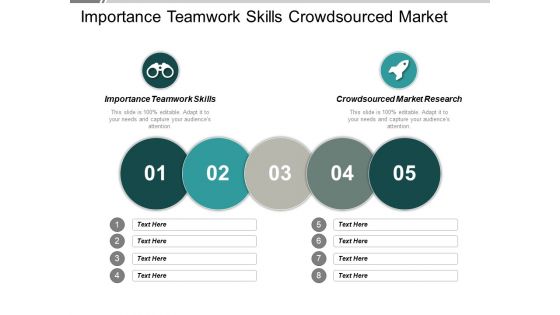
Importance Teamwork Skills Crowdsourced Market Research Event Marketing Ppt PowerPoint Presentation Infographics Graphics Design
This is a importance teamwork skills crowdsourced market research event marketing ppt powerpoint presentation infographics graphics design. This is a five stage process. The stages in this process are importance teamwork skills, crowdsourced market research, event marketing.
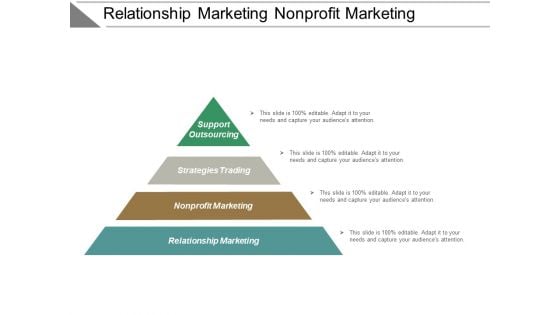
Relationship Marketing Nonprofit Marketing Strategies Trading Support Outsourcing Ppt PowerPoint Presentation Infographics Layouts
This is a relationship marketing nonprofit marketing strategies trading support outsourcing ppt powerpoint presentation infographics layouts. This is a four stage process. The stages in this process are relationship marketing, nonprofit marketing, strategies trading, support outsourcing.
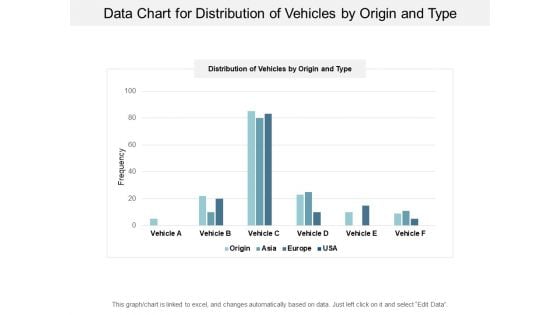
Data Chart For Distribution Of Vehicles By Origin And Type Ppt PowerPoint Presentation Infographics Topics
This is a data chart for distribution of vehicles by origin and type ppt powerpoint presentation infographics topics. This is a four stage process. The stages in this process are financial analysis, quantitative, statistical modelling.
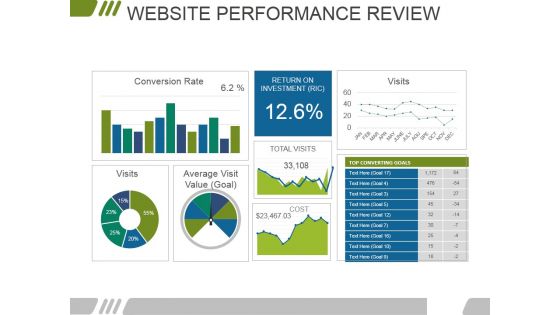
Website Performance Review Template 2 Ppt PowerPoint Presentation Infographics Background Designs
This is a website performance review template 2 ppt powerpoint presentation infographics background designs. This is a three stage process. The stages in this process are conversion rate, visits, return on investment, average visit value.
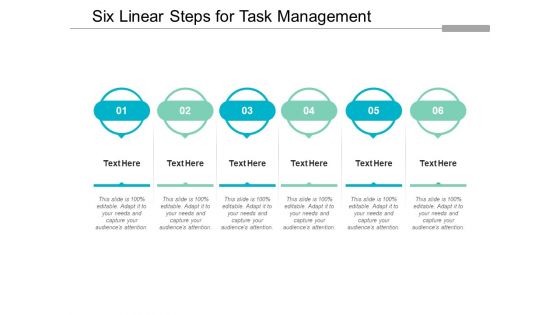
Six Linear Steps For Task Management Ppt PowerPoint Presentation Infographics Portrait
This is a six linear steps for task management ppt powerpoint presentation infographics portrait. This is a six stage process. The stages in this process are business goals, business objectives, business priorities.
Money Bags For Liquidity And Cash Management Ppt PowerPoint Presentation Infographics Graphics
This is a money bags for liquidity and cash management ppt powerpoint presentation infographics graphics. This is a four stage process. The stages in this process are liquidity, cash assets, solvency.

Cash Flow Statement Kpis Template 1 Ppt PowerPoint Presentation Infographics Summary
This is a cash flow statement kpis template 1 ppt powerpoint presentation infographics summary. This is a four stage process. The stages in this process are business, management, table, strategy, analysis.
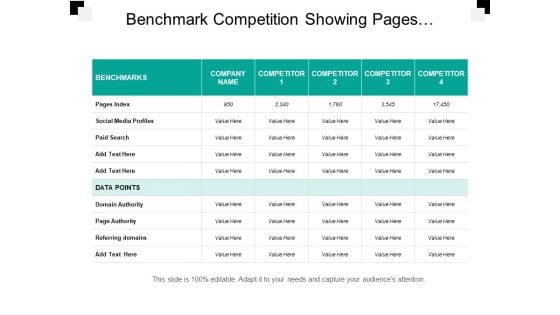
Social Media Benchmarking Page Index Data Points Ppt PowerPoint Presentation Infographics Show
This is a social media benchmarking page index data points ppt powerpoint presentation infographics show. This is a six stage process. The stages in this process are competitive analysis, benchmark competition, competition landscape.
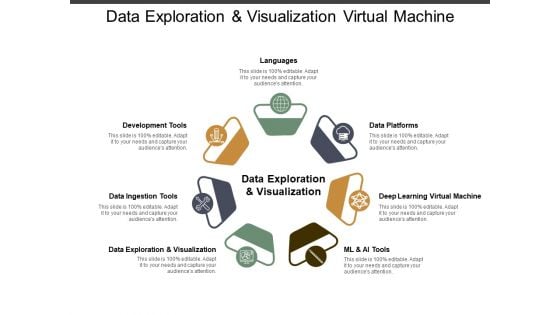
Data Exploration And Visualization Virtual Machine Ppt PowerPoint Presentation Infographics Diagrams
This is a data exploration and visualization virtual machine ppt powerpoint presentation infographics diagrams. This is a seven stage process. The stages in this process are data, analysis, data science, information science.
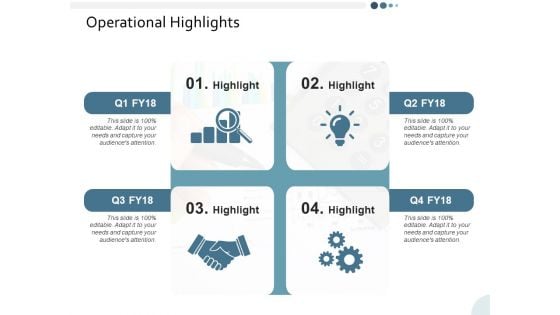
Operational Highlights Yearly Operating Plan Ppt PowerPoint Presentation Infographics Background Designs
This is a operational highlights yearly operating plan ppt powerpoint presentation infographics background designs. This is a four stage process. The stages in this process are business, management, strategy, analysis, icons.
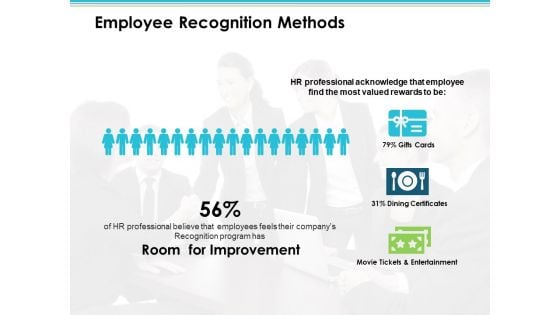
Employee Recognition Methods Employee Value Proposition Ppt PowerPoint Presentation Infographics Example
This is a employee recognition methods employee value proposition ppt powerpoint presentation infographics example. This is a three stage process. The stages in this process are business, management, strategy, analysis, icons.
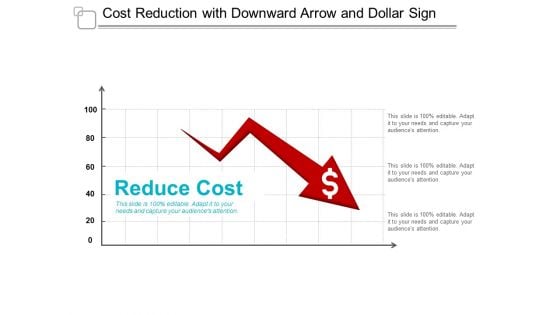
Cost Reduction With Downward Arrow And Dollar Sign Ppt Powerpoint Presentation Infographics Templates
This is a cost reduction with downward arrow and dollar sign ppt powerpoint presentation infographics templates. This is a three stage process. The stages in this process are data analysis, data science, information science.
Three Stages Scp Paradigm With Icons Ppt Powerpoint Presentation Infographics Graphics
This is a three stages scp paradigm with icons ppt powerpoint presentation infographics graphics. This is a three stage process. The stages in this process are performance management, structure conduct performance, performance review and analysis.
Bulb And Idea Icon Technology Ppt PowerPoint Presentation Infographics Background Image
This is a bulb and idea icon technology ppt powerpoint presentation infographics background image. This is a seven stage process. The stages in this process are technology, business, management, strategy, analysis.

Data Interpretation Implementation Review And Evaluation Ppt PowerPoint Presentation Infographics Example
This is a data interpretation implementation review and evaluation ppt powerpoint presentation infographics example. This is a four stage process. The stages in this process are data analysis, data review, data evaluation.
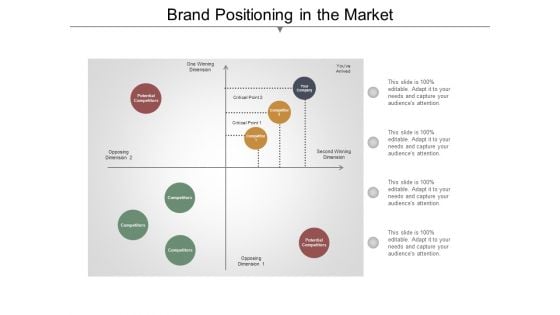
Brand Positioning In The Market Ppt PowerPoint Presentation Infographics Background Image
This is a brand positioning in the market ppt powerpoint presentation infographics background image. This is a four stage process. The stages in this process are marketing plan, market positioning, brand positioning.


 Continue with Email

 Home
Home


