Mapping Of Financial Process
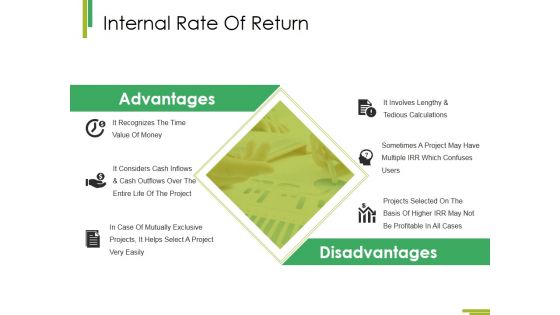
Internal Rate Of Return Template 2 Ppt PowerPoint Presentation Infographics Background
This is a internal rate of return template 2 ppt powerpoint presentation infographics background. This is a two stage process. The stages in this process are advantages, disadvantages, business, marketing, analysis.
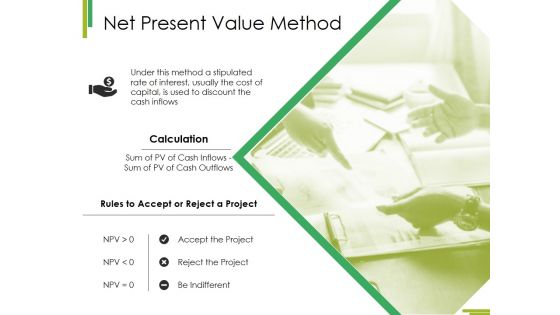
Net Present Value Method Ppt PowerPoint Presentation Layouts Design Inspiration
This is a net present value method ppt powerpoint presentation layouts design inspiration. This is a two stage process. The stages in this process are finance, marketing, analysis, strategy, business.
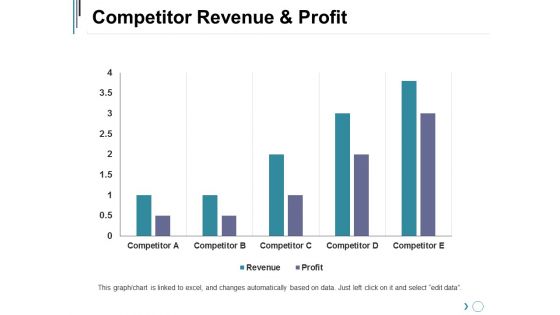
Competitor Revenue And Profit Ppt PowerPoint Presentation Professional Graphics Pictures
This is a competitor revenue and profit ppt powerpoint presentation professional graphics pictures. This is a five stage process. The stages in this process are business, marketing, strategy, graph, finance.
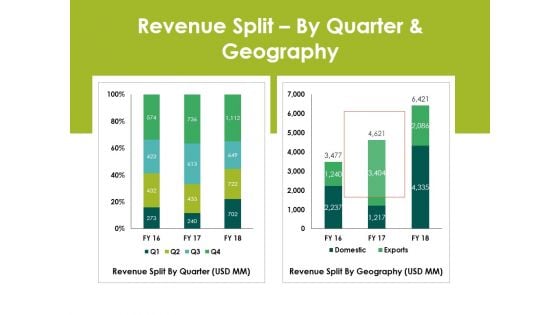
Revenue Splitby Quarter And Geography Ppt PowerPoint Presentation Layout
This is a revenue splitby quarter and geography ppt powerpoint presentation layout. This is a two stage process. The stages in this process are revenue split by quarter, revenue split by geography.
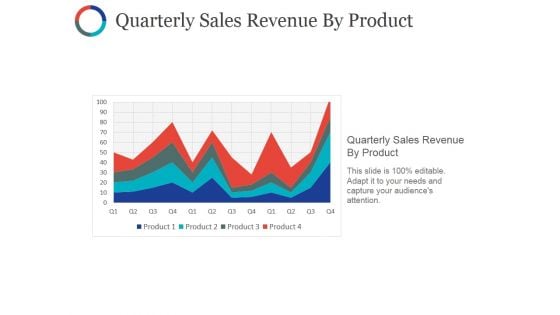
Quarterly Sales Revenue By Product Ppt PowerPoint Presentation Styles Slides
This is a quarterly sales revenue by product ppt powerpoint presentation styles slides. This is a four stage process. The stages in this process are quarterly sales revenue by product, charts, sales, business, success.
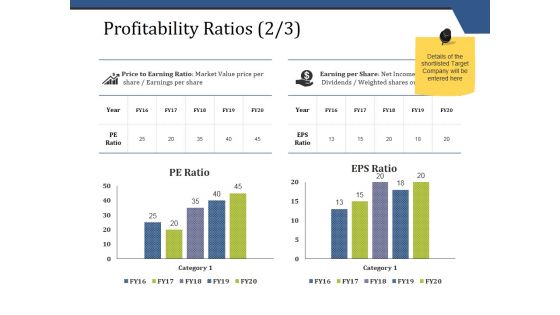
Profitability Ratios Template 2 Ppt PowerPoint Presentation Outline Graphics Pictures
This is a profitability ratios template 2 ppt powerpoint presentation outline graphics pictures. This is a two stage process. The stages in this process are business, finance, marketing, analysis, investment.
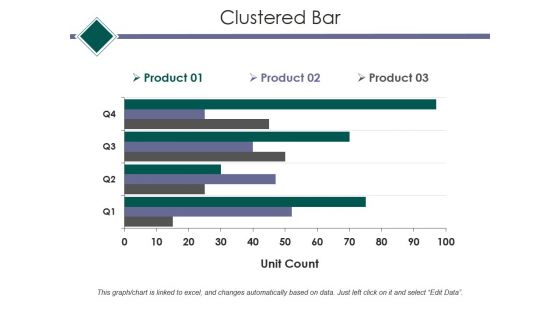
Clustered Bar Ppt PowerPoint Presentation Outline Graphics Design
This is a clustered bar ppt powerpoint presentation outline graphics design. This is a three stage process. The stages in this process are clustered bar, finance, marketing, strategy, analysis, business.
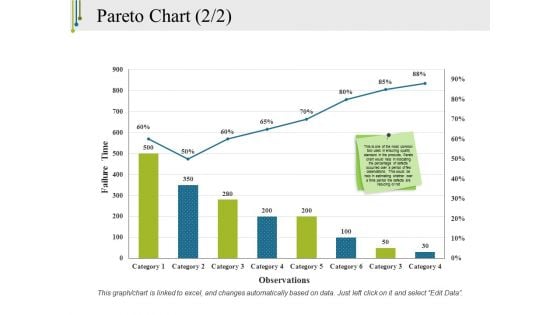
Pareto Chart Template 2 Ppt PowerPoint Presentation Outline Model
This is a pareto chart template 2 ppt powerpoint presentation outline model. This is a eight stage process. The stages in this process are pareto chart, finance, marketing, strategy, analysis.
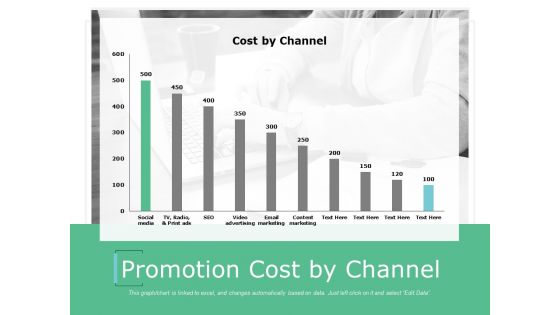
Promotion Cost By Channel Ppt Powerpoint Presentation Outline Smartart
This is a promotion cost by channel ppt powerpoint presentation outline smartart. This is a six stage process. The stages in this process are finance, marketing, analysis, investment, strategy.
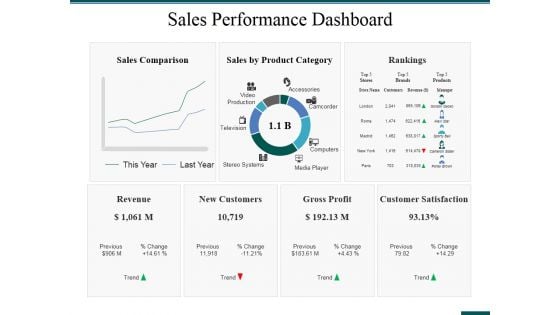
Sales Performance Dashboard Ppt PowerPoint Presentation Ideas Format Ideas
This is a sales performance dashboard ppt powerpoint presentation ideas format ideas. This is a three stage process. The stages in this process are rankings, revenue, new customers, gross profit, customer satisfaction.
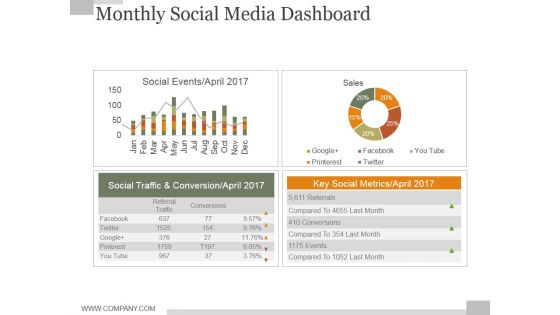
Monthly Social Media Dashboard Ppt PowerPoint Presentation Background Designs
This is a monthly social media dashboard ppt powerpoint presentation background designs. This is a four stage process. The stages in this process are business, finance, marketing, strategy, analysis, success.
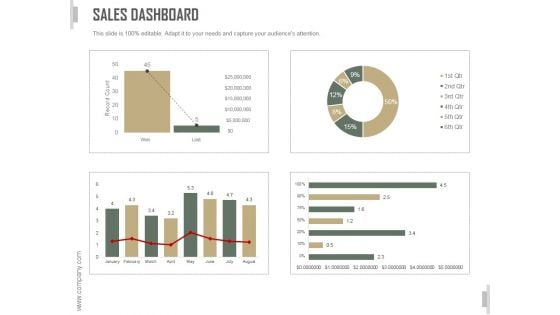
Sales Dashboard Slide Ppt PowerPoint Presentation Template
This is a sales dashboard slide ppt powerpoint presentation template. This is a three stage process. The stages in this process are business, strategy, marketing, analysis, bar graph, growth strategy.
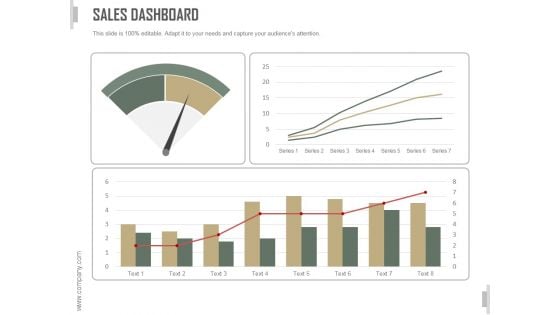
Sales Dashboard Ppt PowerPoint Presentation Design Templates
This is a sales dashboard ppt powerpoint presentation design templates. This is a four stage process. The stages in this process are business, strategy, marketing, analysis, bar graph, growth strategy.
Bar Graph Ppt PowerPoint Presentation Icon Clipart Images
This is a bar graph ppt powerpoint presentation icon clipart images. This is a three stage process. The stages in this process are bar graph, finance, marketing, strategy, analysis.
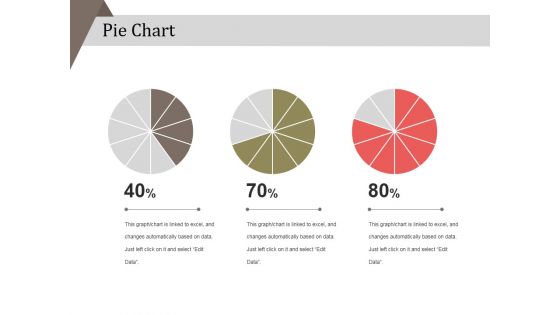
Pie Chart Ppt PowerPoint Presentation Layouts Example
This is a pie chart ppt powerpoint presentation layouts example. This is a three stage process. The stages in this process are business, strategy, analysis, pie chart, finance, marketing.
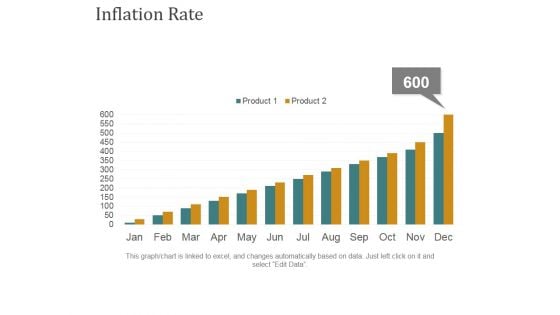
Inflation Rate Template 1 Ppt PowerPoint Presentation Professional Design Inspiration
This is a inflation rate template 1 ppt powerpoint presentation professional design inspiration. This is a twelve stage process. The stages in this process are business, finance, growth, marketing, strategy, analysis.
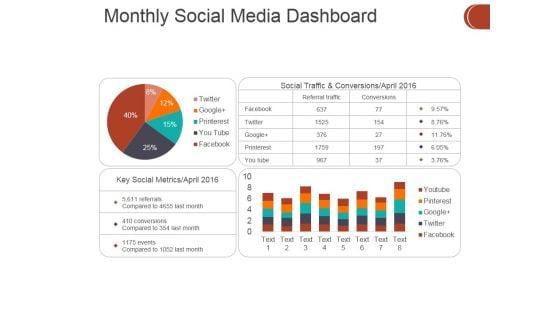
Monthly Social Media Dashboard Ppt PowerPoint Presentation Show Picture
This is a monthly social media dashboard ppt powerpoint presentation show picture. This is a four stage process. The stages in this process are business, finance, marketing, analysis, investment.
Organic Visits And Backlinks Ppt PowerPoint Presentation Model Icon
This is a organic visits and backlinks ppt powerpoint presentation model icon. This is a two stage process. The stages in this process are business, finance, marketing, analysis, investment.
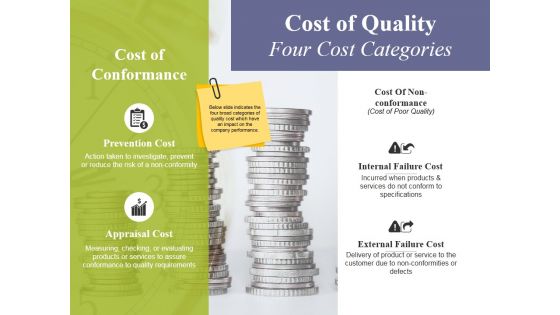
Cost Of Quality Four Cost Categories Ppt PowerPoint Presentation Infographic Template Display
This is a cost of quality four cost categories ppt powerpoint presentation infographic template display. This is a three stage process. The stages in this process are business, finance, coins, investment, analysis, marketing.
Content Marketing Performance Template 1 Ppt PowerPoint Presentation Icon Skills
This is a content marketing performance template 1 ppt powerpoint presentation icon skills. This is a eight stage process. The stages in this process are conversion rate, website traffic, number of leads, sales revenue, quality of leads.
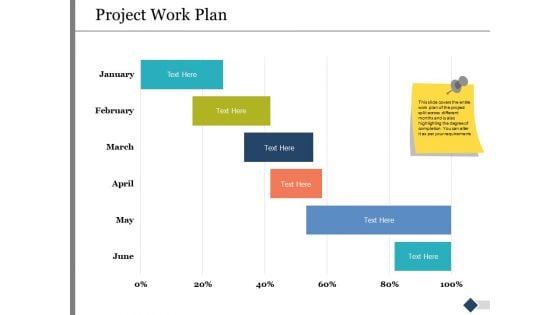
Project Work Plan Ppt PowerPoint Presentation Infographic Template Slides
This is a project work plan ppt powerpoint presentation infographic template slides. This is a six stage process. The stages in this process are finance, marketing, management, investment, analysis.
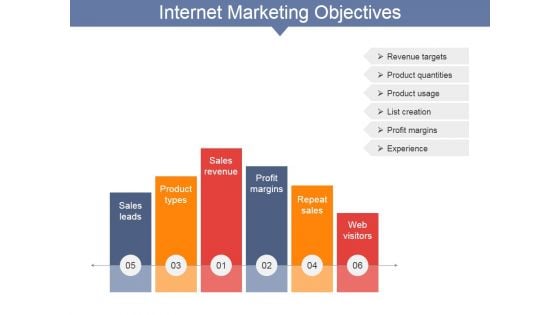
Internet Marketing Objectives Ppt PowerPoint Presentation Layouts Smartart
This is a internet marketing objectives ppt powerpoint presentation layouts smartart. This is a six stage process. The stages in this process are sales leads, product types, sales revenue, profit margins, repeat sales, web visitors.
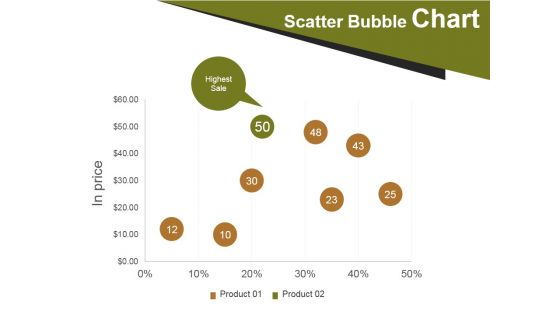
Scatter Bubble Chart Ppt PowerPoint Presentation Show Tips
This is a scatter bubble chart ppt powerpoint presentation show tips. This is a two stage process. The stages in this process are scatter bubble chart, finance, marketing, strategy, business.
Revenue Split By Product Segment Template 1 Ppt PowerPoint Presentation Ideas Icons
This is a revenue split by product segment template 1 ppt powerpoint presentation ideas icons. This is a four stage process. The stages in this process are business, marketing, success, bar graph, product.
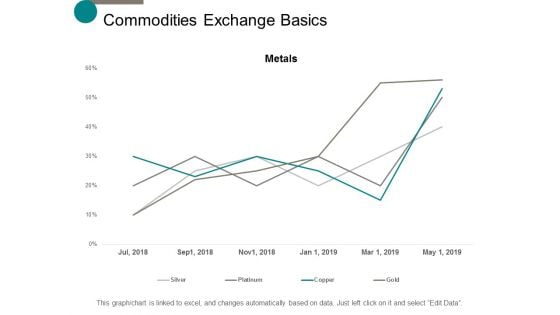
commodities exchange basics management ppt powerpoint presentation layouts deck
This is a commodities exchange basics management ppt powerpoint presentation layouts deck. This is a four stage process. The stages in this process are finance, marketing, management, investment, analysis.
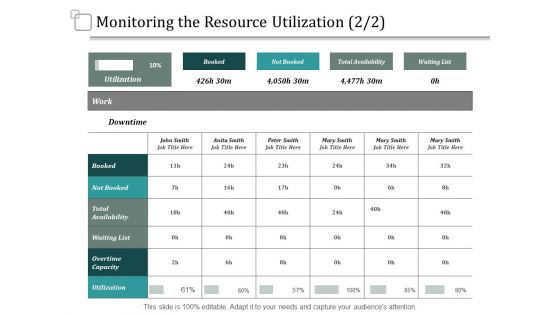
Monitoring The Resource Utilization Management Ppt PowerPoint Presentation Rules
This is a monitoring the resource utilization management ppt powerpoint presentation rules. This is a four stage process. The stages in this process are finance, marketing, management, investment, analysis.
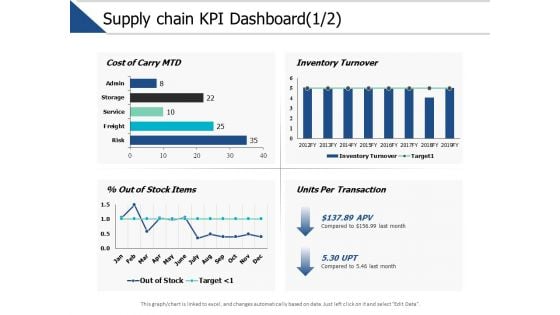
Supply Chain Kpi Dashboard Management Ppt PowerPoint Presentation Model Picture
This is a supply chain kpi dashboard management ppt powerpoint presentation model picture. This is a three stage process. The stages in this process are finance, marketing, management, investment, analysis.
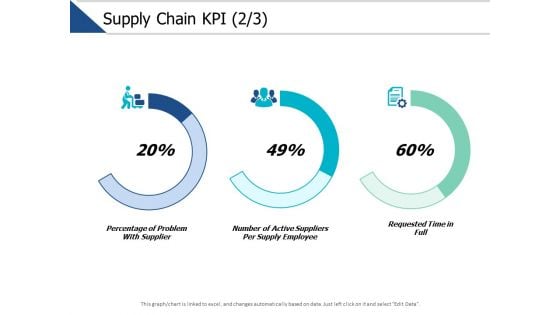
Supply Chain Kpi Management Ppt PowerPoint Presentation Gallery Portrait
This is a supply chain kpi management ppt powerpoint presentation gallery portrait. This is a three stage process. The stages in this process are finance, marketing, management, investment, analysis.
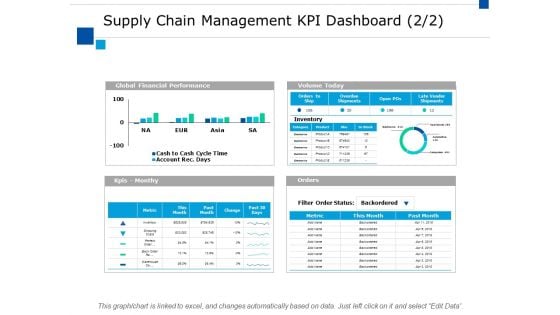
Supply Chain Management Kpi Dashboard Ppt PowerPoint Presentation File Slides
This is a supply chain management kpi dashboard ppt powerpoint presentation file slides. This is a four stage process. The stages in this process are finance, marketing, analysis, investment, million.
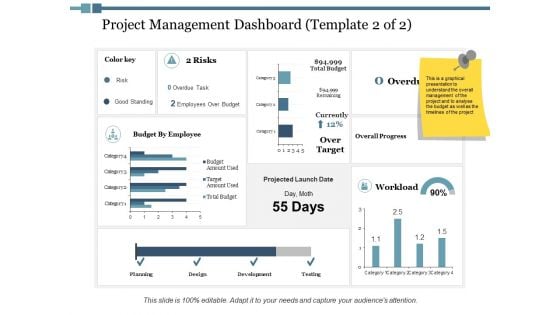
Project Management Dashboard Workload Ppt PowerPoint Presentation Inspiration Show
This is a project management dashboard workload ppt powerpoint presentation inspiration show. This is a four stage process. The stages in this process are finance, marketing, management, investment, analysis.
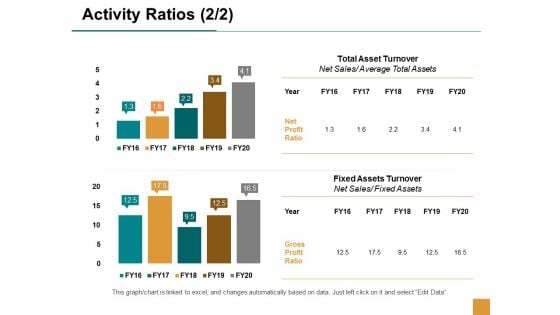
Activity Ratios Management Strategy Ppt Powerpoint Presentation File Structure
This is a activity ratios management strategy ppt powerpoint presentation file structure. This is a two stage process. The stages in this process are finance, marketing, management, investment, analysis.
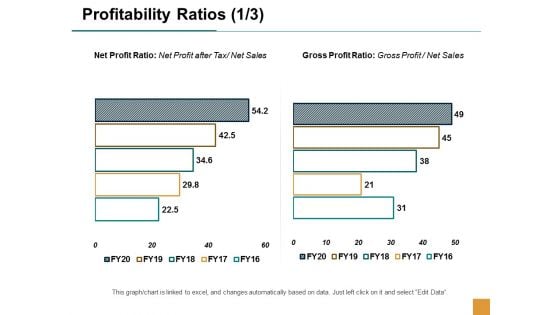
Profitability Ratios Management Business Ppt Powerpoint Presentation Summary Rules
This is a profitability ratios management business ppt powerpoint presentation summary rules. This is a two stage process. The stages in this process are finance, marketing, management, investment, analysis.

Stacked Bar Finance Management Ppt Powerpoint Presentation Infographics Graphics Design
This is a stacked bar finance management ppt powerpoint presentation infographics graphics design. This is a two stage process. The stages in this process are finance, marketing, management, investment, analysis.
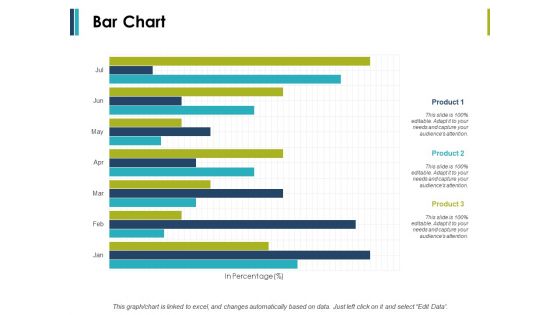
Bar Chart Business Management Ppt PowerPoint Presentation Ideas Example Introduction
This is a bar chart business management ppt powerpoint presentation ideas example introduction. This is a three stage process. The stages in this process are finance, marketing, management, investment, analysis.
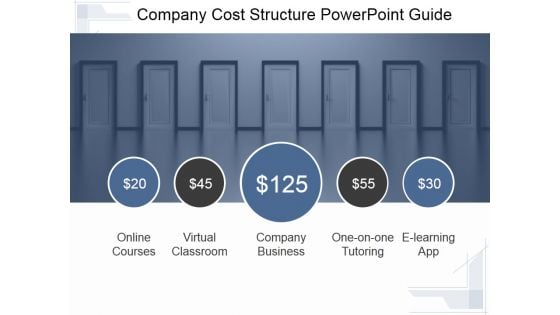
Company Cost Structure Ppt PowerPoint Presentation Influencers
This is a company cost structure ppt powerpoint presentation influencers. This is a five stage process. The stages in this process are online courses, virtual classroom, company business, one on one tutoring, e learning app.
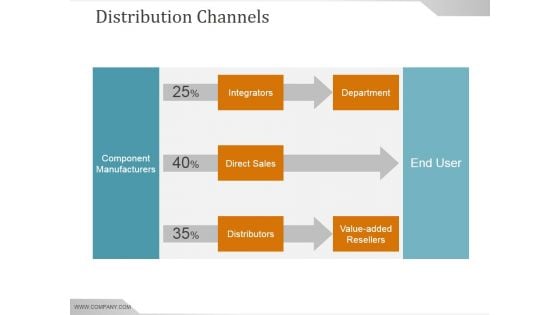
Distribution Channels Ppt PowerPoint Presentation Graphics
This is a distribution channels ppt powerpoint presentation graphics. This is a three stage process. The stages in this process are integrators, direct sales, distributors, value added, resellers, department, component manufacturers, end user.
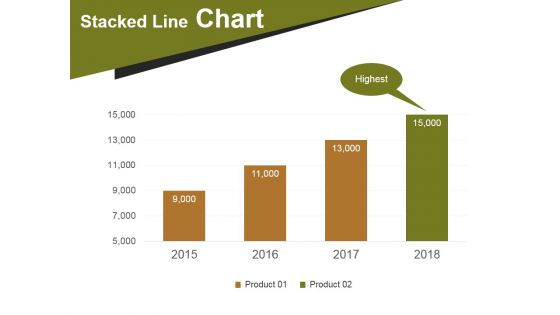
Stacked Line Chart Template 1 Ppt PowerPoint Presentation Infographic Template Layout
This is a stacked line chart template 1 ppt powerpoint presentation infographic template layout. This is a four stage process. The stages in this process are stacked line chart, highest, product.
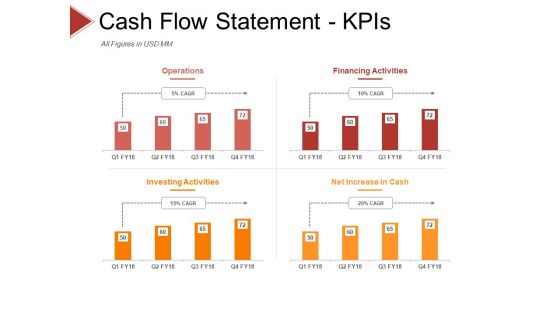
Cash Flow Statement Kpis Template 1 Ppt PowerPoint Presentation Pictures Microsoft
This is a cash flow statement kpis template 1 ppt powerpoint presentation pictures microsoft. This is a four stage process. The stages in this process are operations, financing activities, investing activities, net increase in cash.

Monthly Traffic Source Overview Ppt PowerPoint Presentation File Design Ideas
This is a monthly traffic source overview ppt powerpoint presentation file design ideas. This is a three stage process. The stages in this process are direct traffic, referring sites, search engines.
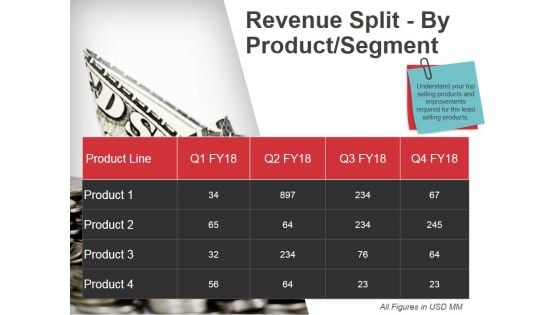
Revenue Split By Product Segment Ppt PowerPoint Presentation Ideas Graphics
This is a revenue split by product segment ppt powerpoint presentation ideas graphics. This is a four stage process. The stages in this process are business, marketing, bar graph, success.
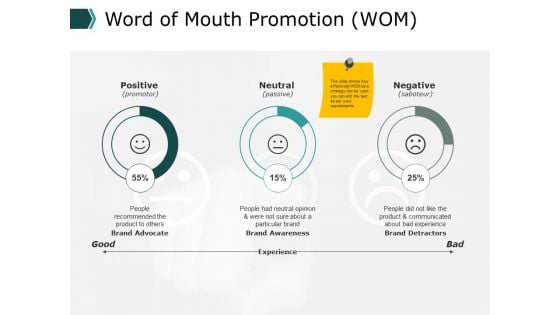
Word Of Mouth Promotion Wom Management Ppt PowerPoint Presentation Pictures Guidelines
This is a word of mouth promotion wom management ppt powerpoint presentation pictures guidelines. This is a three stage process. The stages in this process are finance, marketing, management, investment, analysis.
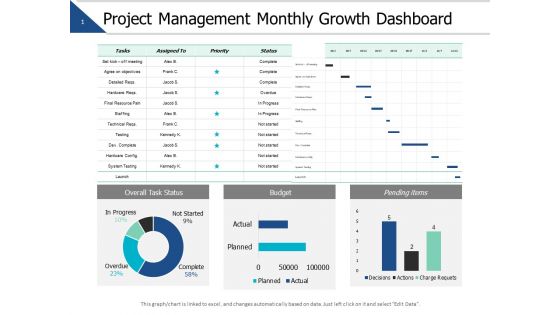
Project Management Monthly Growth Dashboard Ppt PowerPoint Presentation Slides Master Slide
This is a project management monthly growth dashboard ppt powerpoint presentation slides master slide. This is a three stage process. The stages in this process are finance, marketing, management, investment, analysis.
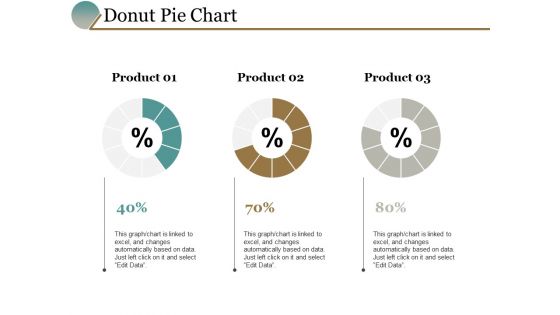
Donut Pie Chart Finance Management Ppt PowerPoint Presentation Portfolio Graphics Design
This is a donut pie chart finance management ppt powerpoint presentation portfolio graphics design. This is a three stage process. The stages in this process are pie chart, finance, marketing, business, analysis.
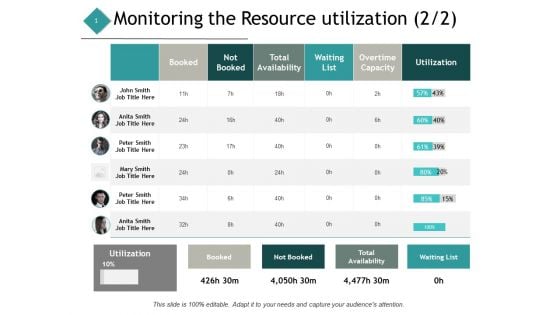
Monitoring The Resource Utilization Management Ppt PowerPoint Presentation Summary Clipart Images
This is a monitoring the resource utilization management ppt powerpoint presentation summary clipart images. This is a four stage process. The stages in this process are finance, marketing, analysis, investment, million.
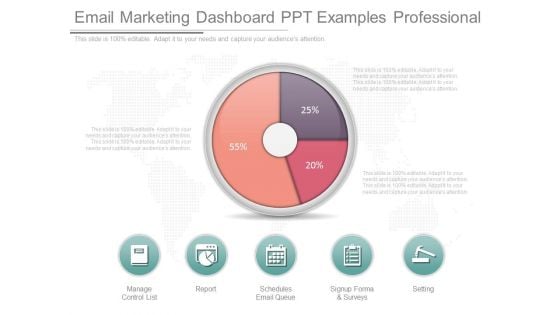
Email Marketing Dashboard Ppt Examples Professional
This is a email marketing dashboard ppt examples professional. This is a three stage process. The stages in this process are manage control list, report, schedules email queue, signup forma and surveys, setting.
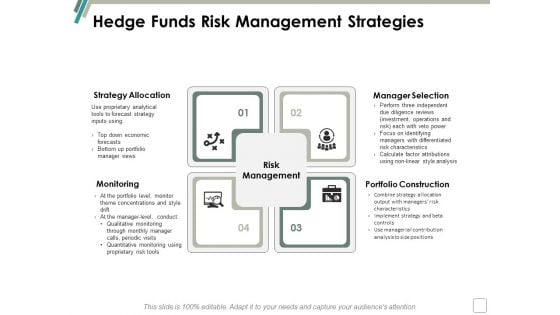
Hedge Funds Risk Management Strategies Ppt Powerpoint Presentation Infographic Template Examples
This is a hedge funds risk management strategies ppt powerpoint presentation infographic template examples. This is a two stage process. The stages in this process are finance, marketing, management, investment, analysis.
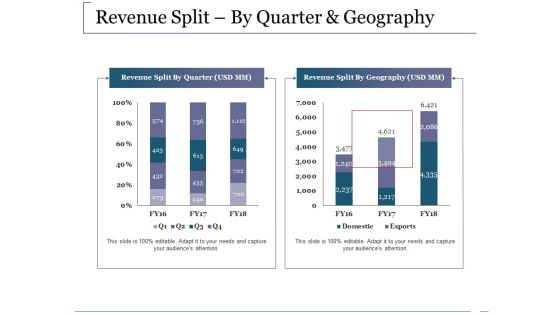
Revenue Split By Quarter And Geography Ppt PowerPoint Presentation Gallery Deck
This is a revenue split by quarter and geography ppt powerpoint presentation gallery deck. This is a two stage process. The stages in this process are business, marketing, graph, revenue split by quarter, revenue split by geography.
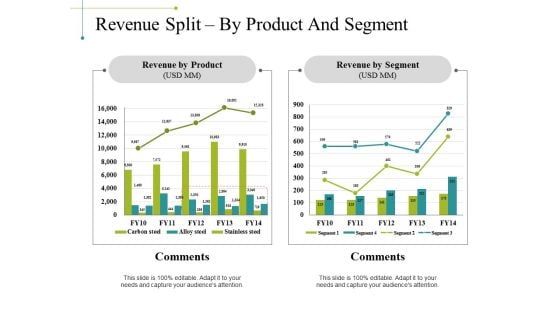
Revenue Split By Product And Segment Ppt PowerPoint Presentation Model Format Ideas
This is a revenue split by product and segment ppt powerpoint presentation model format ideas. This is a two stage process. The stages in this process are business, revenue by product, revenue by segment, comments, marketing.
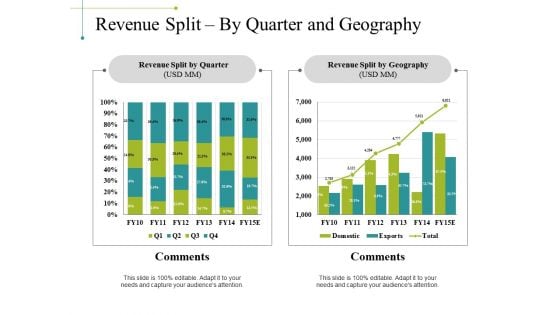
Revenue Split By Quarter And Geography Ppt PowerPoint Presentation Slides Picture
This is a revenue split by quarter and geography ppt powerpoint presentation slides picture. This is a two stage process. The stages in this process are business, marketing, revenue split by quarter, revenue split by geography, comments.
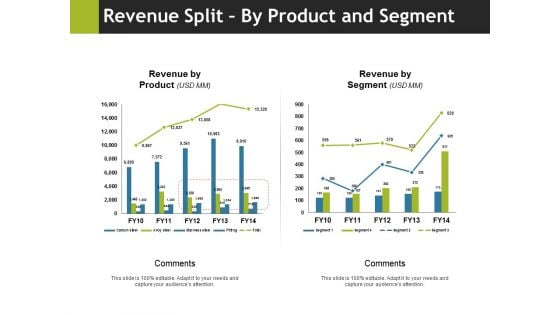
Revenue Split By Product And Segment Ppt PowerPoint Presentation Gallery Example
This is a revenue split by product and segment ppt powerpoint presentation gallery example. This is a two stage process. The stages in this process are comments, revenue by product, revenue by segment, business, marketing.
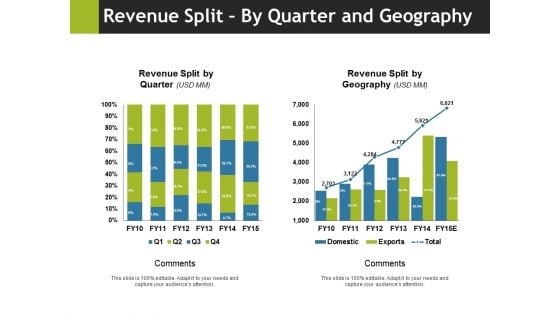
Revenue Split By Quarter And Geography Ppt PowerPoint Presentation Slides Vector
This is a revenue split by quarter and geography ppt powerpoint presentation slides vector. This is a two stage process. The stages in this process are revenue split by quarter, comments, revenue split by geography, business, marketing.
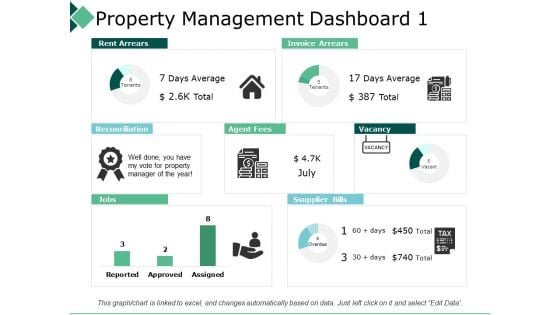
Property Management Dashboard 1 Reconciliation Ppt PowerPoint Presentation Professional Visuals
This is a property management dashboard 1 reconciliation ppt powerpoint presentation professional visuals. This is a three stage process. The stages in this process are business, management, strategy, analysis, icon.
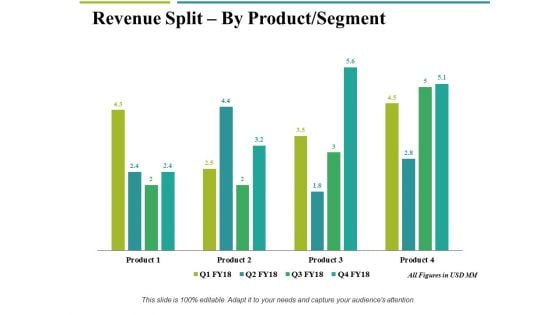
Revenue Split By Product Segment Template 2 Ppt PowerPoint Presentation Gallery Example File
This is a revenue split by product segment template 2 ppt powerpoint presentation gallery example file. This is a four stage process. The stages in this process are business, marketing, graph, finance, revenue split.
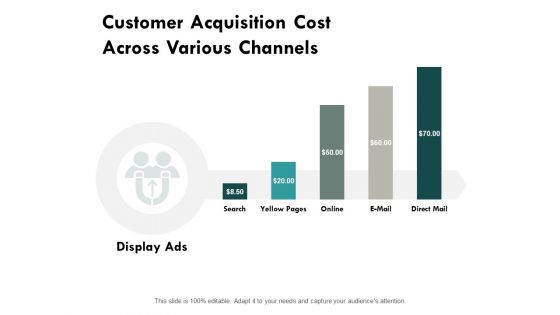
Customer Acquisition Cost Across Various Channels Ppt PowerPoint Presentation Ideas Infographics
This is a customer acquisition tools marketing ppt powerpoint presentation icon microsoft. This is a thee stage process. The stages in this process are finance, marketing, analysis, investment, million.
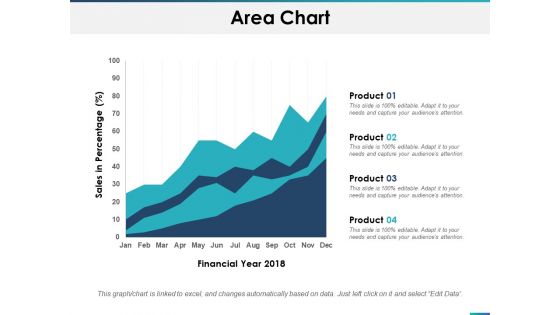
Area Chart Finance Ppt PowerPoint Presentation Outline Brochure
This is a area chart finance ppt powerpoint presentation outline brochure. This is a four stage process. The stages in this process are area chart, finance, marketing, analysis, investment.
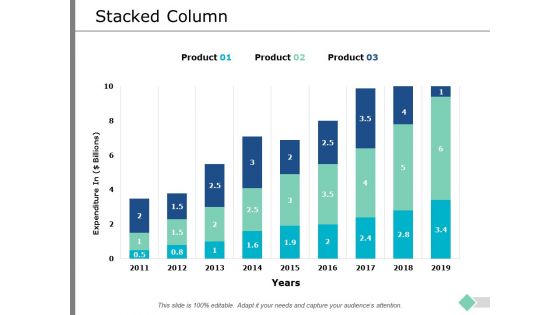
Stacked Column Investment Ppt PowerPoint Presentation Outline Slide
This is a stacked column investment ppt powerpoint presentation outline slide. This is a three stage process. The stages in this process are stacked column, finance, marketing, analysis, business, investment.
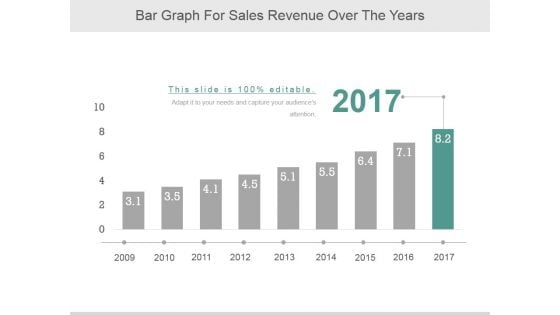
Bar Graph For Sales Revenue Over The Years Ppt PowerPoint Presentation Professional
This is a bar graph for sales revenue over the years ppt powerpoint presentation professional. This is a nine stage process. The stages in this process are business, marketing, growth, bar, years.
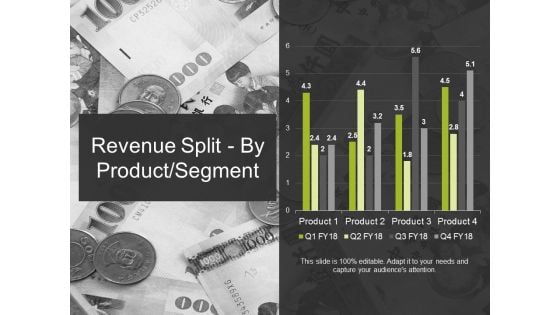
Revenue Split By Product Segment Template 2 Ppt PowerPoint Presentation Ideas Graphic Images
This is a revenue split by product segment template 2 ppt powerpoint presentation ideas graphic images. This is a four stage process. The stages in this process are business, marketing, finance, graph, strategy.
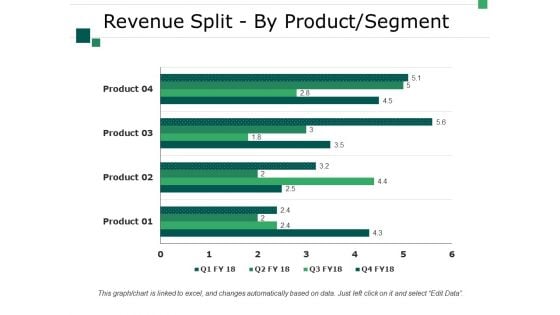
Revenue Split By Product Segment Template 2 Ppt PowerPoint Presentation Summary Good
This is a revenue split by product segment template 2 ppt powerpoint presentation summary good. This is a four stage process. The stages in this process are business, marketing, finance, strategy, graph.
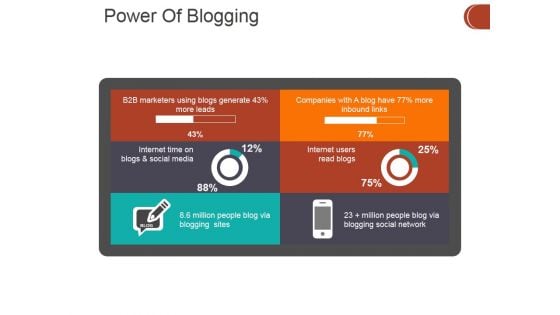
Power Of Blogging Ppt PowerPoint Presentation Ideas Information
This is a power of blogging ppt powerpoint presentation ideas information. This is a six stage process. The stages in this process are business, finance, marketing, analysis, investment, management.


 Continue with Email

 Home
Home


