Mapping Of Financial Process

Business Case Development Tools Presentation Images
This is a business case development tools presentation images. This is a nine stage process. The stages in this process are user guide, business profile, it spending tco, initiative costs, initiative benefits, financial analysis, non financial kpls optional, business case reports, initiative descriptions reference only.
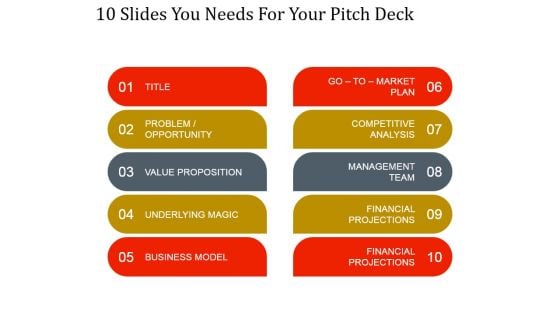
10 Slides You Needs For Your Pitch Deck Ppt PowerPoint Presentation Gallery
This is a 10 slides you needs for your pitch deck ppt powerpoint presentation gallery. This is a ten stage process. The stages in this process are title, problem opportunity, value proposition, underlying magic, business model, go to market plan, competitive analysis, management team, financial projections, financial projections.

Money Management Pile Of Coins Image Ppt PowerPoint Presentation Ideas
Presenting this set of slides with name money management pile of coins image ppt powerpoint presentation ideas. This is a one stage process. The stages in this process are financial strategy, business financial trend, business strategy. This is a completely editable PowerPoint presentation and is available for immediate download. Download now and impress your audience.
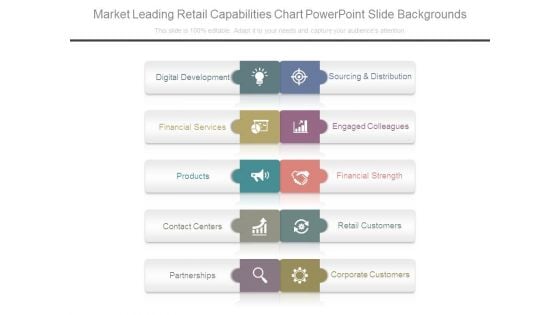
Market Leading Retail Capabilities Chart Powerpoint Slide Backgrounds
This is a market leading retail capabilities chart powerpoint slide backgrounds. This is a five stage process. The stages in this process are digital development, financial services, products, contact centers, partnerships, sourcing and distribution, engaged colleagues, financial strength, retail customers, corporate customers.
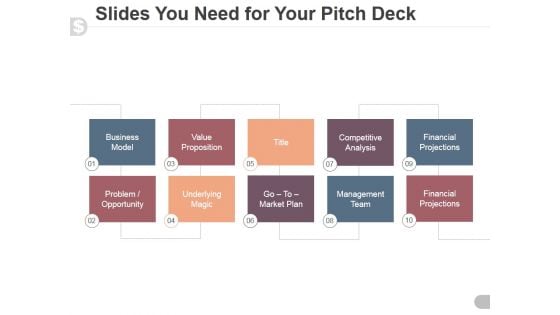
Slides You Need For Your Pitch Deck Ppt PowerPoint Presentation Ideas
This is a slides you need for your pitch deck ppt powerpoint presentation ideas. This is a ten stage process. The stages in this process are business model, value proposition, title, competitive analysis, financial projections, problem opportunity, underlying magic, go to market plan, management team, financial projections.

Methods Of Raising Equity Capital Ppt PowerPoint Presentation Infographics Images
Presenting this set of slides with name methods of raising equity capital ppt powerpoint presentation infographics images. This is a seven stage process. The stages in this process are financial strategy, business financial trend, business strategy. This is a completely editable PowerPoint presentation and is available for immediate download. Download now and impress your audience.
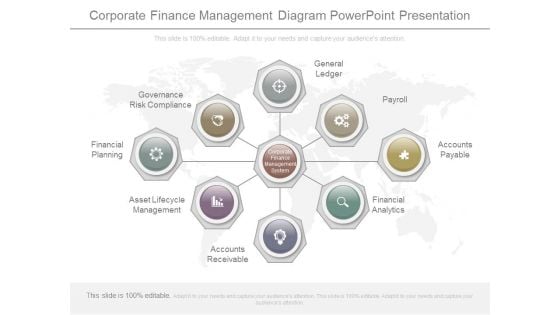
Corporate Finance Management Diagram Powerpoint Presentation
This is a corporate finance management diagram powerpoint presentation. This is a eight stage process. The stages in this process are corporate finance management system, general ledger, payroll, accounts payable, financial analytics, accounts receivable, asset lifecycle management, financial planning, governance risk compliance.
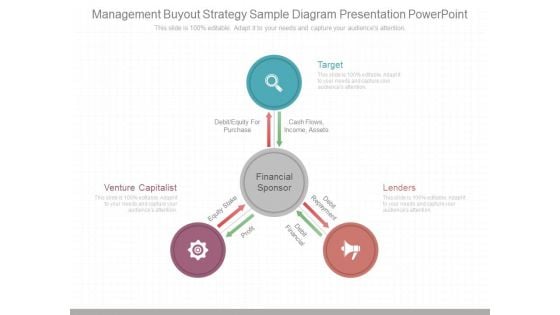
Management Buyout Strategy Sample Diagram Presentation Powerpoint
This is a management buyout strategy sample diagram presentation powerpoint. This is a three stage process. The stages in this process are target, venture capitalist, lenders, debit equity for purchase, cash flows, income, assets, equity stake, profit, debit repayment, debit financial, financial sponsor.\n\n\n\n\n\n\n\n
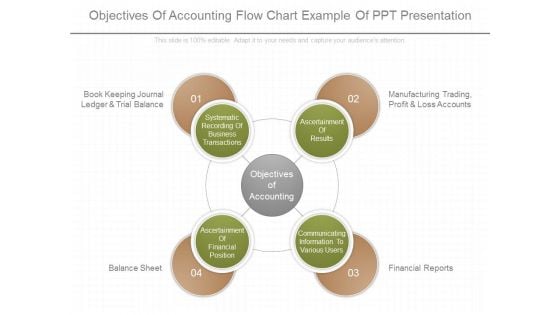
Objectives Of Accounting Flow Chart Example Of Ppt Presentation
This is a objectives of accounting flow chart example of ppt presentation. This is a four stage process. The stages in this process are book keeping journal ledger and trial balance, manufacturing trading profit and loss accounts, balance sheet, financial reports, systematic recording of business transactions, ascertainment of results, ascertainment of financial position, communicating information to various users, objectives of accounting.
Finance Growth Plan Vector Icon Ppt PowerPoint Presentation Model Layouts
Presenting this set of slides with name finance growth plan vector icon ppt powerpoint presentation model layouts. This is a one stage process. The stages in this process are financial strategy, business financial trend, business strategy. This is a completely editable PowerPoint presentation and is available for immediate download. Download now and impress your audience.

Picture Of Chess Game For Strategic Planning Ppt PowerPoint Presentation Summary Deck
Presenting this set of slides with name picture of chess game for strategic planning ppt powerpoint presentation summary deck. This is a seven stage process. The stages in this process are financial strategy, business financial trend, business strategy. This is a completely editable PowerPoint presentation and is available for immediate download. Download now and impress your audience.
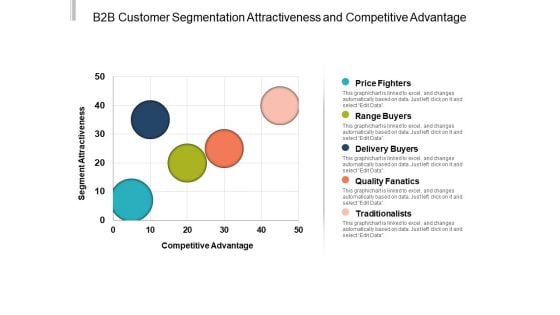
B2b Customer Segmentation Attractiveness And Competitive Advantage Ppt PowerPoint Presentation Background Designs
This is a b2b customer segmentation attractiveness and competitive advantage ppt powerpoint presentation background designs. This is a five stage process. The stages in this process are market segmentation, market mapping, segmenting targeting positioning.
Wealth Management Icon Ppt PowerPoint Presentation Styles Examples
This is a wealth management icon ppt powerpoint presentation styles examples. This is a four stage process. The stages in this process are financial capital, working capital management, companys managerial accounting.
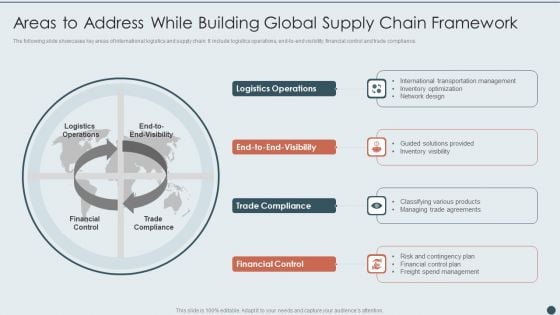
Areas To Address While Building Global Supply Chain Framework Graphics PDF
The following slide showcases key areas of international logistics and supply chain. It include logistics operations, end-to-end visibility, financial control and trade compliance. Presenting Areas To Address While Building Global Supply Chain Framework Graphics PDF to dispense important information. This template comprises four stages. It also presents valuable insights into the topics including Logistics Operations, End To End Visibility, Trade Compliance, Financial Control. This is a completely customizable PowerPoint theme that can be put to use immediately. So, download it and address the topic impactfully.
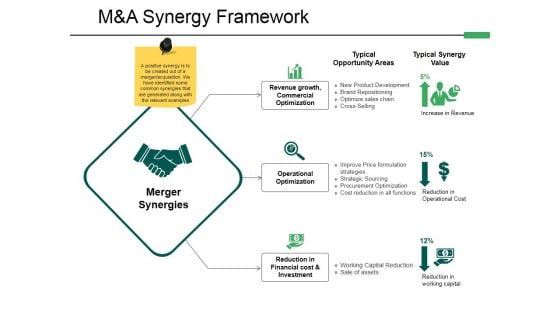
M And A Synergy Framework Ppt PowerPoint Presentation Professional Graphics
This is a m and a synergy framework ppt powerpoint presentation professional graphics. This is a three stage process. The stages in this process are revenue growth, commercial optimization, operational optimization, reduction in financial cost investment.
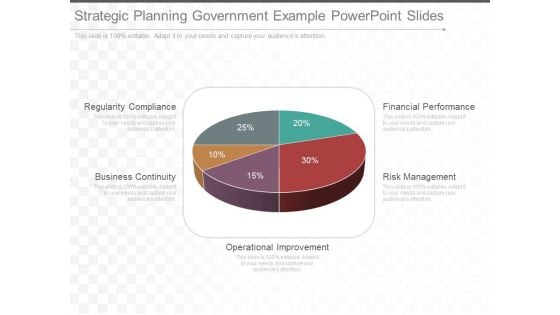
Strategic Planning Government Example Powerpoint Slides
This is a strategic planning government example powerpoint slides. This is a five stage process. The stages in this process are regularity compliance, business continuity, financial performance, risk management, operational improvement.
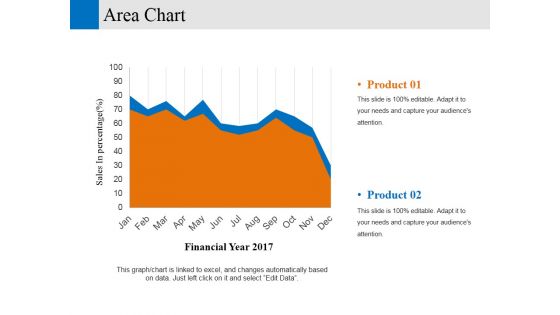
area chart ppt powerpoint presentation professional elements
This is a area chart ppt powerpoint presentation professional elements. This is a two stage process. The stages in this process are financial year sales in percentage, business, marketing, graph.
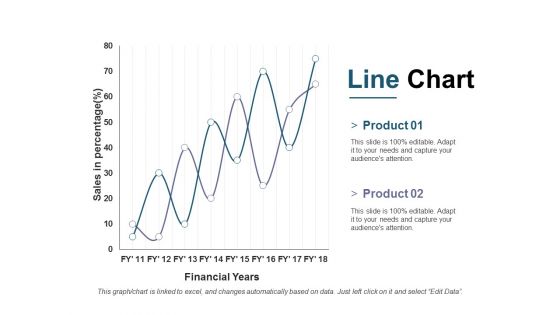
Line Chart Ppt PowerPoint Presentation Outline Ideas
This is a line chart ppt powerpoint presentation outline ideas. This is a two stage process. The stages in this process are business, marketing, financial years, sales in percentage, strategy.
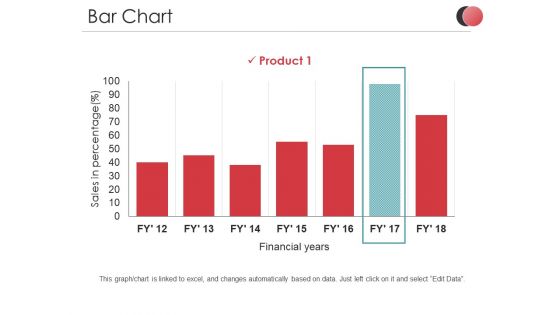
Bar Chart Ppt PowerPoint Presentation Outline Introduction
This is a bar chart ppt powerpoint presentation outline introduction. This is a one stage process. The stages in this process are sales in percentage, product, business, financial years, graph.
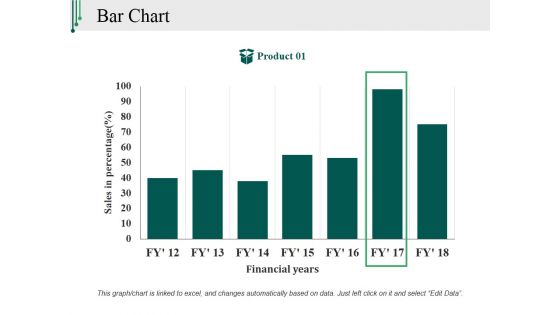
Bar Chart Ppt PowerPoint Presentation Outline Backgrounds
This is a bar chart ppt powerpoint presentation outline backgrounds. This is a one stage process. The stages in this process are sales in percentage, financial years, product, bar graph, finance.
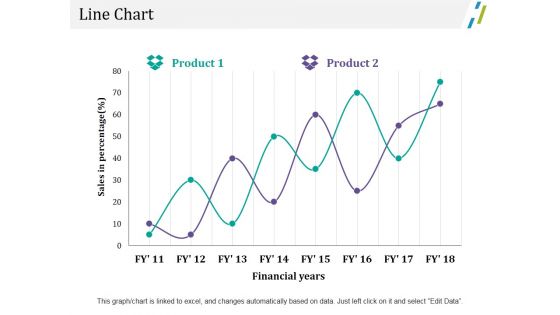
Line Chart Ppt PowerPoint Presentation Outline File Formats
This is a line chart ppt powerpoint presentation outline file formats. This is a two stage process. The stages in this process are business, marketing, sales in percentage, financial years, chart.
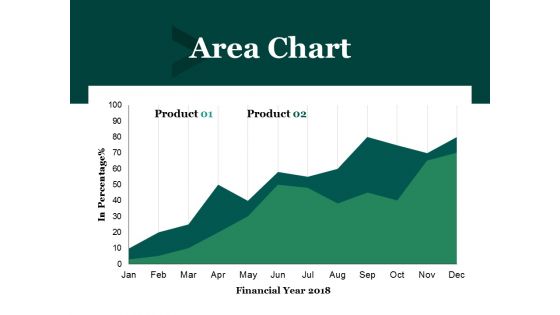
Area Chart Ppt PowerPoint Presentation Outline Graphics Pictures
This is a area chart ppt powerpoint presentation outline graphics pictures. This is a two stage process. The stages in this process are financial year, in percentage, business, marketing, finance.
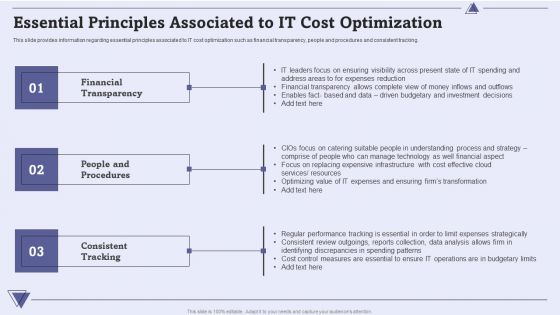
CIO For IT Cost Optimization Techniques Essential Principles Associated To IT Cost Optimization Demonstration PDF
This slide provides information regarding essential principles associated to IT cost optimization such as financial transparency, people and procedures and consistent tracking. Presenting CIO For IT Cost Optimization Techniques Essential Principles Associated To IT Cost Optimization Demonstration PDF to provide visual cues and insights. Share and navigate important information on three stages that need your due attention. This template can be used to pitch topics like Financial Transparency, Cost Control Measures, Resources. In addtion, this PPT design contains high resolution images, graphics, etc, that are easily editable and available for immediate download.
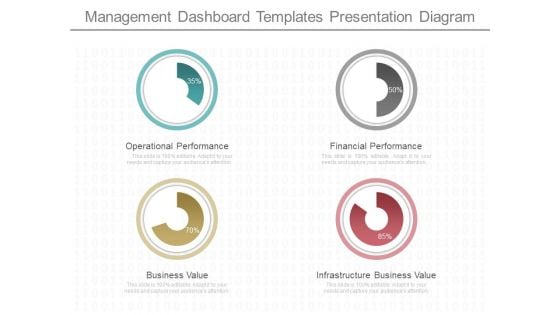
Management Dashboard Templates Presentation Diagram
This is a management dashboard templates presentation diagram. This is a four stage process. The stages in this process are operational performance, business value, financial performance, infrastructure business value.
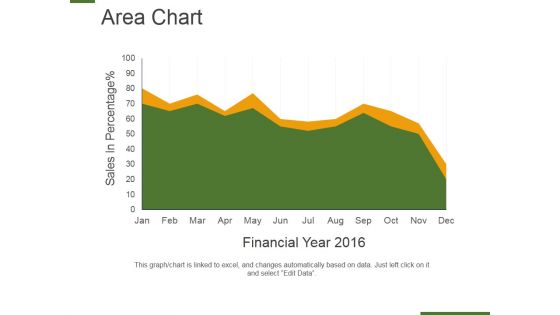
Area Chart Ppt PowerPoint Presentation Layouts Graphics Example
This is a area chart ppt powerpoint presentation layouts graphics example. This is a two stage process. The stages in this process are sales in percentage, financial year, business, marketing, presentation.
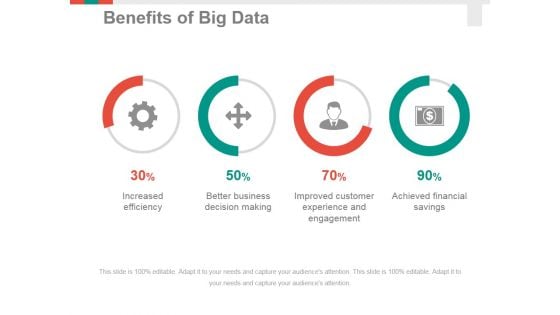
Benefits Of Big Data Ppt PowerPoint Presentation Professional Slide Portrait
This is a benefits of big data ppt powerpoint presentation professional slide portrait. This is a four stage process. The stages in this process are increased efficiency, better business decision making, improved customer experience and engagement, achieved financial savings.
Cios Value Optimization Essential Principles Associated To IT Cost Optimization Icons PDF
This slide provides information regarding essential principles associated to IT cost optimization such as financial transparency, people and procedures and consistent tracking. This is a Cios Value Optimization Essential Principles Associated To IT Cost Optimization Icons PDF template with various stages. Focus and dispense information on three stages using this creative set, that comes with editable features. It contains large content boxes to add your information on topics like Financial Transparency, People Procedures, Consistent Tracking. You can also showcase facts, figures, and other relevant content using this PPT layout. Grab it now.
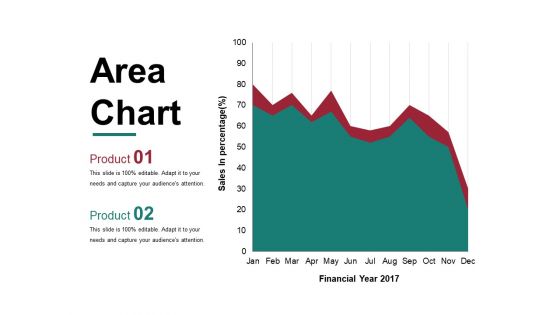
Area Chart Ppt PowerPoint Presentation Layouts Maker
This is a area chart ppt powerpoint presentation layouts maker. This is a two stage process. The stages in this process are financial year, sales in percentage, graph, business, marketing.
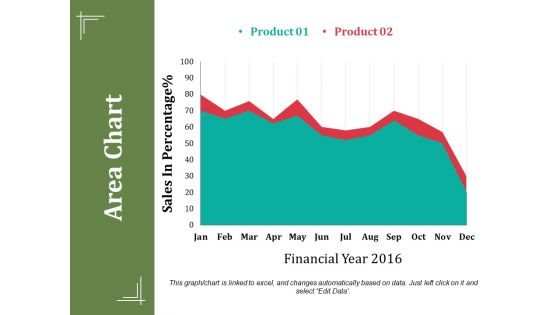
Area Chart Ppt PowerPoint Presentation Summary Show
This is a area chart ppt powerpoint presentation summary show. This is a two stage process. The stages in this process are sales in percentage, financial year, business, marketing, finance.
Bar Chart Ppt PowerPoint Presentation Icon Layout
This is a bar chart ppt powerpoint presentation icon layout. This is a one stage process. The stages in this process are sales in percentage, financial years, bar chart, finance, marketing.
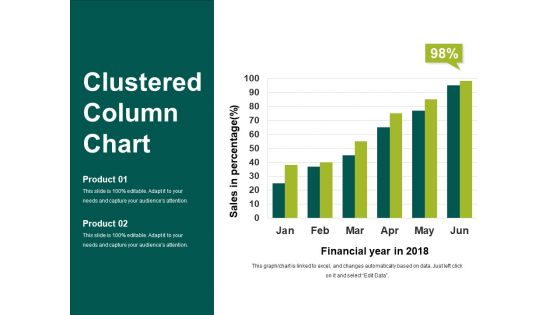
Clustered Column Chart Ppt PowerPoint Presentation Show Slideshow
This is a clustered column chart ppt powerpoint presentation show slideshow. This is a six stage process. The stages in this process are financial year in, sales in percentage, business, marketing, finance.
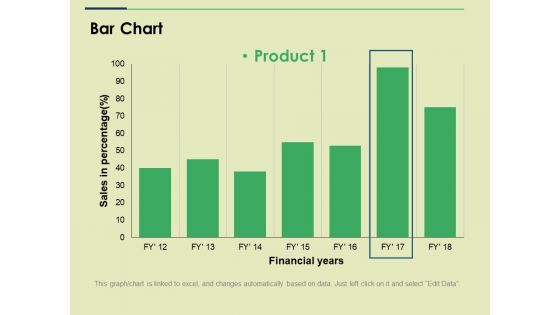
Bar Chart Ppt PowerPoint Presentation File Slide
This is a bar chart ppt powerpoint presentation file slide. This is a one stage process. The stages in this process are sales in percentage financial years, business, marketing, strategy, graph.
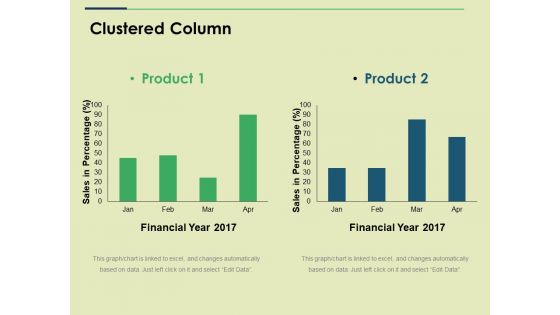
Clustered Column Ppt PowerPoint Presentation Show Graphics
This is a clustered column ppt powerpoint presentation show graphics. This is a two stage process. The stages in this process are financial year, sales in percentage, business, marketing, graph.
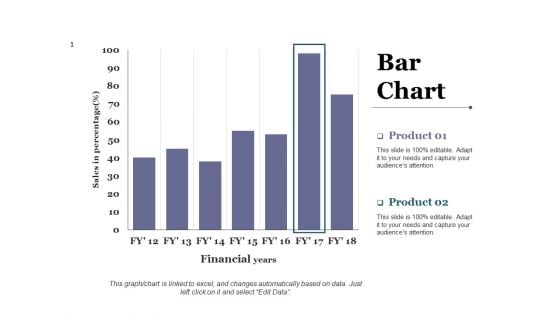
Bar Chart Ppt PowerPoint Presentation Diagram Lists
This is a bar chart ppt powerpoint presentation diagram lists. This is a two stage process. The stages in this process are business, marketing, financial years, sales in percentage, graph.
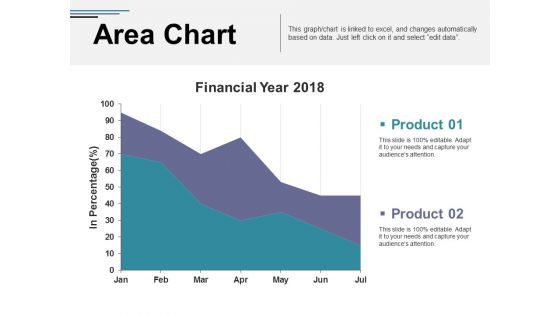
Area Chart Ppt PowerPoint Presentation Inspiration Professional
This is a area chart ppt powerpoint presentation inspiration professional. This is a two stage process. The stages in this process are financial year, in percentage, area chart, finance, business, marketing.
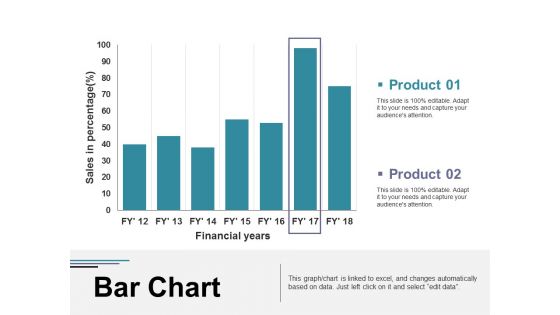
Bar Chart Ppt PowerPoint Presentation Visual Aids Diagrams
This is a bar chart ppt powerpoint presentation visual aids diagrams. This is a two stage process. The stages in this process are business, marketing, financial years, sales in percentage, graph.
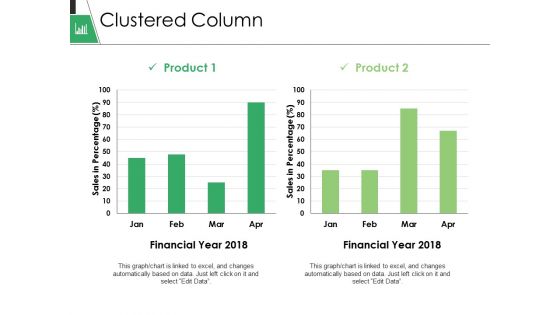
Clustered Column Ppt PowerPoint Presentation Gallery Format
This is a clustered column ppt powerpoint presentation gallery format. This is a two stage process. The stages in this process are business, marketing, graph, financial year, sales in percentage.
Column Chart Ppt PowerPoint Presentation Infographic Template Icon
This is a column chart ppt powerpoint presentation infographic template icon. This is a two stage process. The stages in this process are business, marketing, sales in percentage, financial year, graph.
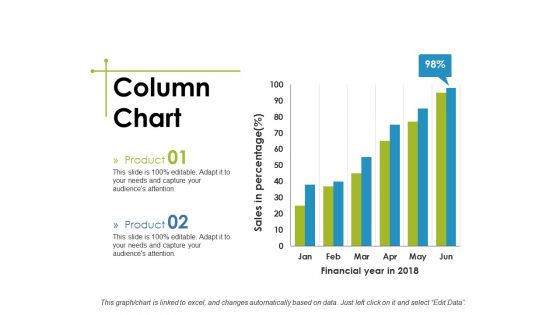
Column Chart Ppt PowerPoint Presentation Show Structure
This is a column chart ppt powerpoint presentation show structure. This is a two stage process. The stages in this process are business, financial year in, sales in percentage, marketing, graph.
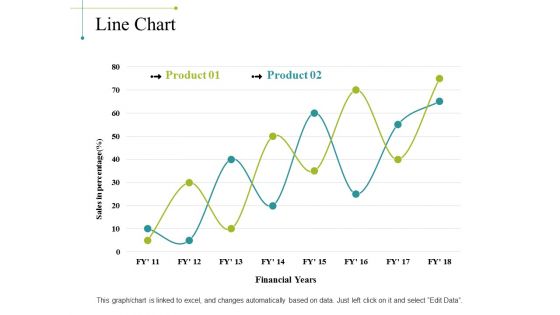
Line Chart Ppt PowerPoint Presentation Portfolio Background Image
This is a line chart ppt powerpoint presentation portfolio background image. This is a two stage process. The stages in this process are sales in percentage, financial years, chart, business, marketing, finance.
Area Chart Ppt PowerPoint Presentation Icon Aids
This is a area chart ppt powerpoint presentation icon aids. This is a three stage process. The stages in this process are financial years, sales in percentage, business, marketing, graph.
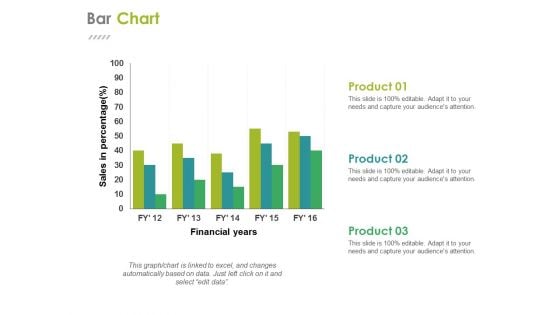
Bar Chart Ppt PowerPoint Presentation Summary Themes
This is a bar chart ppt powerpoint presentation summary themes. This is a three stage process. The stages in this process are financial years, sales in percentage, business, marketing, graph.
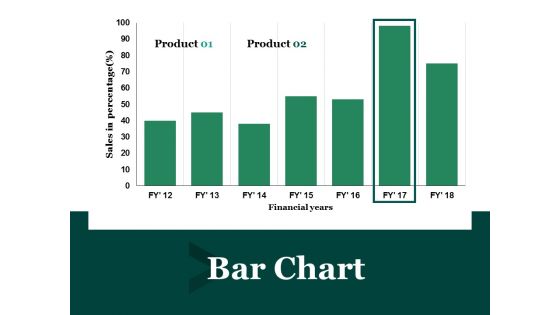
Bar Chart Ppt PowerPoint Presentation Layouts Template
This is a bar chart ppt powerpoint presentation layouts template. This is a two stage process. The stages in this process are financial year, sales in percentage, business, marketing, finance.
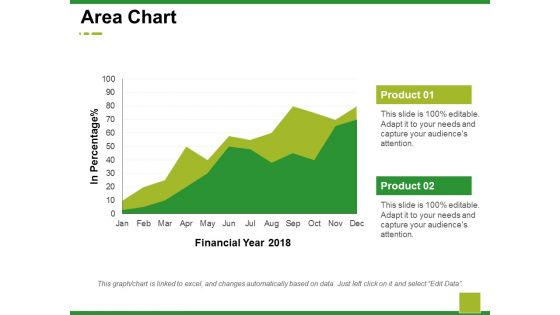
Area Chart Ppt PowerPoint Presentation Model Demonstration
This is a area chart ppt powerpoint presentation model demonstration. This is a two stage process. The stages in this process are business, marketing, financial year, in percentage, graph.
Bar Graph Ppt PowerPoint Presentation Infographics Icon
This is a bar graph ppt powerpoint presentation infographics icon. This is a two stage process. The stages in this process are business, marketing, financial year, in percentage, graph.
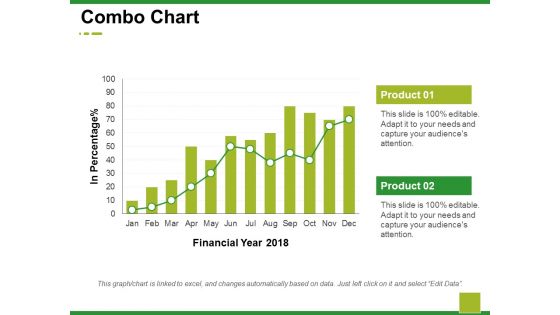
Combo Chart Ppt PowerPoint Presentation Summary Background Images
This is a combo chart ppt powerpoint presentation summary background images. This is a two stage process. The stages in this process are business, marketing, financial year, in percentage, graph.
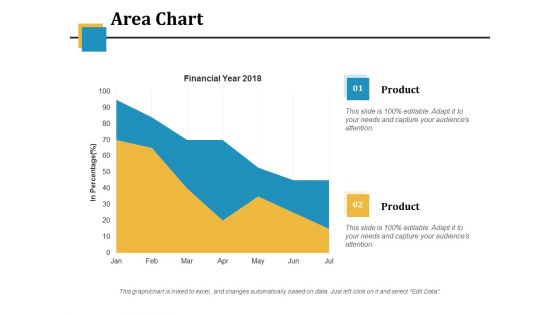
Area Chart Ppt PowerPoint Presentation Model Inspiration
This is a area chart ppt powerpoint presentation model inspiration. This is a two stage process. The stages in this process are financial year, in percentage, area chart, business, marketing.
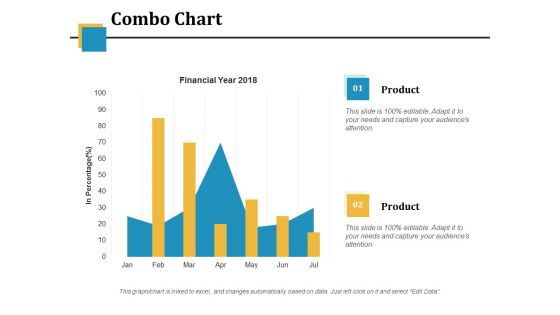
Combo Chart Ppt PowerPoint Presentation Model Vector
This is a combo chart ppt powerpoint presentation model vector. This is a two stage process. The stages in this process are financial year, in percentage, business, marketing, combo chart.
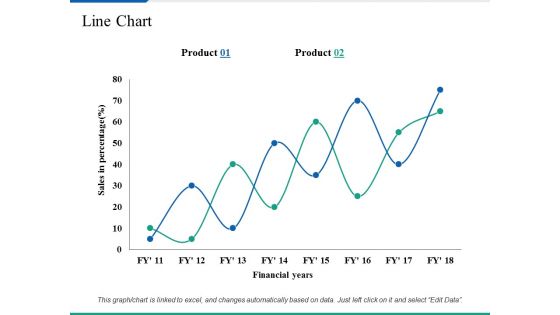
Line Chart Ppt PowerPoint Presentation Summary Clipart Images
This is a line chart ppt powerpoint presentation summary clipart images. This is a two stage process. The stages in this process are business, marketing, sales in percentage, financial years, strategy.
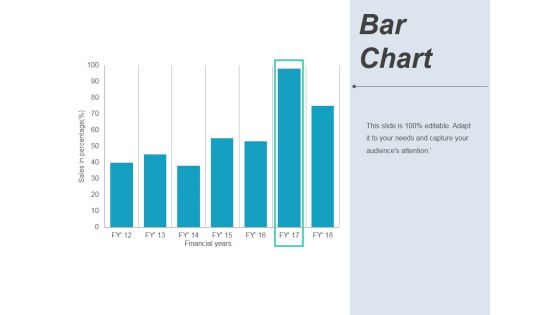
Bar Chart Ppt PowerPoint Presentation Pictures Background Image
This is a bar chart ppt powerpoint presentation pictures background image. This is a seven stage process. The stages in this process are financial years, sales in percentage, graph, business.
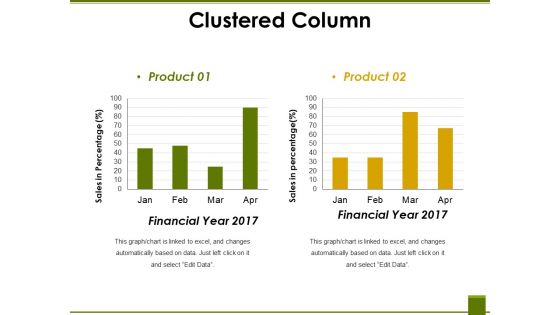
Clustered Column Ppt PowerPoint Presentation Ideas Graphic Tips
This is a clustered column ppt powerpoint presentation ideas graphic tips. This is a two stage process. The stages in this process are financial year, sales in percentage, product, graph, business.
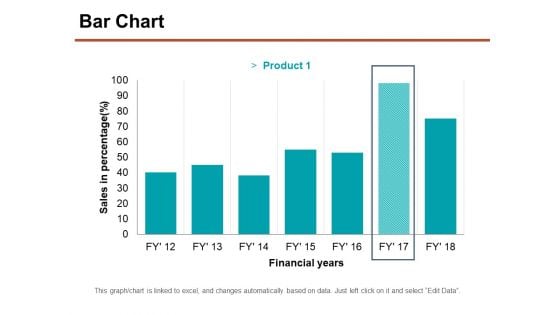
Bar Chart Ppt PowerPoint Presentation Professional Graphics Download
This is a bar chart ppt powerpoint presentation professional graphics download. This is a seven stage process. The stages in this process are sales in percentage, financial years, chart, business.
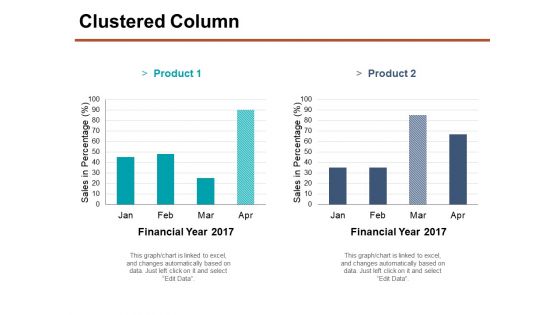
Clustered Column Ppt PowerPoint Presentation Portfolio Smartart
This is a clustered column ppt powerpoint presentation portfolio smartart. This is a two stage process. The stages in this process are financial year, product, sales in percentage, finance, business, graph.
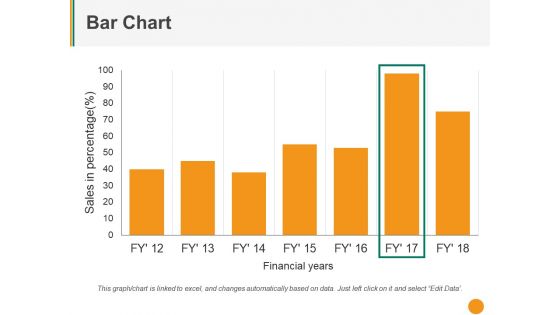
Bar Chart Ppt PowerPoint Presentation Styles Outfit
This is a bar chart ppt powerpoint presentation styles outfit. This is a Seven stage process. The stages in this process are sales in percentage, financial years, graph, business.
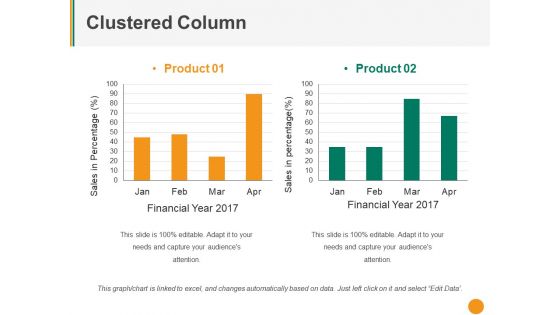
Clustered Column Ppt PowerPoint Presentation Pictures Mockup
This is a clustered column ppt powerpoint presentation pictures mockup. This is a two stage process. The stages in this process are product, sales in percentage, financial year, graph, business.
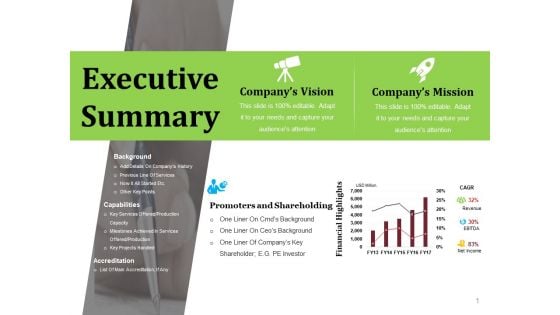
Executive Summary Ppt PowerPoint Presentation Ideas Professional
This is a executive summary ppt powerpoint presentation ideas professional. This is a two stage process. The stages in this process are company s vision, company s mission, promoters and shareholding, financial highlights.
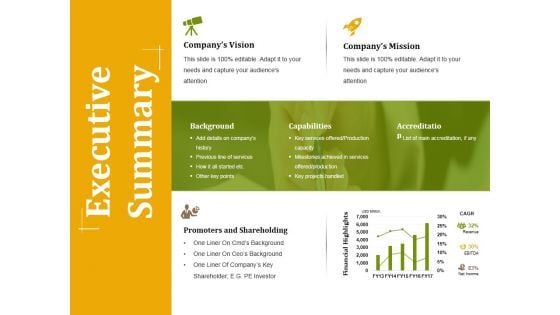
Executive Summary Ppt PowerPoint Presentation Professional Example
This is a executive summary ppt powerpoint presentation professional example. This is a four stage process. The stages in this process are background, capabilities, accreditation, promoters and shareholding, financial highlights.
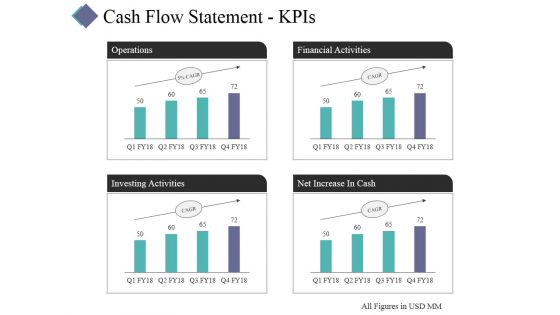
Cash Flow Statement Kpis Template 2 Ppt PowerPoint Presentation Layouts Visuals
This is a cash flow statement kpis template 2 ppt powerpoint presentation layouts visuals. This is a four stage process. The stages in this process are operations, financial activities, investing activities, net increase in cash.
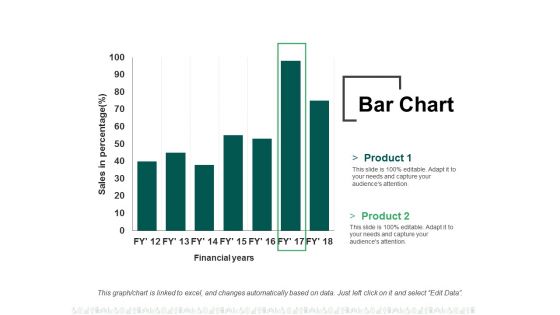
Bar Chart Ppt PowerPoint Presentation Summary File Formats
This is a bar chart ppt powerpoint presentation summary file formats. This is a two stage process. The stages in this process are business, finance, financial years, sales in percentage, graph.
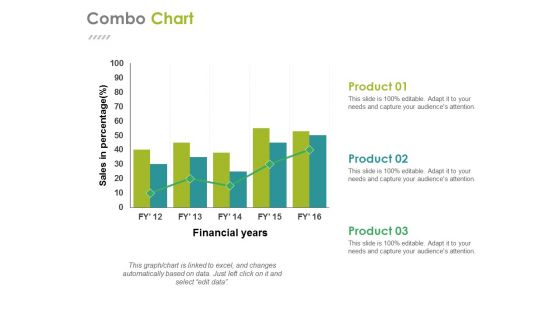
Combo Chart Ppt PowerPoint Presentation Gallery Design Ideas
This is a combo chart ppt powerpoint presentation gallery design ideas. This is a three stage process. The stages in this process are business, financial years, sales in percentage, finance, graph.


 Continue with Email

 Home
Home


