Mapping Of Financial Process
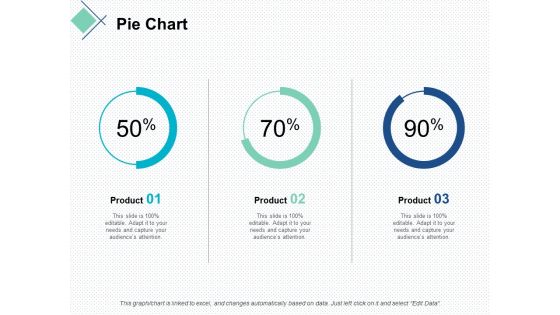
pie chart finance marketing ppt powerpoint presentation slides demonstration
This is a pie chart finance marketing ppt powerpoint presentation slides demonstration. This is a stage process. The stages in this process are finance, marketing, management, investment, analysis.
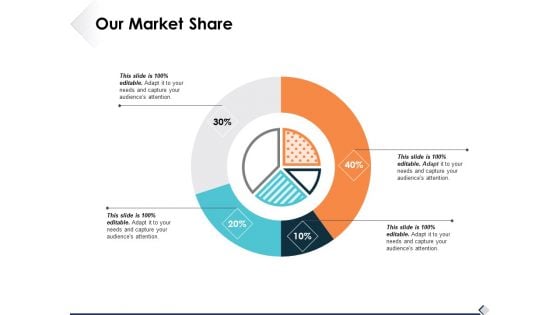
Our Market Share Ppt PowerPoint Presentation Infographics Inspiration
This is a our market share ppt powerpoint presentation infographics inspiration. This is a four stage process. The stages in this process are business, finance, strategy, analysis, marketing.
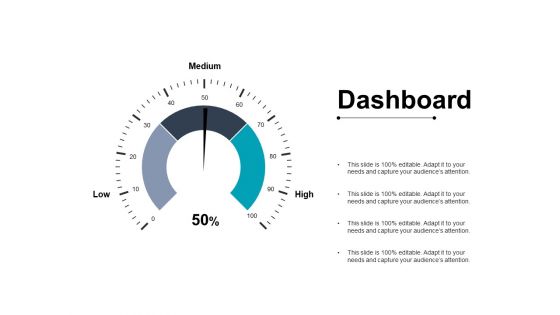
Dashboard Marketing Planning Ppt PowerPoint Presentation Slides Slideshow
This is a dashboard marketing planning ppt powerpoint presentation slides slideshow. This is a three stage process. The stages in this process are dashboard, finance, analysis, business, investment.
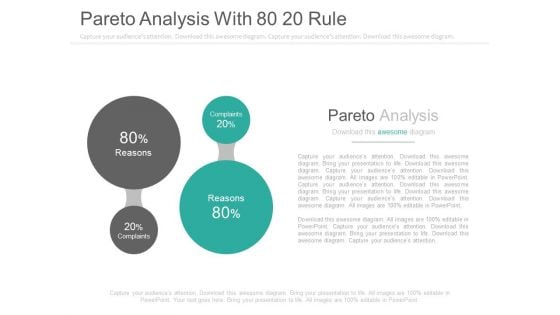
Pareto Analysis With 80 20 Rule Ppt Slides
This is a pareto analysis with 80 20 rule ppt slides. This is a two stage process. The stages in this process are finance, business.\n\n
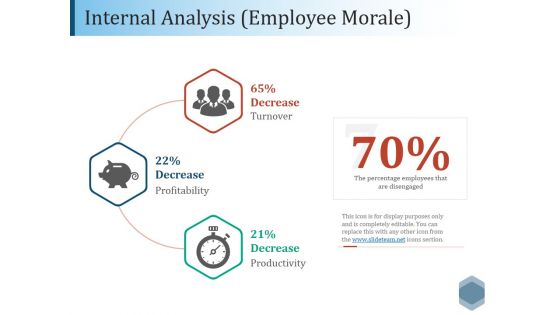
Internal Analysis Employee Morale Ppt PowerPoint Presentation Model Template
This is a internal analysis employee morale ppt powerpoint presentation model template. This is a three stage process. The stages in this process are decrease, profitability, turnover, productivity.
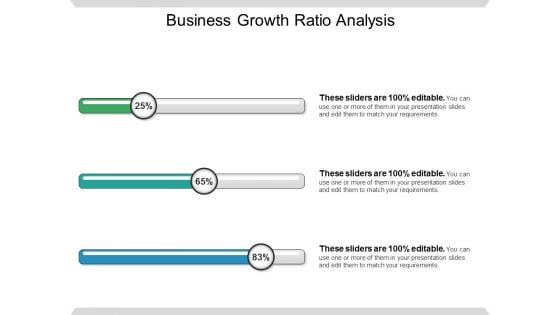
Business Growth Ratio Analysis Ppt PowerPoint Presentation Gallery Design Templates
This is a business growth ratio analysis ppt powerpoint presentation gallery design templates. This is a three stage process. The stages in this process are cost reduction strategies.

Thank You Time Analysis Ppt PowerPoint Presentation File Examples
This is a thank you time analysis ppt powerpoint presentation file examples. This is a one stage process. The stages in this process are thank you.
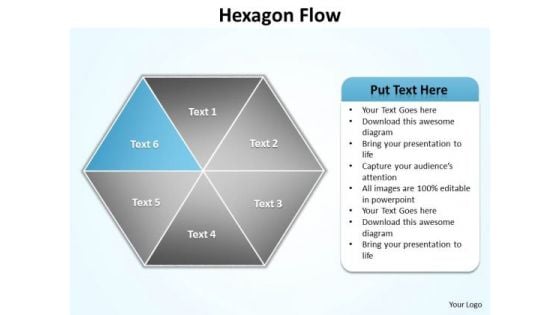
Ppt Blue Factor Hexagon Angles Spider Diagram PowerPoint Template Editable Templates
PPT blue factor hexagon angles spider diagram PowerPoint template editable Templates-You can easily collaborate this PowerPoint diagram with colleagues to create detailed process diagrams and use them as a key element in streamlining your processes. Use this graphical approach to represent global business issues such as financial data, stock market Exchange, increase in sales, corporate presentations and more. -PPT blue factor hexagon angles spider diagram PowerPoint template editable Templates-attached, backgrounds, blue, cell, color, component, connect, connection, diagram, elements, geometric, graphic, group, hexagon, honeycomb, icon, illustration, intricacy, lines, link, map, mesh, model, network, science, shape, shiny, strategy, structure, symbol, teamwork, technology Out Ppt Blue Factor Hexagon Angles Spider Diagram PowerPoint Template Editable Templates embody the contemporary. They are always at the forefront of fashion.
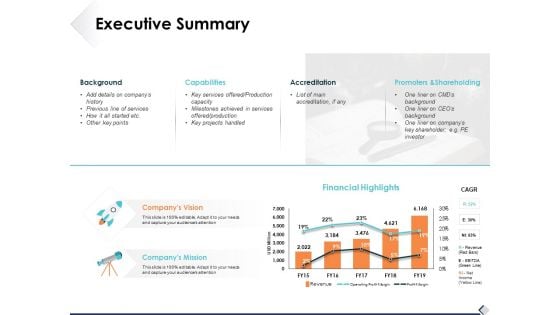
Executive Summary Ppt PowerPoint Presentation Outline Example Introduction
This is a executive summary ppt powerpoint presentation outline example introduction. This is a two stage process. The stages in this process are icons, finance, strategy, analysis, marketing.
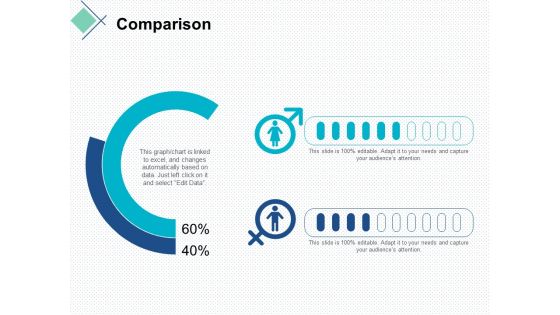
comparison male female ppt powerpoint presentation show professional
This is a comparison male female ppt powerpoint presentation show professional. This is a two stage process. The stages in this process are finance, marketing, management, investment, analysis.
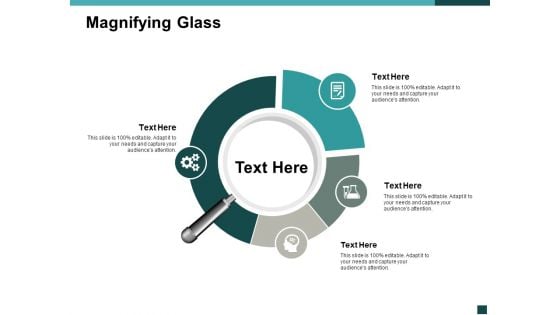
Magnifying Glass Technology Ppt Powerpoint Presentation Gallery Diagrams
This is a magnifying glass technology ppt powerpoint presentation gallery diagrams. This is a four stage process. The stages in this process are finance, marketing, management, investment, analysis.
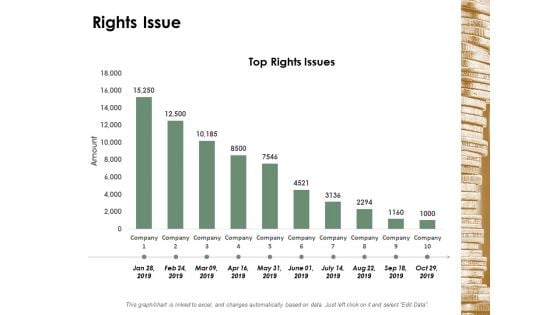
Rights Issue Management Ppt Powerpoint Presentation Portfolio Objects
This is a rights issue management ppt powerpoint presentation portfolio objects. This is a two stage process. The stages in this process are finance, marketing, management, investment, analysis.
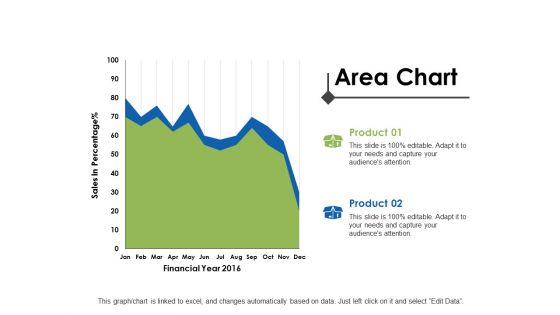
Area Chart Ppt PowerPoint Presentation Summary Model
This is a area chart ppt powerpoint presentation summary model. This is a two stage process. The stages in this process are analysis, finance, marketing, management, investment.
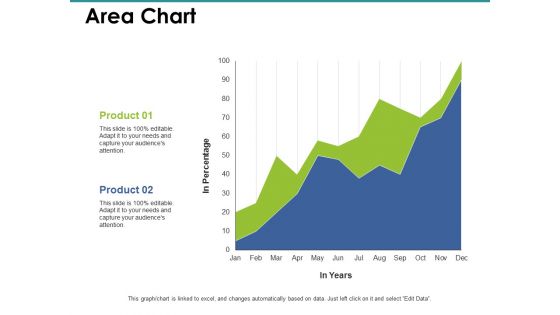
Area Chart Ppt PowerPoint Presentation Gallery Diagrams
This is a area chart ppt powerpoint presentation gallery diagrams. This is a two stage process. The stages in this process are finance, marketing, management, investment, analysis.
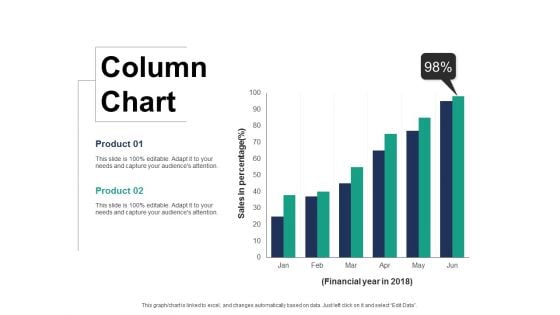
Column Chart Finance Ppt PowerPoint Presentation Layouts Display
This is a column chart finance ppt powerpoint presentation layouts display. This is a two stage process. The stages in this process are finance, marketing, management, investment, analysis.
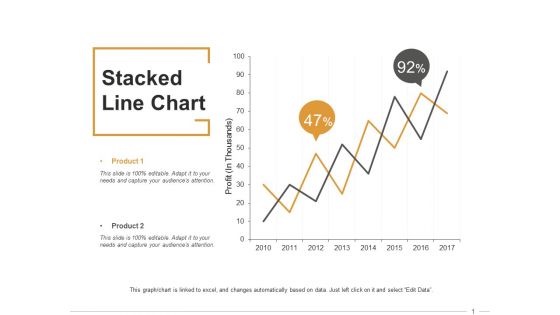
Stacked Line Chart Ppt PowerPoint Presentation Inspiration Format
This is a stacked line chart ppt powerpoint presentation inspiration format. This is a two stage process. The stages in this process are finance, marketing, management, investment, analysis.

Clustered Column Ppt PowerPoint Presentation Professional Example
This is a clustered column ppt powerpoint presentation professional example. This is a two stage process. The stages in this process are finance, marketing, management, investment, analysis.

Stacked Area Clustered Column Ppt PowerPoint Presentation Gallery
This is a stacked area clustered column ppt powerpoint presentation gallery. This is a three stage process. The stages in this process are finance, marketing, management, investment, analysis.
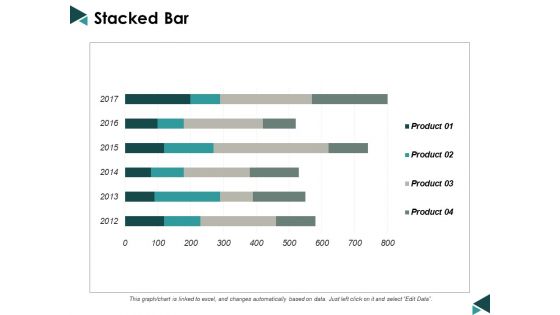
Stacked Bar Finance Ppt Powerpoint Presentation Infographics Example
This is a stacked bar finance ppt powerpoint presentation infographics example. This is a four stage process. The stages in this process are finance, marketing, management, investment, analysis.
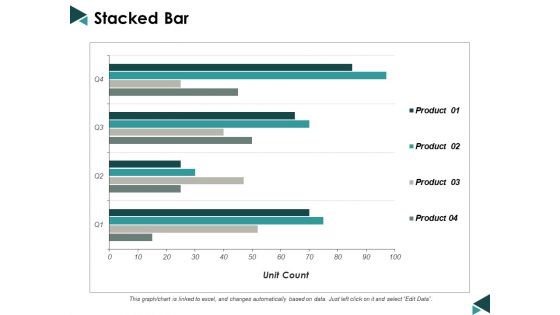
Stacked Bar Ppt Powerpoint Presentation Ideas Templates
This is a stacked bar ppt powerpoint presentation ideas templates. This is a four stage process. The stages in this process are finance, marketing, management, investment, analysis.
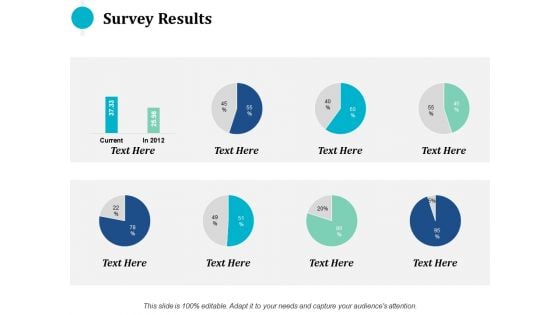
survey results ppt powerpoint presentation pictures guidelines
This is a survey results ppt powerpoint presentation pictures guidelines. This is a eight stage process. The stages in this process are finance, marketing, management, investment, analysis.
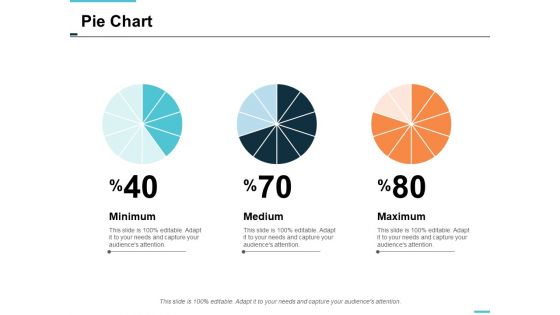
pie chart finance ppt powerpoint presentation styles skills
This is a pie chart finance ppt powerpoint presentation styles skills. This is a three stage process. The stages in this process are finance, marketing, management, investment, analysis.

Combo Chart Finance Ppt PowerPoint Presentation Portfolio Guidelines
This is a combo chart finance ppt powerpoint presentation portfolio guidelines. This is a three stage process. The stages in this process are finance, marketing, management, investment, analysis.
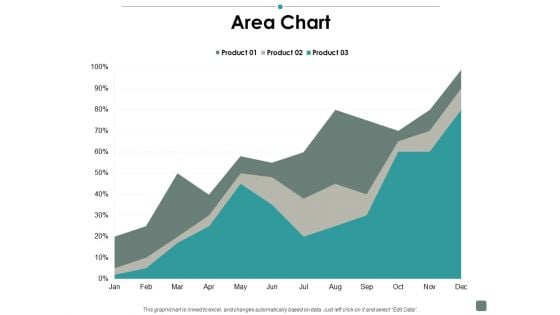
Area Chart Contribution Ppt PowerPoint Presentation Gallery Structure
This is a area chart contribution ppt powerpoint presentation gallery structure. This is a three stage process. The stages in this process are business, management, strategy, analysis, marketing.
Labour Effectiveness Dashboard Ppt PowerPoint Presentation Icon Vector
This is a labour effectiveness dashboard ppt powerpoint presentation icon vector.This is a three stage process. The stages in this process are finance, marketing, management, investment, analysis.
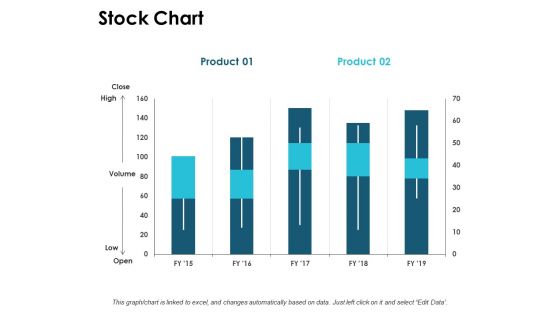
Stock Chart Graph Ppt PowerPoint Presentation Ideas Demonstration
This is a stock chart graph ppt powerpoint presentation ideas demonstration. This is a three stage process. The stages in this process are finance, marketing, management, investment, analysis.
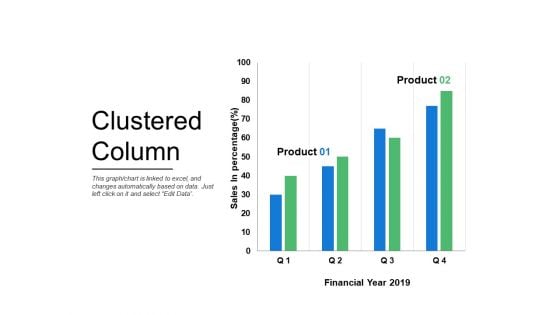
Clustered Column Graph Ppt PowerPoint Presentation Pictures Grid
This is a clustered column graph ppt powerpoint presentation pictures grid. This is a two stage process. The stages in this process are finance, marketing, management, investment, analysis.
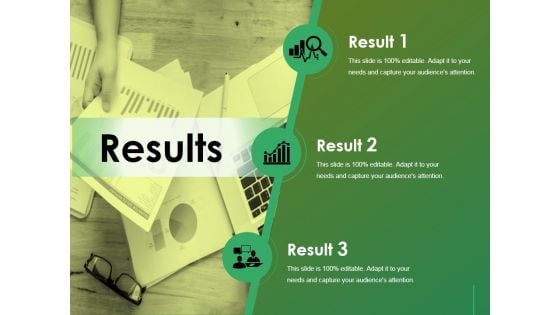
Results Ppt Powerpoint Presentation Infographics File Formats
This is a results ppt powerpoint presentation infographics file formats. This is a three stage process. The stages in this process are analysis, icon, business, marketing, strategy, finance.

Title Slide Ppt Powerpoint Presentation Inspiration Graphics Example
This is a title slide ppt powerpoint presentation inspiration graphics example. This is a two stage process. The stages in this process are business, analysis, marketing, strategy, finance.
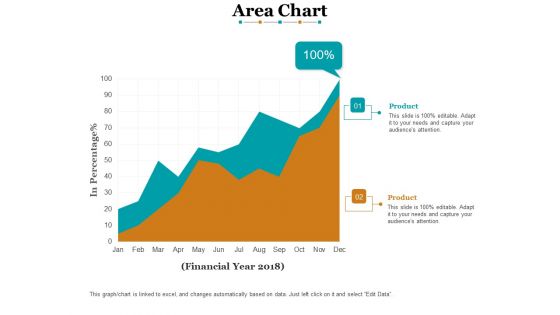
Area Chart Finance Ppt PowerPoint Presentation Model Ideas
This is a area chart finance ppt powerpoint presentation model ideas. This is a two stage process. The stages in this process are finance, marketing, analysis, business, investment.
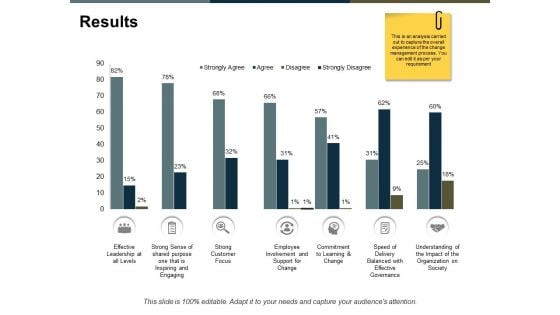
Results Ppt PowerPoint Presentation Model Graphics
This is a results ppt powerpoint presentation model graphics. This is a seven stage process. The stages in this process are finance, marketing, analysis, business, investment.
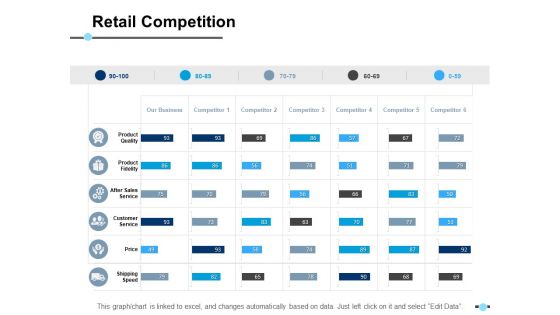
Retail Competition Price Ppt PowerPoint Presentation Professional Display
This is a retail competition price ppt powerpoint presentation professional display. This is a five stage process. The stages in this process are finance, strategy, analysis, marketing.
Stacked Bar Finance Icon Ppt PowerPoint Presentation Portfolio Tips
This is a stacked bar finance icon ppt powerpoint presentation portfolio tips. This is a three stage process. The stages in this process are finance, strategy, analysis, marketing.
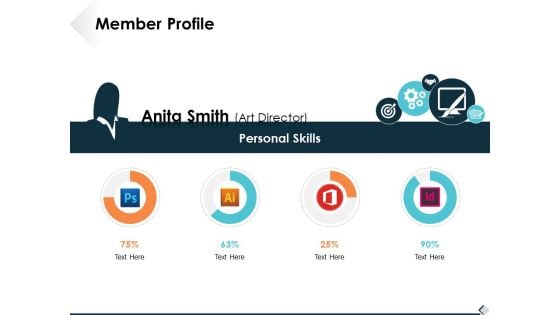
Member Profile Ppt PowerPoint Presentation Slides Portrait
This is a member profile ppt powerpoint presentation slides portrait. This is a four stage process. The stages in this process are icons, finance, strategy, analysis, marketing.

Social Media Facts Ppt PowerPoint Presentation Model Mockup
This is a social media facts ppt powerpoint presentation model mockup. This is a three stage process. The stages in this process are analysis, marketing, icons, finance, strategy.
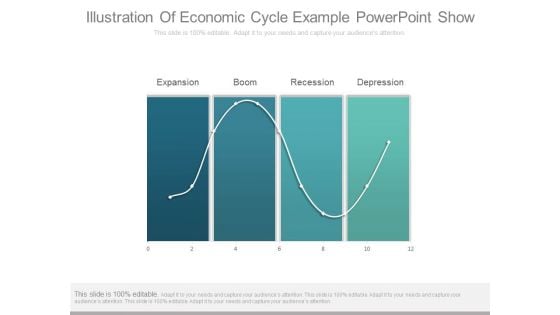
Illustration Of Economic Cycle Example Powerpoint Show
This is a illustration of economic cycle example powerpoint show. This is a four stage process. The stages in this process are expansion, boom, recession, depression.

Economic Order Quantity Ppt PowerPoint Presentation Pictures Introduction
This is a economic order quantity ppt powerpoint presentation pictures introduction. This is a three stage process. The stages in this process are finance, strategy, marketing, compare, business.
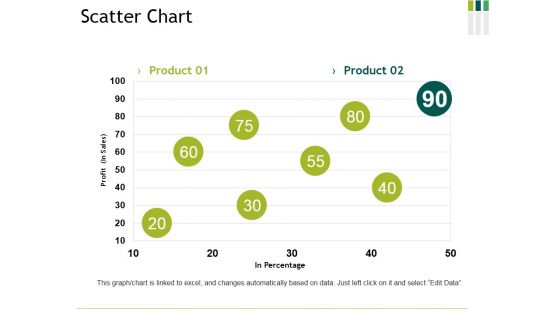
Scatter Chart Ppt PowerPoint Presentation Ideas Summary
This is a scatter chart ppt powerpoint presentation ideas summary. This is a two stage process. The stages in this process are scatter chart, finance, analysis, business, management.
Bonds Contribution Ppt PowerPoint Presentation Gallery Themes
This is a bonds contribution ppt powerpoint presentation gallery themes. This is a two stage process. The stages in this process are finance, business, management, strategy, analysis.
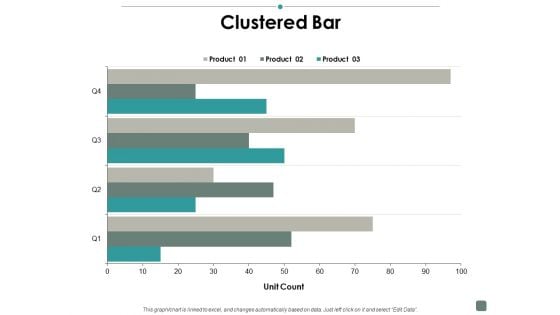
Clustered Bar Contribution Ppt PowerPoint Presentation Slides Example
This is a clustered bar contribution ppt powerpoint presentation slides example. This is a three stage process. The stages in this process are finance, business, management, strategy, analysis.
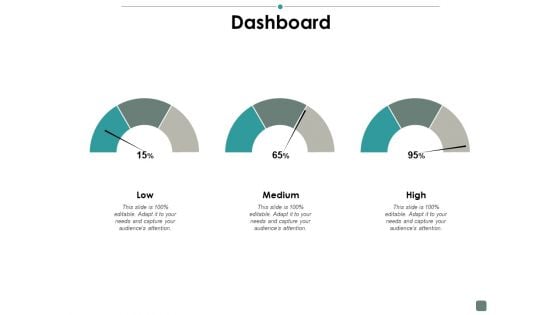
Dashboard Contribution Ppt PowerPoint Presentation Summary Ideas
This is a dashboard contribution ppt powerpoint presentation summary ideas. This is a three stage process. The stages in this process are finance, business, management, strategy, analysis.
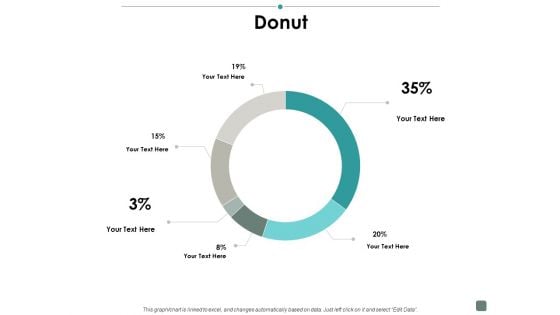
Donut Contribution Ppt PowerPoint Presentation Infographic Template Backgrounds
This is a donut contribution ppt powerpoint presentation infographic template backgrounds. This is a six stage process. The stages in this process are finance, business, management, strategy, analysis.

Product Development And Testing Ppt Images Gallery
This is a product development and testing ppt images gallery. This is a five stage process. The stages in this process are business, strategy, finance, management, analysis.
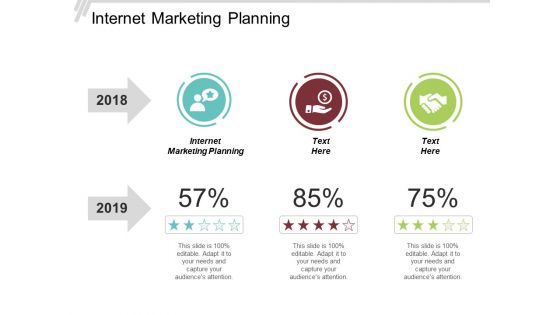
Internet Marketing Planning Ppt PowerPoint Presentation Sample Cpb
This is a internet marketing planning ppt powerpoint presentation sample cpb. This is a three stage process. The stages in this process are internet marketing planning.
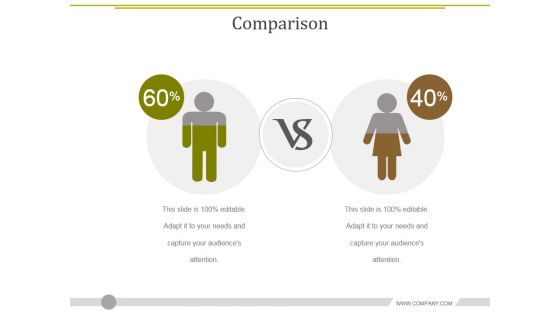
Comparison Ppt PowerPoint Presentation Ideas Outline
This is a comparison ppt powerpoint presentation ideas outline. This is a two stage process. The stages in this process are business, finance, marketing, management, compare.
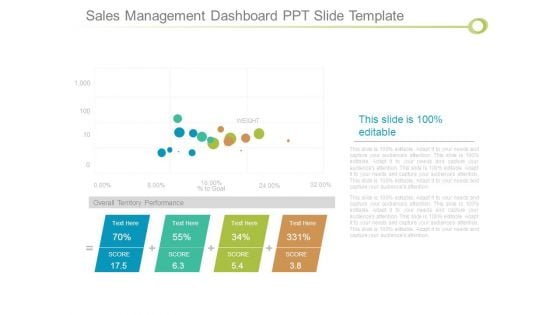
Sales Management Dashboard Ppt Slide Template
This is a sales management dashboard ppt slide template. This is a four stage process. The stages in this process are weight, goal, overall territory performance, score.
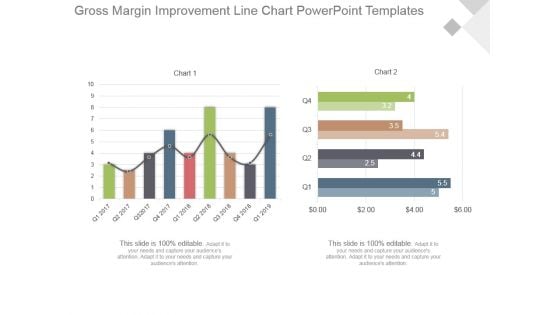
Gross Margin Improvement Line Chart Powerpoint Templates
This is a gross margin improvement line chart powerpoint templates. This is a two stage process. The stages in this process are chart.
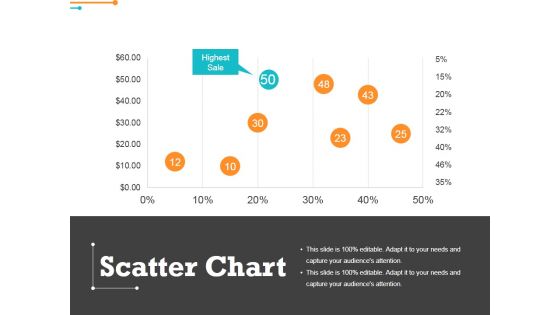
Scatter Chart Ppt PowerPoint Presentation Outline Graphics
This is a scatter chart ppt powerpoint presentation outline graphics. This is a eight stage process. The stages in this process are highest sale, percentage, finance, business.
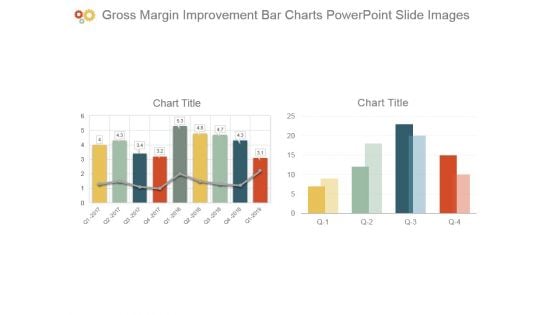
Gross Margin Improvement Bar Charts Powerpoint Slide Images
This is a gross margin improvement bar charts powerpoint slide images. This is a two stage process. The stages in this process are chart title.
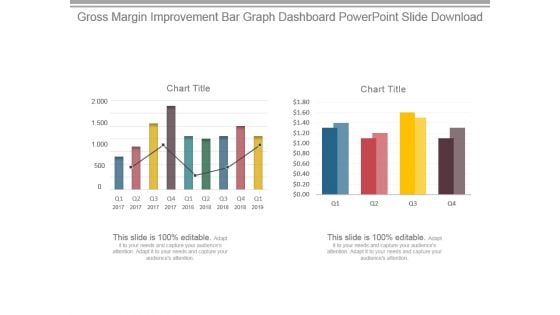
Gross Margin Improvement Bar Graph Dashboard Powerpoint Slide Download
This is a gross margin improvement bar graph dashboard powerpoint slide download. This is a two stage process. The stages in this process are chart title.
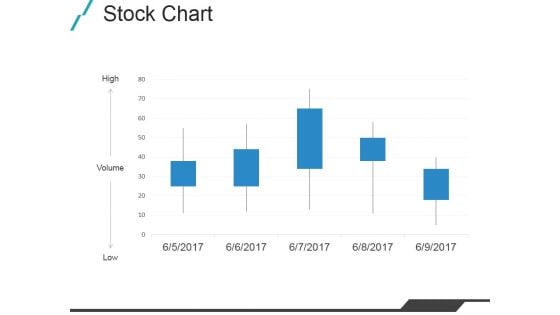
Stock Chart Ppt PowerPoint Presentation Outline Slide Portrait
This is a stock chart ppt powerpoint presentation outline slide portrait. This is a five stage process. The stages in this process are high, volume, low, business.
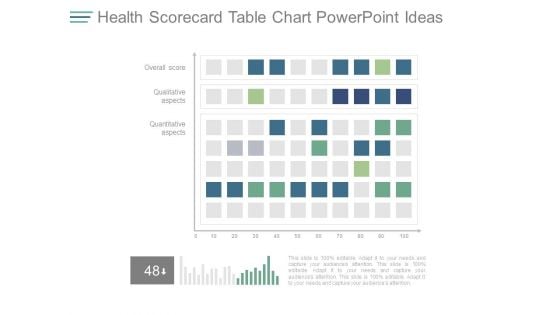
Health Scorecard Table Chart Powerpoint Ideas
This is a health scorecard table chart powerpoint ideas. This is a two stage process. The stages in this process are overall score, qualitative aspects, quantitative aspects.
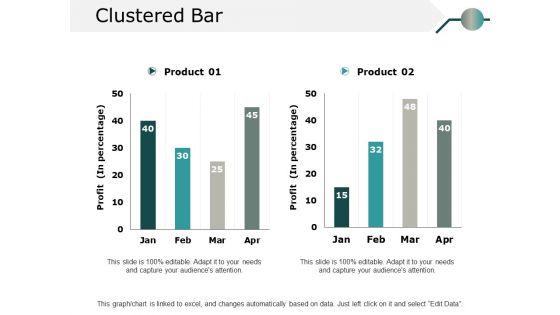
Clustered Bar Ppt PowerPoint Presentation Summary Elements
This is a clustered bar ppt powerpoint presentation summary elements. This is a two stage process. The stages in this process are percentage, product, business, marketing.

Clustered Column Line Ppt PowerPoint Presentation Styles Elements
This is a clustered column line ppt powerpoint presentation styles elements. This is a two stage process. The stages in this process are product, percentage, management, marketing.
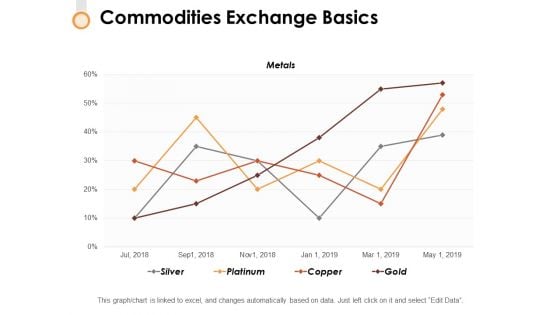
Commodities Exchange Basics Ppt PowerPoint Presentation Outline Demonstration
This is a commodities exchange basics ppt powerpoint presentation outline demonstration. This is a four stage process. The stages in this process are finance, strategy, marketing, compare, business.
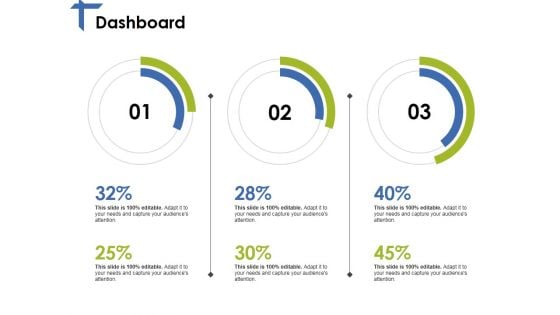
Dashboard Ppt PowerPoint Presentation Ideas Pictures
This is a dashboard ppt powerpoint presentation ideas pictures. This is a three stage process. The stages in this process are dashboard, finance, percentage, business, management.
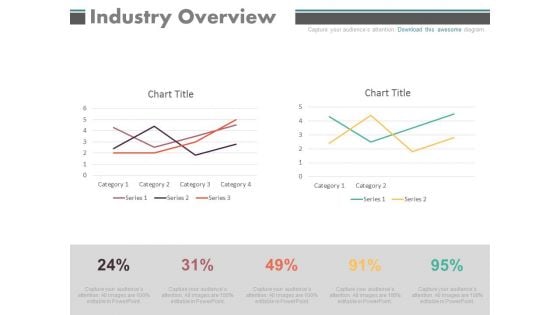
Industry Overview Percentage Chart Ppt Slides
This is a industry overview percentage chart ppt slides. This is a two stage process. The stages in this process are business, marketing.
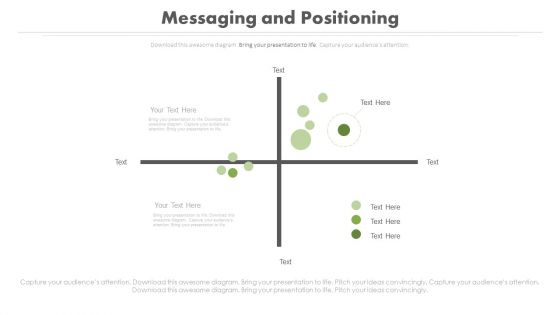
Messaging And Positioning Line Chart Ppt Slides
This is a messaging and positioning line chart ppt slides. This is a two stage process. The stages in this process are business, marketing.
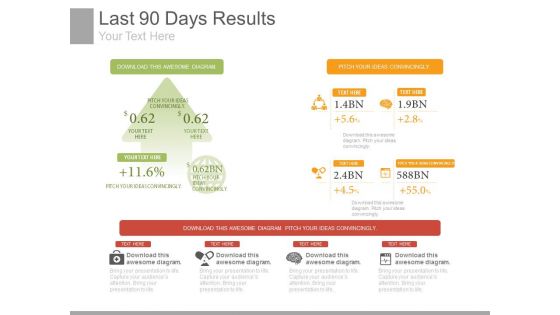
Last 90 Days Results Ppt Slides
This is a last 90 days results ppt slides. This is a four stage process. The stages in this process are business, marketing.
Chart Variations To Compare Quarterly Performance Ppt Icon
This is a chart variations to compare quarterly performance ppt icon. This is a five stage process. The stages in this process are series, business, marketing, finance, success.


 Continue with Email

 Home
Home


