Margin Improvement
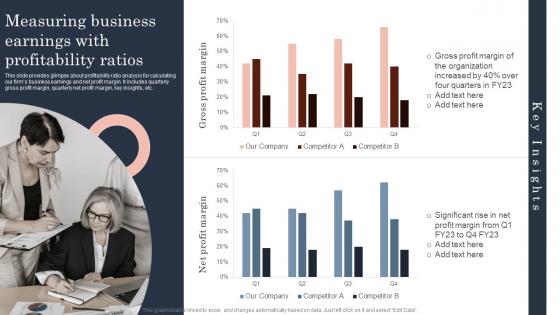
Measuring Business Earnings With Guide To Corporate Financial Growth Plan Background Pdf
This slide provides glimpse about profitability ratio analysis for calculating our firms business earnings and net profit margin. It includes quarterly gross profit margin, quarterly net profit margin, key insights, etc.Here you can discover an assortment of the finest PowerPoint and Google Slides templates. With these templates, you can create presentations for a variety of purposes while simultaneously providing your audience with an eye-catching visual experience. Download Measuring Business Earnings With Guide To Corporate Financial Growth Plan Background Pdf to deliver an impeccable presentation. These templates will make your job of preparing presentations much quicker, yet still, maintain a high level of quality. Slidegeeks has experienced researchers who prepare these templates and write high-quality content for you. Later on, you can personalize the content by editing the Measuring Business Earnings With Guide To Corporate Financial Growth Plan Background Pdf. This slide provides glimpse about profitability ratio analysis for calculating our firms business earnings and net profit margin. It includes quarterly gross profit margin, quarterly net profit margin, key insights, etc.
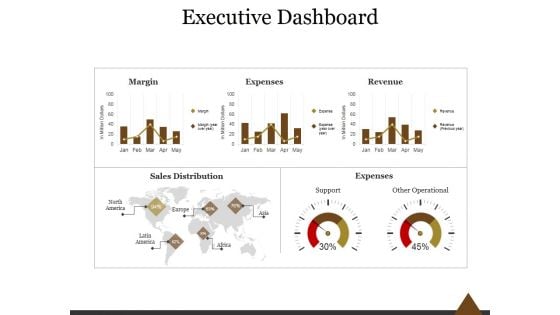
Executive Dashboard Ppt PowerPoint Presentation Professional
This is a executive dashboard ppt powerpoint presentation professional. This is a five stage process. The stages in this process are margin, expenses, revenue, sales distribution, expenses, support, other operational.
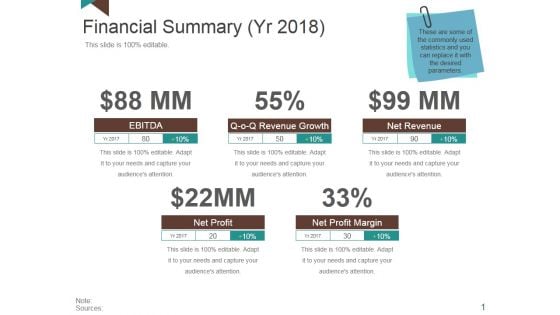
Financial Summary Ppt PowerPoint Presentation Layouts Portrait
This is a financial summary ppt powerpoint presentation layouts portrait. This is a four stage process. The stages in this process are ebitda, revenue growth, net revenue, net profit margin, net profit.
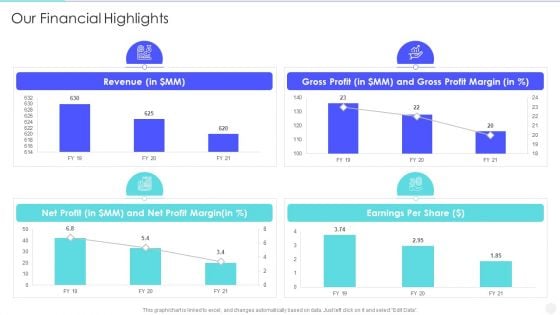
Increase Returns By Examining And Executing New Sales Qualification Procedure Our Financial Highlights Microsoft PDF
Deliver and pitch your topic in the best possible manner with this increase returns by examining and executing new sales qualification procedure our financial highlights microsoft pdf. Use them to share invaluable insights on revenue, gross profit and gross profit margin, net profit and net profit margin, earnings per share and impress your audience. This template can be altered and modified as per your expectations. So, grab it now.
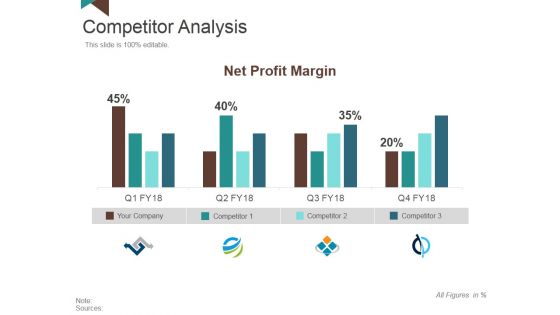
Competitor Analysis Template 3 Ppt PowerPoint Presentation Ideas Graphic Tips
This is a competitor analysis template 3 ppt powerpoint presentation ideas graphic tips. This is a four stage process. The stages in this process are net profit margin, your company, competitor.
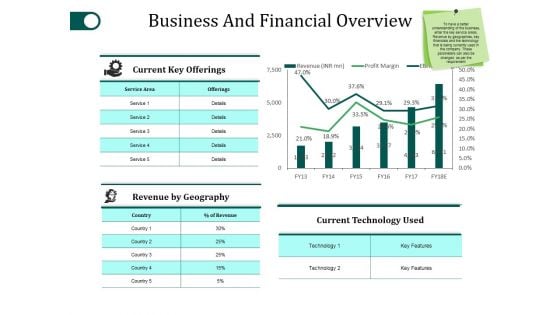
Business And Financial Overview Ppt PowerPoint Presentation Inspiration Clipart Images
This is a business and financial overview ppt powerpoint presentation inspiration clipart images. This is a four stage process. The stages in this process are current key offerings, revenue by geography, current technology used, profit margin, revenue.
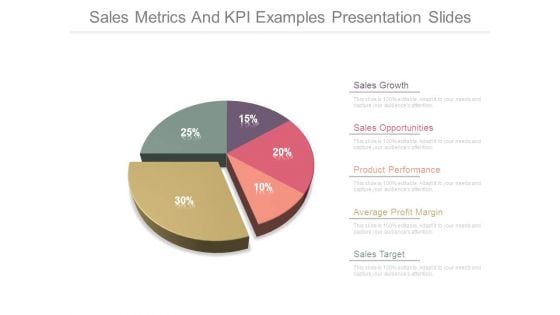
Sales Metrics And Kpi Examples Presentation Slides
This is a sales metrics and kpi examples presentation slides. This is a five stage process. The stages in this process are sales growth, sales opportunities, product performance, average profit margin, sales target.
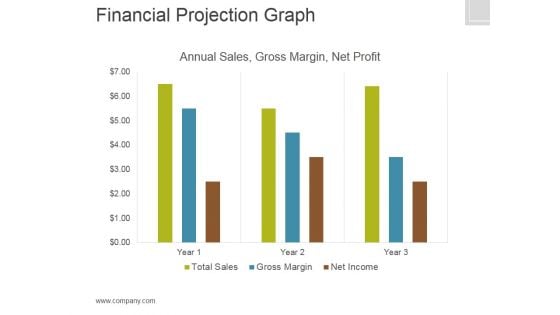
Financial Projection Graph Template 2 Ppt PowerPoint Presentation Graphics
This is a financial projection graph template 2 ppt powerpoint presentation graphics. This is a three stage process. The stages in this process are annual sales, gross margin, net profit, finance.
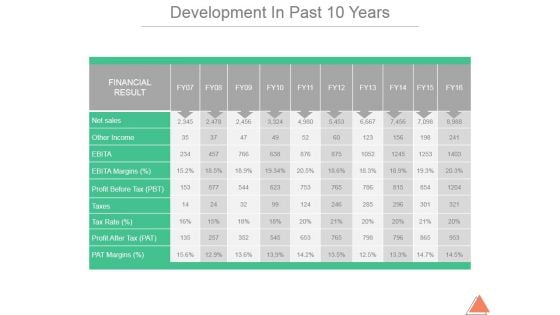
Development In Past 10 Years Template 1 Ppt PowerPoint Presentation Infographics
This is a development in past 10 years template 1 ppt powerpoint presentation infographics. This is a ten stage process. The stages in this process are net sales, other income, ebita margins, profit before tax, taxes.
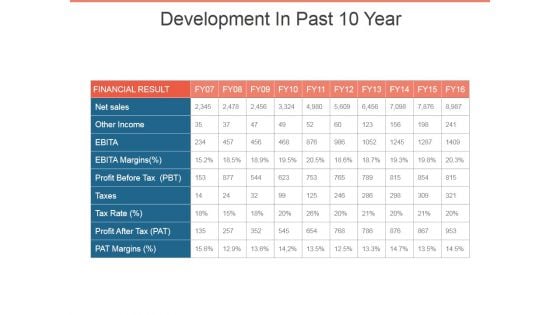
Development In Past 10 Year Template 2 Ppt PowerPoint Presentation Infographic Template Example
This is a development in past 10 year template 2 ppt powerpoint presentation infographic template example. This is a ten stage process. The stages in this process are other income, net sales, ebita margins, taxes, financial result.
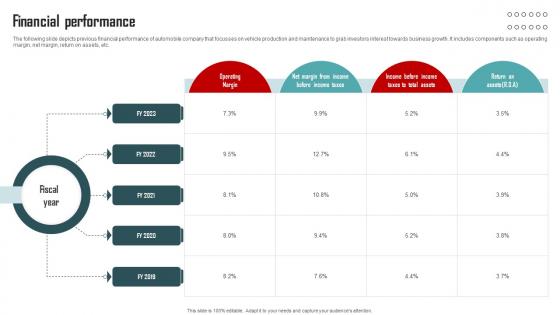
Financial Performance Vehicle Company Capital Funding Pitch Deck
The following slide depicts previous financial performance of automobile company that focusses on vehicle production and maintenance to grab investors interest towards business growth. It includes components such as operating margin, net margin, return on assets, etc. From laying roadmaps to briefing everything in detail, our templates are perfect for you. You can set the stage with your presentation slides. All you have to do is download these easy-to-edit and customizable templates. Financial Performance Vehicle Company Capital Funding Pitch Deck will help you deliver an outstanding performance that everyone would remember and praise you for. Do download this presentation today. The following slide depicts previous financial performance of automobile company that focusses on vehicle production and maintenance to grab investors interest towards business growth. It includes components such as operating margin, net margin, return on assets, etc.
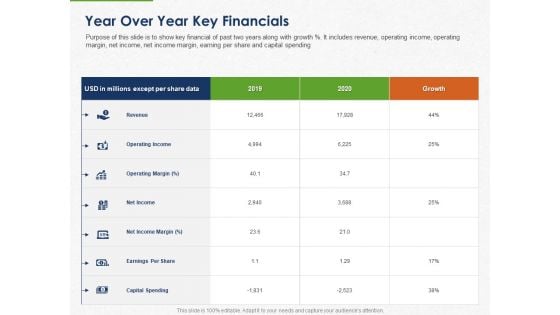
Developing And Creating Corner Market Place Year Over Year Key Financials Ppt PowerPoint Presentation Inspiration Outline PDF
Presenting this set of slides with name developing and creating corner market place year over year key financials ppt powerpoint presentation inspiration outline pdf. The topics discussed in these slides are revenue, operating income, operating margin, net income, net income margin, earnings per share, capital spending. This is a completely editable PowerPoint presentation and is available for immediate download. Download now and impress your audience.
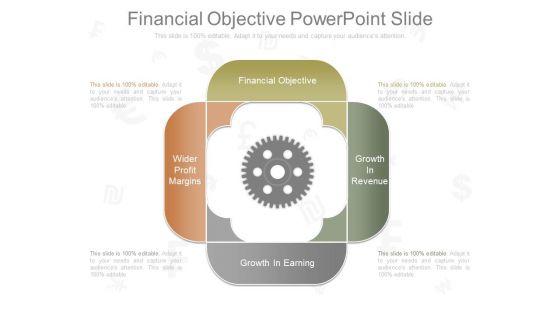
Financial Objective Powerpoint Slide
This is a financial objective powerpoint slide. This is a four stage process. The stages in this process are financial objective, growth in revenue, growth in earning, wider profit margins.
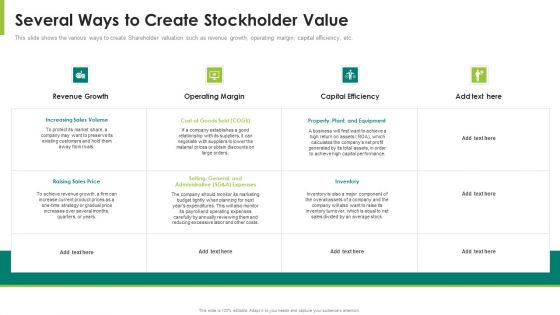
Several Ways To Create Stockholder Value Ppt Layouts Display
This slide shows the various ways to create Shareholder valuation such as revenue growth, operating margin, capital efficiency, etc. Deliver an awe inspiring pitch with this creative several ways to create stockholder value ppt layouts display bundle. Topics like revenue growth, operating margin, capital efficiency can be discussed with this completely editable template. It is available for immediate download depending on the needs and requirements of the user.
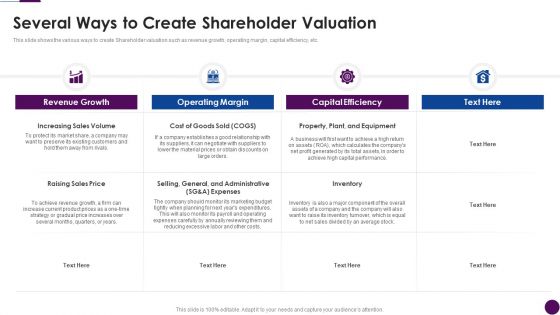
Procedure To Identify The Shareholder Value Several Ways To Create Shareholder Valuation Elements PDF
This slide shows the various ways to create Shareholder valuation such as revenue growth, operating margin, capital efficiency, etc. Deliver an awe inspiring pitch with this creative procedure to identify the shareholder value several ways to create shareholder valuation elements pdf bundle. Topics like revenue growth, operating margin, capital efficiency can be discussed with this completely editable template. It is available for immediate download depending on the needs and requirements of the user.
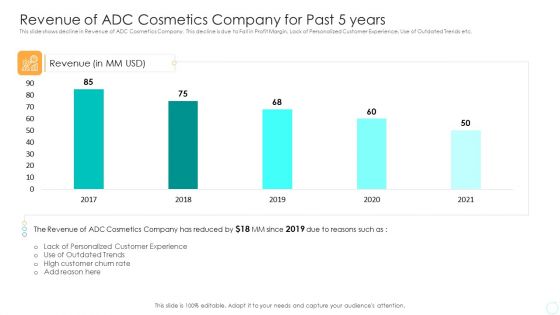
Revenue Of ADC Cosmetics Company For Past 5 Years Structure PDF
This slide shows decline in Revenue of ADC Cosmetics Company. This decline is due to Fall in Profit Margin, Lack of Personalized Customer Experience, Use of Outdated Trends etc. Deliver an awe-inspiring pitch with this creative revenue of adc cosmetics company for past 5 years structure pdf bundle. Topics like revenue, profit margin, customer experience can be discussed with this completely editable template. It is available for immediate download depending on the needs and requirements of the user.
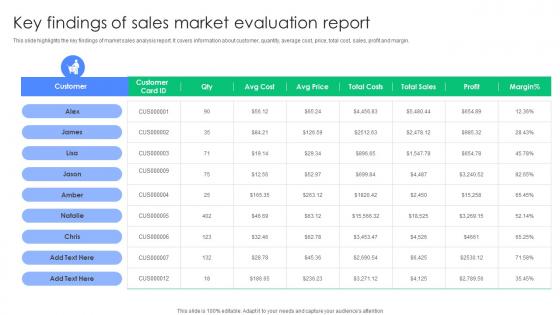
Key Findings Of Sales Market Evaluation Report Microsoft Pdf
This slide highlights the key findings of market sales analysis report. It covers information about customer, quantity, average cost, price, total cost, sales, profit and margin. Pitch your topic with ease and precision using this Key Findings Of Sales Market Evaluation Report Microsoft Pdf. This layout presents information on Customer, Sales Market, Evaluation Report. It is also available for immediate download and adjustment. So, changes can be made in the color, design, graphics or any other component to create a unique layout. This slide highlights the key findings of market sales analysis report. It covers information about customer, quantity, average cost, price, total cost, sales, profit and margin.
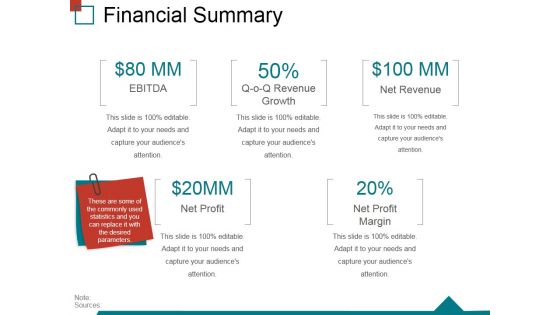
Financial Summary Ppt PowerPoint Presentation Ideas Slide Portrait
This is a financial summary ppt powerpoint presentation ideas slide portrait. This is a five stage process. The stages in this process are ebitda, revenue growth, net revenue, net profit, net profit, margin.
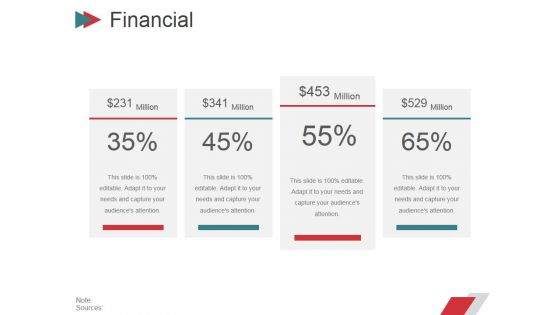
Financial Ppt PowerPoint Presentation Gallery Design Ideas
This is a financial ppt powerpoint presentation gallery design ideas. This is a five stage process. The stages in this process are ebitda, net profit, revenue, growth, net revenue, net profit, margin.
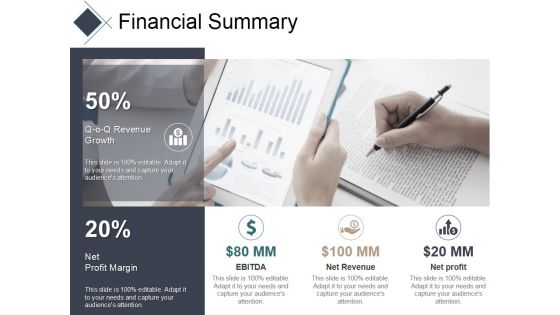
Financial Summary Ppt PowerPoint Presentation Professional Template
This is a financial summary ppt powerpoint presentation professional template. This is a two stage process. The stages in this process are revenue growth, net, profit margin, ebitda, net revenue, net profit.
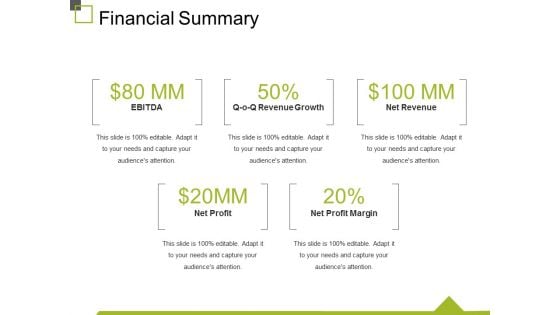
Financial Summary Ppt PowerPoint Presentation Model Demonstration
This is a financial summary ppt powerpoint presentation model demonstration. This is a five stage process. The stages in this process are ebitda, revenue growth, net revenue, net profit margin, net profit.
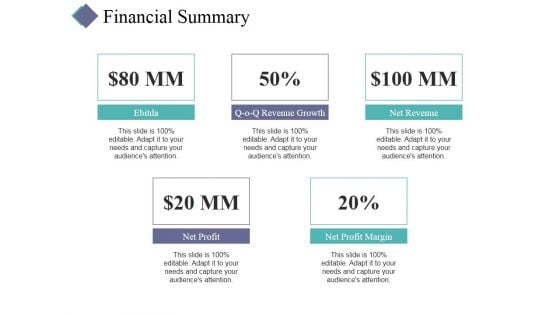
Financial Summary Ppt PowerPoint Presentation Summary Background
This is a financial summary ppt powerpoint presentation summary background. This is a five stage process. The stages in this process are net profit, net profit margin, net revenue, revenue growth.
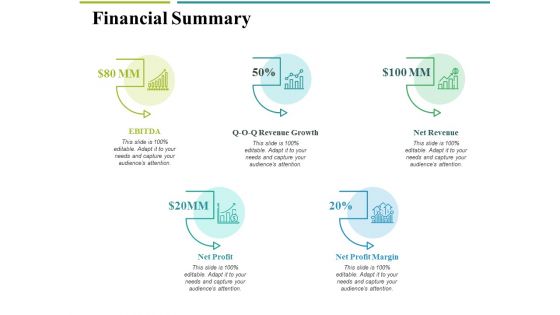
Financial Summary Ppt PowerPoint Presentation Ideas Samples
This is a financial summary ppt powerpoint presentation ideas samples. This is a five stage process. The stages in this process are ebitda, net profit, net profit margin, net revenue, revenue growth.
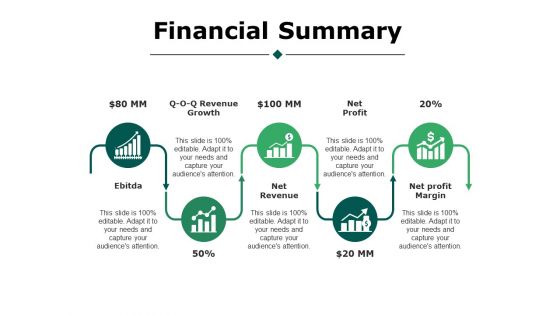
Financial Summary Ppt PowerPoint Presentation Styles Portfolio
This is a financial summary ppt powerpoint presentation styles portfolio. This is a five stage process. The stages in this process are business, ebitda, revenue growth, net revenue, net profit, net profit margin.
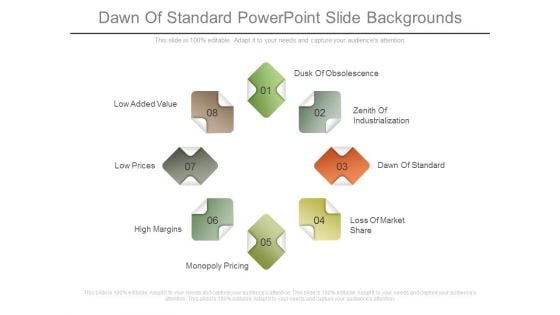
Dawn Of Standard Powerpoint Slide Backgrounds
This is a dawn of standard powerpoint slide backgrounds. This is an eight stage process. The stages in this process are dusk of obsolescence, zenith of industrialization, dawn of standard, loss of market share, monopoly pricing, high margins, low prices.
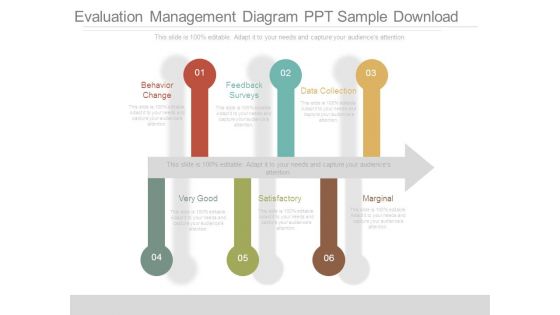
Evaluation Management Diagram Ppt Sample Download
This is a evaluation management diagram ppt sample download. This is a six stage process. The stages in this process are behavior change, feedback surveys, data collection, very good, satisfactory, marginal.
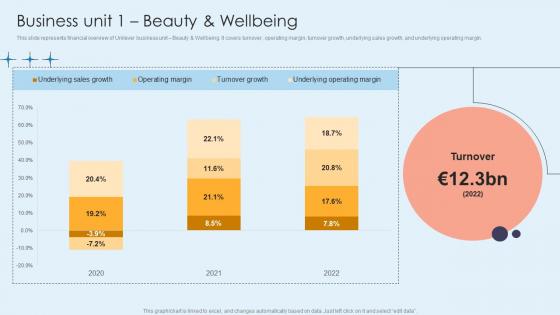
Business Unit 1 Beauty And Wellbeing Home Care Solutions Company Profile CP SS V
This slide represents financial overview of Unilever business unit Beauty and Wellbeing. It covers turnover, operating margin, turnover growth, underlying sales growth, and underlying operating margin.Slidegeeks is one of the best resources for PowerPoint templates. You can download easily and regulate Business Unit 1 Beauty And Wellbeing Home Care Solutions Company Profile CP SS V for your personal presentations from our wonderful collection. A few clicks is all it takes to discover and get the most relevant and appropriate templates. Use our Templates to add a unique zing and appeal to your presentation and meetings. All the slides are easy to edit and you can use them even for advertisement purposes. This slide represents financial overview of Unilever business unit Beauty and Wellbeing. It covers turnover, operating margin, turnover growth, underlying sales growth, and underlying operating margin.

Business Unit 2 Personal Care Home Care Solutions Company Profile CP SS V
This slide represents financial overview of Unilever business unit personal care. It covers turnover, operating margin, turnover growth, underlying sales growth, and underlying operating margin.Want to ace your presentation in front of a live audience Our Business Unit 2 Personal Care Home Care Solutions Company Profile CP SS V can help you do that by engaging all the users towards you. Slidegeeks experts have put their efforts and expertise into creating these impeccable powerpoint presentations so that you can communicate your ideas clearly. Moreover, all the templates are customizable, and easy-to-edit and downloadable. Use these for both personal and commercial use. This slide represents financial overview of Unilever business unit personal care. It covers turnover, operating margin, turnover growth, underlying sales growth, and underlying operating margin.

Business Unit 4 Nutrition Home Care Solutions Company Profile CP SS V
This slide represents financial overview of Unilever business unit Nutrition. It covers turnover, operating margin, turnover growth, underlying sales growth, and underlying operating margin.Do you have to make sure that everyone on your team knows about any specific topic I yes, then you should give Business Unit 4 Nutrition Home Care Solutions Company Profile CP SS V a try. Our experts have put a lot of knowledge and effort into creating this impeccable Business Unit 4 Nutrition Home Care Solutions Company Profile CP SS V. You can use this template for your upcoming presentations, as the slides are perfect to represent even the tiniest detail. You can download these templates from the Slidegeeks website and these are easy to edit. So grab these today This slide represents financial overview of Unilever business unit Nutrition. It covers turnover, operating margin, turnover growth, underlying sales growth, and underlying operating margin.

Business Unit 5 Ice Cream Home Care Solutions Company Profile CP SS V
This slide represents financial overview of Unilever business unit Ice cream. It covers turnover, operating margin, turnover growth, underlying sales growth, and underlying operating margin.Get a simple yet stunning designed Business Unit 5 Ice Cream Home Care Solutions Company Profile CP SS V. It is the best one to establish the tone in your meetings. It is an excellent way to make your presentations highly effective. So, download this PPT today from Slidegeeks and see the positive impacts. Our easy-to-edit Business Unit 5 Ice Cream Home Care Solutions Company Profile CP SS V can be your go-to option for all upcoming conferences and meetings. So, what are you waiting for Grab this template today. This slide represents financial overview of Unilever business unit Ice cream. It covers turnover, operating margin, turnover growth, underlying sales growth, and underlying operating margin.
Real Estate Developers Funding Alternatives Company Specific Competitor Landscape Icons PDF
Mentioned slide shows detailed competitive landscape analysis based on different parameters such as number of employees, founded year, projects completed and net profit margin. Deliver an awe inspiring pitch with this creative Real Estate Developers Funding Alternatives Company Specific Competitor Landscape Icons PDF bundle. Topics like Projects Completed, Net Profit Margin, Opportunities can be discussed with this completely editable template. It is available for immediate download depending on the needs and requirements of the user.
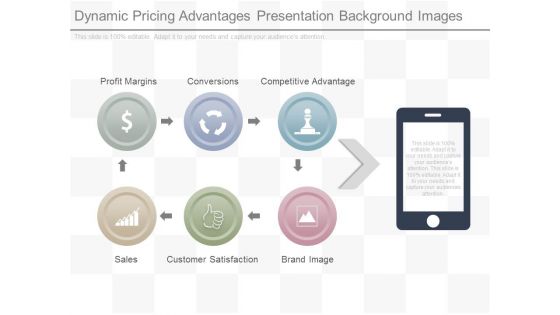
Dynamic Pricing Advantages Presentation Background Images
This is a dynamic pricing advantages presentation background images. This is a six stage process. The stages in this process are profit margins, conversions, competitive advantage, sales, customer satisfaction, brand image.
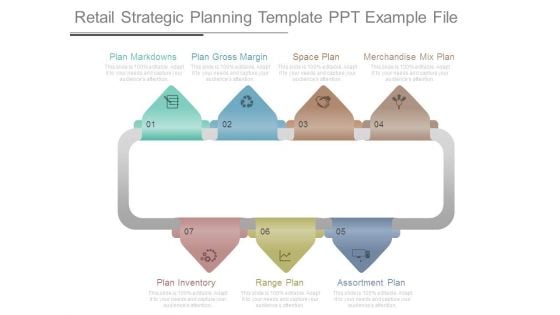
Retail Strategic Planning Template Ppt Example File
This is a retail strategic planning template ppt example file. This is a seven stage process. The stages in this process are plan markdowns, plan gross margin, space plan, merchandise mix plan, plan inventory, range plan, assortment plan.
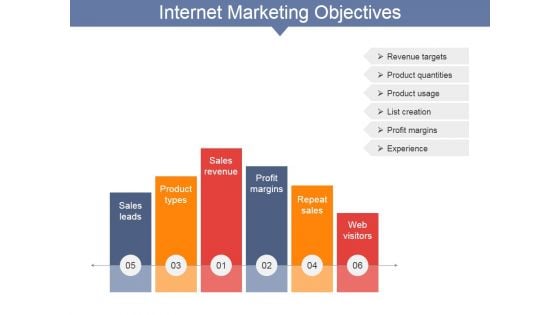
Internet Marketing Objectives Ppt PowerPoint Presentation Layouts Smartart
This is a internet marketing objectives ppt powerpoint presentation layouts smartart. This is a six stage process. The stages in this process are sales leads, product types, sales revenue, profit margins, repeat sales, web visitors.
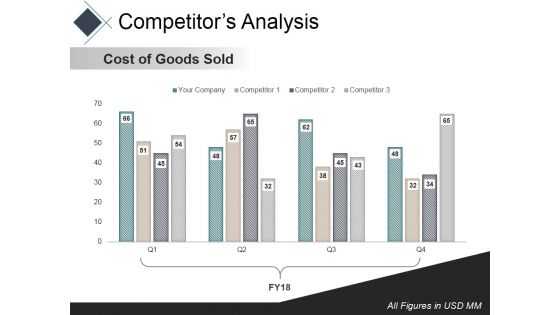
Competitors Analysis Template Ppt PowerPoint Presentation Infographic Template Rules
This is a competitors analysis template ppt powerpoint presentation infographic template rules. This is a four stage process. The stages in this process are net profit margin, finance, marketing, bar, success.
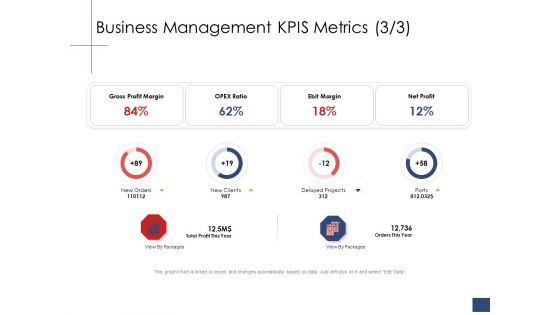
Business Assessment Outline Business Management KPIS Metrics Ratio Ppt Model Layout Ideas PDF
Deliver and pitch your topic in the best possible manner with this business assessment outline business management kpis metrics ratio ppt model layout ideas pdf. Use them to share invaluable insights on gross profit margin, opex ratio, ebit margin, net profit, new orders, delayed projects, new clients and impress your audience. This template can be altered and modified as per your expectations. So, grab it now.
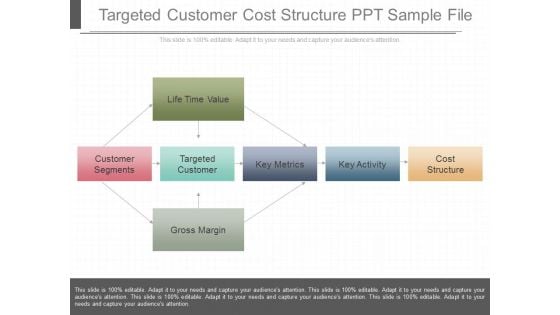
Targeted Customer Cost Structure Ppt Sample File
This is a targeted customer cost structure ppt sample file. This is a seven stage process. The stages in this process are life time value, customer segments, targeted customer, key metrics, key activity, cost structure, gross margin.
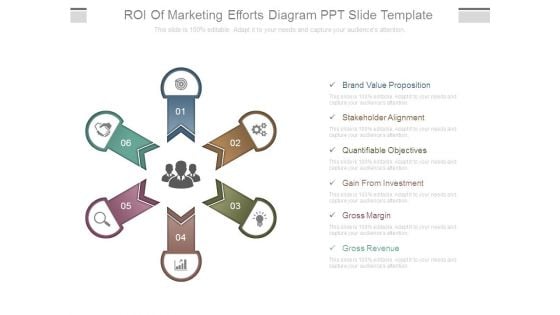
Roi Of Marketing Efforts Diagram Ppt Slide Template
This is a roi of marketing efforts diagram ppt slide template. This is a six stage process. The stages in this process are brand value proposition, stakeholder alignment, quantifiable objectives, gain from investment, gross margin, gross revenue.

Innovations In Networking Technologies For Telecom Sector
This modern and well-arranged Innovations In Networking Technologies For Telecom Sector provides lots of creative possibilities. It is very simple to customize and edit with the Powerpoint Software. Just drag and drop your pictures into the shapes. All facets of this template can be edited with Powerpoint, no extra software is necessary. Add your own material, put your images in the places assigned for them, adjust the colors, and then you can show your slides to the world, with an animated slide included. This slide highlights networking technology advancements for telecom sector. The purpose of this template is to assist professionals in expanding connectivity by improving network speed and reliability. It includes elements such as cloud computing, edge computing, communication models, etc.
Performance Evaluation Sales And Profit Tracking Report Ideas Pdf
This slide illustrate tables that helps in tracking performance of product and also track profit margin. It includes elements such as item code, item name, quantity , total cost, total sales, gross profit and profit margin. Showcasing this set of slides titled Performance Evaluation Sales And Profit Tracking Report Ideas Pdf The topics addressed in these templates are Product Performance Dashboard, Total Sales, Gross Profit All the content presented in this PPT design is completely editable. Download it and make adjustments in color, background, font etc. as per your unique business setting. This slide illustrate tables that helps in tracking performance of product and also track profit margin. It includes elements such as item code, item name, quantity , total cost, total sales, gross profit and profit margin.
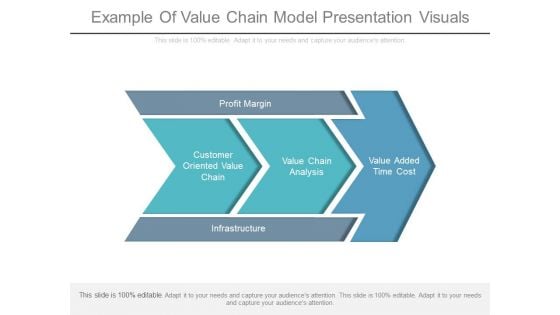
Example Of Value Chain Model Presentation Visuals
This is a example of value chain model presentation visuals. This is a five stage process. The stages in this process are profit margin, customer oriented value chain, value chain analysis, value added time cost, infrastructure.
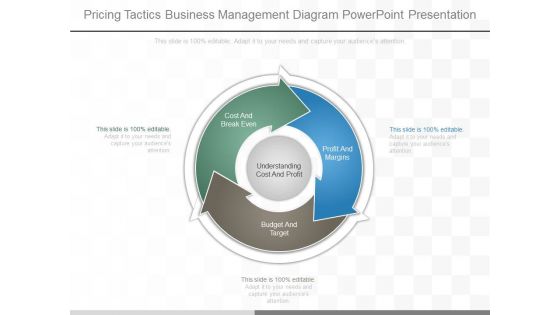
Pricing Tactics Business Management Diagram Powerpoint Presentation
This is a pricing tactics business management diagram powerpoint presentation. This is a three stage process. The stages in this process are understanding cost and profit, cost and break even, profit and margins, budget and target.
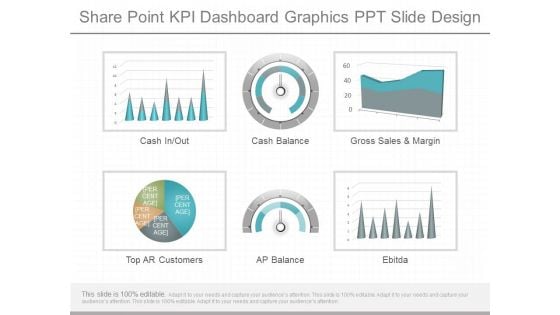
Share Point Kpi Dashboard Graphics Ppt Slide Design
This is a share point kpi dashboard graphics ppt slide design. This is a six stage process. The stages in this process are cash in out, cash balance, gross sales and margin, top ar customers, ap balance, ebitda.
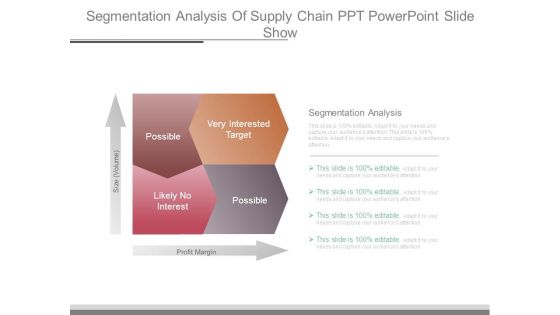
Segmentation Analysis Of Supply Chain Ppt Powerpoint Slide Show
This is a segmentation analysis of supply chain ppt powerpoint slide show. This is a four stage process. The stages in this process are very interested target, possible, likely no interest, possible, profit margin, size volume.
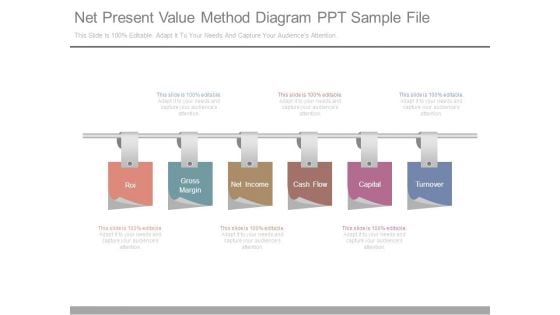
Net Present Value Method Diagram Ppt Sample File
This is a net present value method diagram ppt sample file. This is a six stage process. The stages in this process are roi, gross margin, net income, cash flow, capital, turnover.
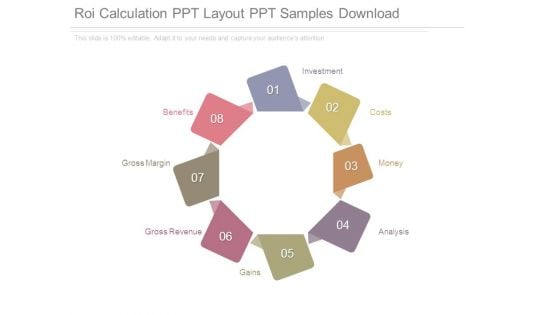
Roi Calculation Ppt Layout Ppt Samples Download
This is a roi calculation ppt layout ppt samples download. This is a eight stage process. The stages in this process are investment, costs, money, analysis, gains, gross revenue, gross margin, benefits.
Marketing Roi Analysis Template Powerpoint Slide Presentation Examples
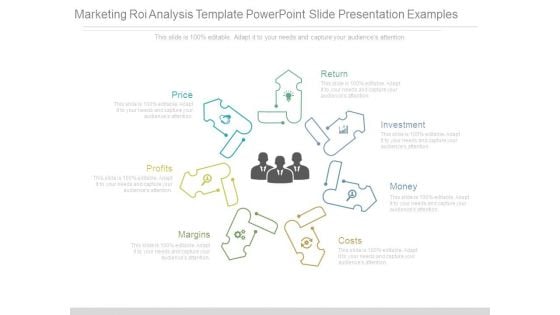
This is a marketing roi analysis template powerpoint slide presentation examples. This is a seven stage process. The stages in this process are return, investment, money, costs, margins, profits, price.
Value Based Pricing Example Example Of Ppt Presentation
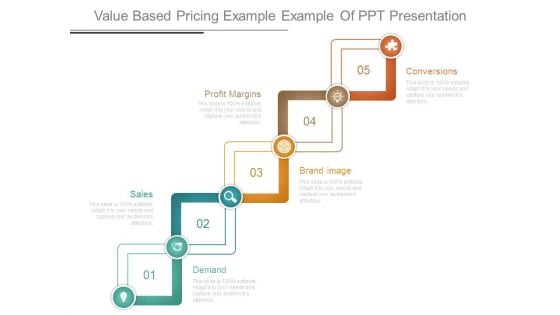
This is a value based pricing example example of ppt presentation. This is a five stage process. The stages in this process are demand, sales, brand image, profit margins, conversions.
Supply Chain Analysis Template Sample Ppt Files
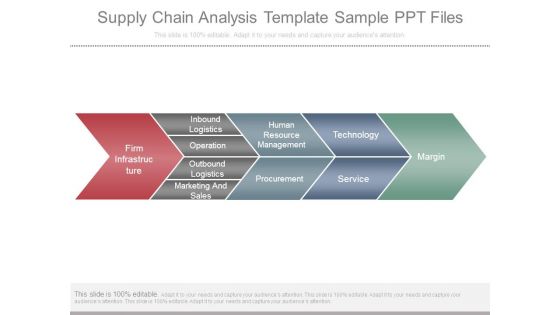
This is a supply chain analysis template sample ppt files. This is a five stage process. The stages in this process are firm infrastructure, inbound logistics, operation, outbound logistics, marketing and sales, human resource management, procurement, technology, service, margin.
Financial Projection Graph Slide2 Ppt PowerPoint Presentation Themes
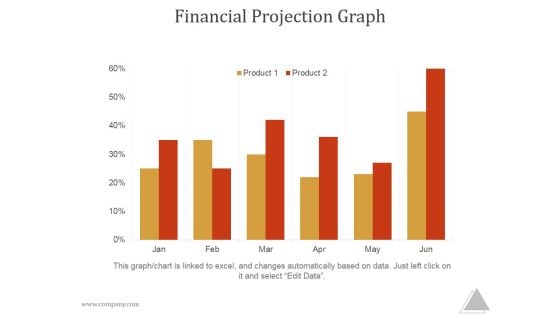
This is a financial projection graph slide2 ppt powerpoint presentation themes. This is a five stage process. The stages in this process are year, total sales, gross, margin, net income

Financial Projection Graph Template 1 Ppt PowerPoint Presentation Guide
This is a financial projection graph template 1 ppt powerpoint presentation guide. This is a three stage process. The stages in this process are annual sales, gross margin, net profit.
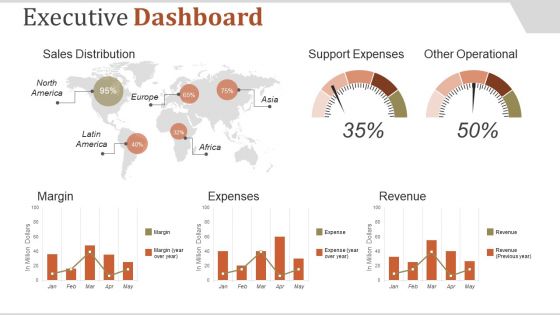
Executive Dashboard Ppt PowerPoint Presentation Introduction
This is a executive dashboard ppt powerpoint presentation introduction. This is a five stage process. The stages in this process are sales distribution, support expenses, other operational, margin, expenses.
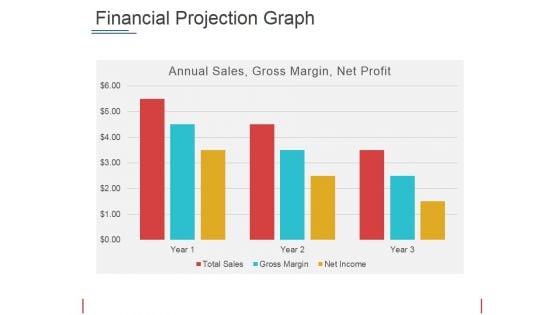
Financial Projection Graph Template 2 Ppt PowerPoint Presentation Show Picture
This is a financial projection graph template 2 ppt powerpoint presentation show picture. This is a three stage process. The stages in this process are annual sales, gross margin, net profit, years.
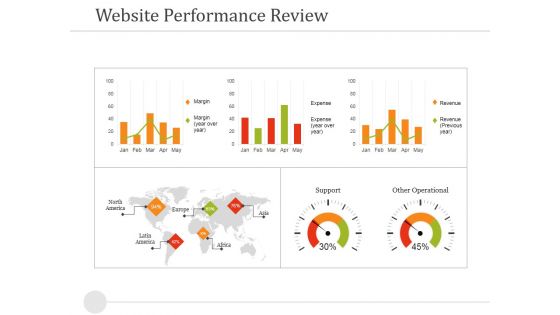
Website Performance Review Template 2 Ppt PowerPoint Presentation Gallery Objects
This is a website performance review template 2 ppt powerpoint presentation gallery objects. This is a three stage process. The stages in this process are margin, revenue, expense, support, other operational.
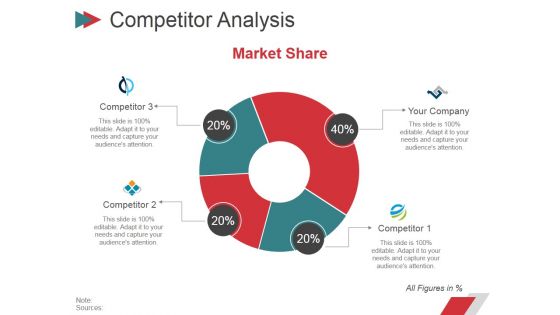
Competitor Analysis Template Ppt PowerPoint Presentation Pictures Graphics Template
This is a competitor analysis template ppt powerpoint presentation pictures graphics template. This is a four stage process. The stages in this process are business, strategy, marketing, planning, net profit margin.
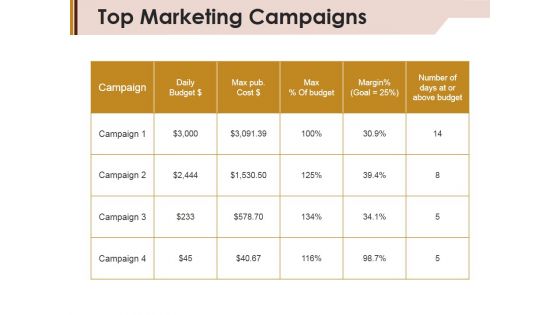
Top Marketing Campaigns Ppt PowerPoint Presentation Inspiration Structure
This is a top marketing campaigns ppt powerpoint presentation inspiration structure. This is a four stage process. The stages in this process are campaign, daily budget, margin, max percentage of budget.
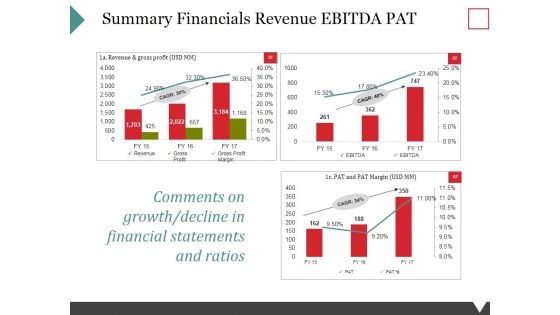
Summary Financials Revenue Ebitda Pat Ppt PowerPoint Presentation Ideas Files
This is a summary financials revenue ebitda pat ppt powerpoint presentation ideas files. This is a three stage process. The stages in this process are revenue, gross profit, gross profit margin.
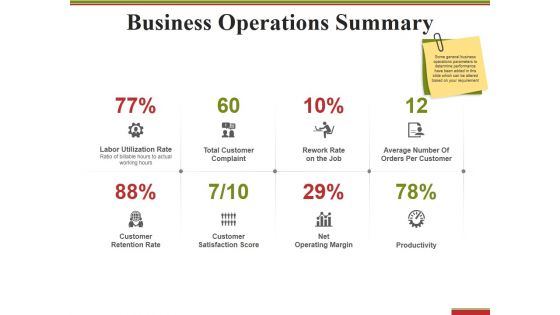
Business Operations Summary Ppt PowerPoint Presentation Model Graphics Template
This is a business operations summary ppt powerpoint presentation model graphics template. This is a eight stage process. The stages in this process are net operating margin, productivity customer, retention rate.
Industry Cost Structure Template 1 Ppt PowerPoint Presentation Icon Layout
This is a industry cost structure template 1 ppt powerpoint presentation icon layout. This is a two stage process. The stages in this process are power and fuel cost, material cost, employee cost, interest and finance costs, operating profit margins.
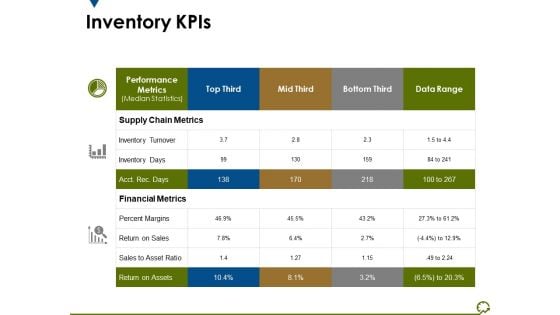
Inventory Kpis Ppt PowerPoint Presentation Infographic Template Display
This is a inventory kpis ppt powerpoint presentation infographic template display. This is a three stage process. The stages in this process are supply chain metrics, financial metrics, percent margins, return on assets, inventory turnover.


 Continue with Email

 Home
Home


