Market Entry Plan
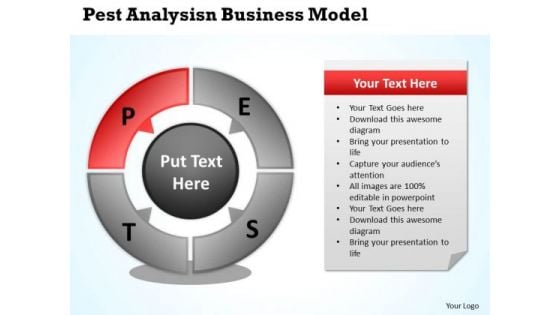
Business Process Management Diagram Pest Analysis Model PowerPoint Slides
We present our business process management diagram pest analysis model PowerPoint Slides.Present our Advertising PowerPoint Templates because They will Put the wind in your sails. Skim smoothly over the choppy waters of the market. Use our Business PowerPoint Templates because Our PowerPoint Templates and Slides will provide weight to your words. They will bring out the depth of your thought process. Use our Shapes PowerPoint Templates because Our PowerPoint Templates and Slides will provide you the cutting edge. Slice through the doubts in the minds of your listeners. Download and present our Process and Flows PowerPoint Templates because Our PowerPoint Templates and Slides are topically designed to provide an attractive backdrop to any subject. Download and present our Metaphors-Visual Concepts PowerPoint Templates because Our PowerPoint Templates and Slides help you meet the demand of the Market. Just browse and pick the slides that appeal to your intuitive senses.Use these PowerPoint slides for presentations relating to Act, arrow, business, chart, check, circle, circular, cycle, deming, development, diagram, do, engineering, flow, flow-chart, flowchart, graphic, infographic, iterative, life, life-cycle, lifecycle, management, model, pdca, pdsa, plan, process, quality, red, software, step, strategy, work, work-flow, workflow\n. The prominent colors used in the PowerPoint template are Yellow, Black, Gray. The feedback we get is that our business process management diagram pest analysis model PowerPoint Slides are second to none. The feedback we get is that our chart PowerPoint templates and PPT Slides will help them to explain complicated concepts. Professionals tell us our business process management diagram pest analysis model PowerPoint Slides are aesthetically designed to attract attention. We guarantee that they will grab all the eyeballs you need. Professionals tell us our circular PowerPoint templates and PPT Slides look good visually. Presenters tell us our business process management diagram pest analysis model PowerPoint Slides will impress their bosses and teams. You can be sure our deming PowerPoint templates and PPT Slides are designed by a team of presentation professionals. Create a consensus with your thoughts. Erase differences with our Business Process Management Diagram Pest Analysis Model PowerPoint Slides.
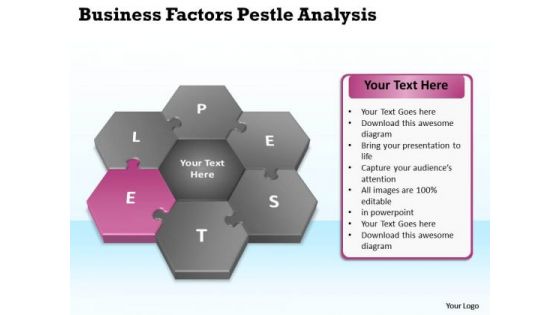
Business Process Flow Diagrams Pestlel Analysis Model PowerPoint Templates
We present our business process flow diagrams pestlel analysis model PowerPoint templates.Download our Advertising PowerPoint Templates because Our PowerPoint Templates and Slides provide you with a vast range of viable options. Select the appropriate ones and just fill in your text. Present our Hexagon PowerPoint Templates because You are working at that stage with an air of royalty. Let our PowerPoint Templates and Slides be the jewels in your crown. Download and present our Business PowerPoint Templates because Our PowerPoint Templates and Slides come in all colours, shades and hues. They help highlight every nuance of your views. Download our Shapes PowerPoint Templates because Our PowerPoint Templates and Slides help you meet the demand of the Market. Just browse and pick the slides that appeal to your intuitive senses. Download and present our Process and Flows PowerPoint Templates because Our PowerPoint Templates and Slides are aesthetically designed to attract attention. We gaurantee that they will grab all the eyeballs you need.Use these PowerPoint slides for presentations relating to Action, business, chart, circles, clipart, concept, corporate, design, diagram, goals, guide, guidelines, icon, idea, illustration, management, marketing, mba, model, opportunity, organization, performance, plans, process, project, representation, resource, round, strategy, success, swot, theory, tool, vision. The prominent colors used in the PowerPoint template are Gray, Black, Blue. The feedback we get is that our business process flow diagrams pestlel analysis model PowerPoint templates are incredible easy to use. The feedback we get is that our clipart PowerPoint templates and PPT Slides will help you be quick off the draw. Just enter your specific text and see your points hit home. Professionals tell us our business process flow diagrams pestlel analysis model PowerPoint templates are specially created by a professional team with vast experience. They diligently strive to come up with the right vehicle for your brilliant Ideas. Professionals tell us our design PowerPoint templates and PPT Slides will generate and maintain the level of interest you desire. They will create the impression you want to imprint on your audience. Presenters tell us our business process flow diagrams pestlel analysis model PowerPoint templates will make the presenter look like a pro even if they are not computer savvy. You can be sure our clipart PowerPoint templates and PPT Slides have awesome images to get your point across. End all differences with our Business Process Flow Diagrams Pestlel Analysis Model PowerPoint Templates. They encourage achieving consensus.
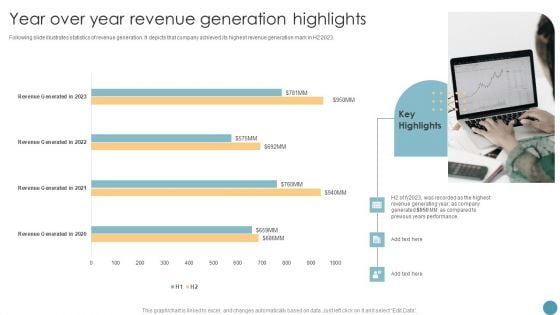
Feasibility Analysis Report For Construction Project Year Over Year Revenue Generation Highlights Portrait PDF
Following slide illustrates statistics of revenue generation. It depicts that company achieved its highest revenue generation mark in H2 2023. Presenting this PowerPoint presentation, titled Feasibility Analysis Report For Construction Project Year Over Year Revenue Generation Highlights Portrait PDF, with topics curated by our researchers after extensive research. This editable presentation is available for immediate download and provides attractive features when used. Download now and captivate your audience. Presenting this Feasibility Analysis Report For Construction Project Year Over Year Revenue Generation Highlights Portrait PDF. Our researchers have carefully researched and created these slides with all aspects taken into consideration. This is a completely customizable Feasibility Analysis Report For Construction Project Year Over Year Revenue Generation Highlights Portrait PDF that is available for immediate downloading. Download now and make an impact on your audience. Highlight the attractive features available with our PPTs.
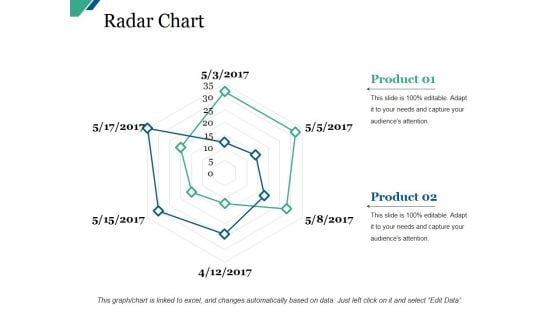
Radar Chart Ppt PowerPoint Presentation Styles Layout Ideas
This is a radar chart ppt powerpoint presentation styles layout ideas. This is a two stage process. The stages in this process are business, marketing, graph, finance, analysis.
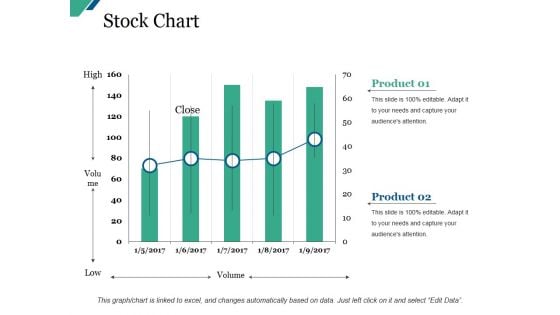
Stock Chart Ppt PowerPoint Presentation Inspiration Background Image
This is a stock chart ppt powerpoint presentation inspiration background image. This is a five stage process. The stages in this process are business, marketing, graph, finance, analysis.
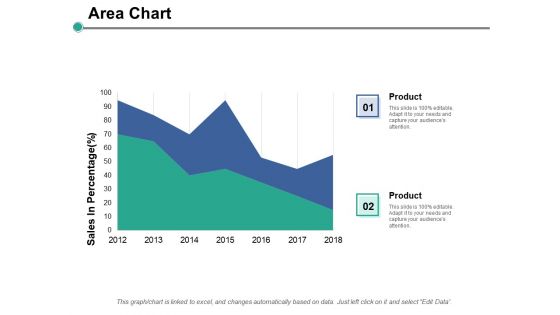
Area Chart Finance Ppt PowerPoint Presentation Gallery Elements
This is a area chart finance ppt powerpoint presentation gallery elements. This is a two stage process. The stages in this process are finance, marketing, management, investment, analysis.
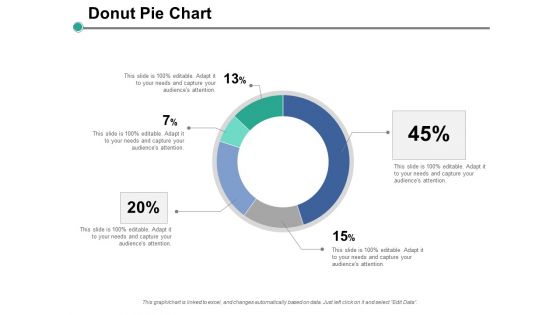
Donut Pie Chart Ppt PowerPoint Presentation Layouts Backgrounds
This is a donut pie chart ppt powerpoint presentation layouts backgrounds. This is a five stage process. The stages in this process are finance, marketing, management, investment, analysis.
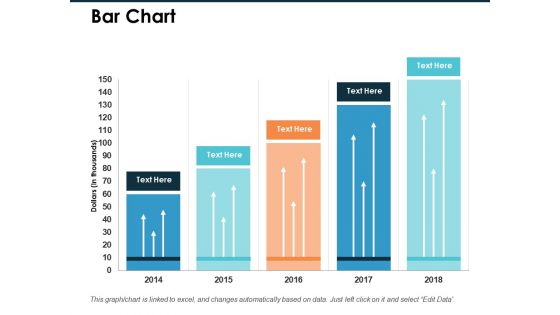
Bar Chart Financial Ppt PowerPoint Presentation Pictures Files
This is a bar chart financial ppt powerpoint presentation pictures files. This is a five stage process. The stages in this process are finance, marketing, management, investment, analysis.
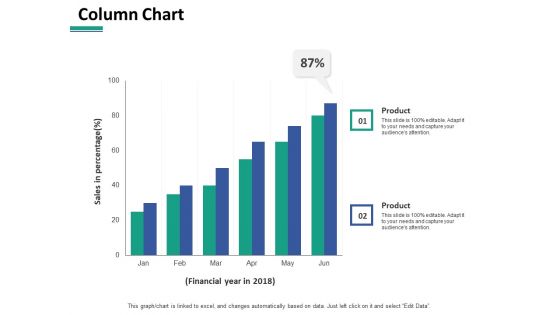
Column Chart Ppt PowerPoint Presentation Slides Example Topics
This is a column chart ppt powerpoint presentation slides example topics. This is a two stage process. The stages in this process are finance, marketing, management, investment, analysis.
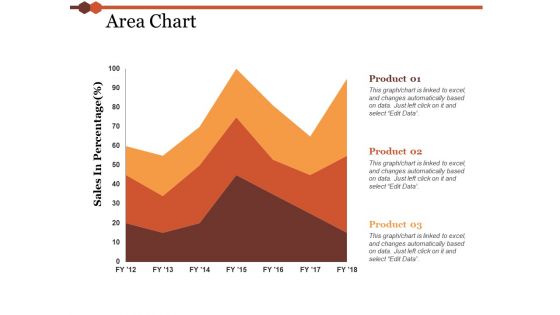
Area Chart Financial Ppt PowerPoint Presentation Layouts Slide
This is a area chart financial ppt powerpoint presentation layouts slide. This is a three stage process. The stages in this process are finance, marketing, management, investment, analysis.
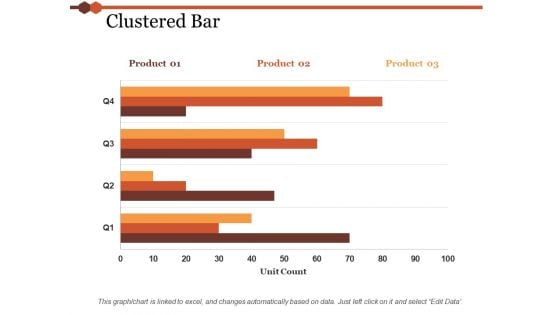
Clustered Bar Chart Ppt PowerPoint Presentation Layouts Infographics
This is a clustered bar chart ppt powerpoint presentation layouts infographics. This is a three stage process. The stages in this process are finance, marketing, management, investment, analysis.
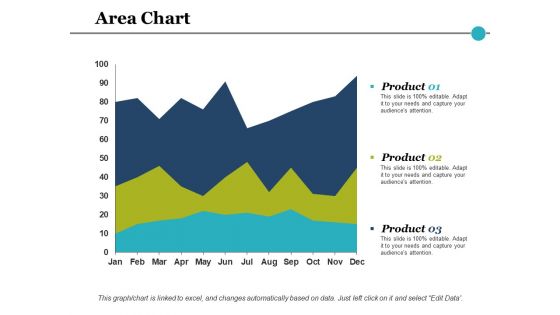
Area Chart Financial Ppt PowerPoint Presentation Inspiration Topics
This is a area chart financial ppt powerpoint presentation inspiration topics. This is a three stage process. The stages in this process are finance, marketing, management, investment, analysis.
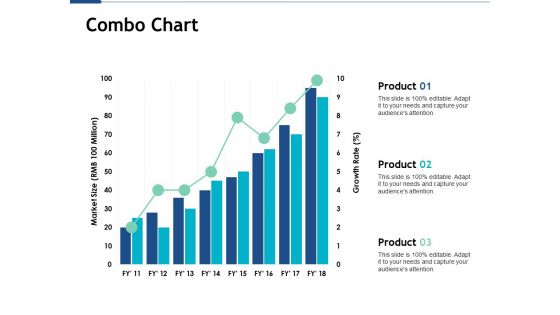
Combo Chart Ppt PowerPoint Presentation Visual Aids Pictures
This is a combo chart ppt powerpoint presentation visual aids pictures. This is a three stage process. The stages in this process are finance, marketing, management, investment, analysis.
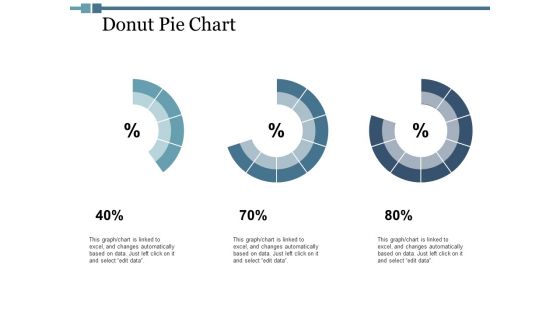
Donut Pie Chart Ppt PowerPoint Presentation Inspiration Brochure
This is a donut pie chart ppt powerpoint presentation inspiration brochure. This is a three stage process. The stages in this process are finance, marketing, management, investment, analysis.
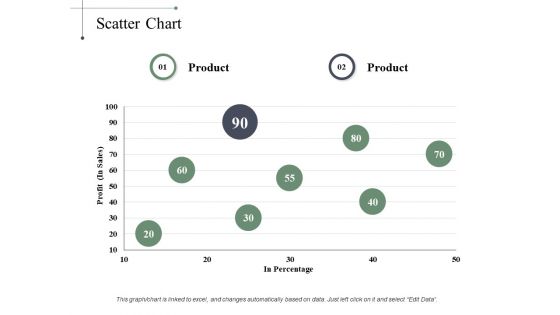
Scatter Chart Finance Ppt PowerPoint Presentation Ideas Show
This is a scatter chart finance ppt powerpoint presentation ideas show. This is a two stage process. The stages in this process are finance, marketing, analysis, business, investment.
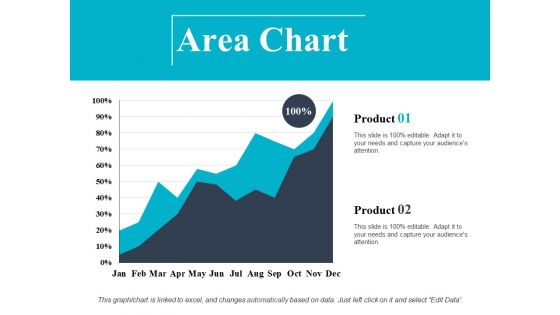
Area Chart Finance Ppt PowerPoint Presentation Slides Layout
This is a area chart finance ppt powerpoint presentation slides layout. This is a two stage process. The stages in this process are finance, marketing, management, investment, analysis.
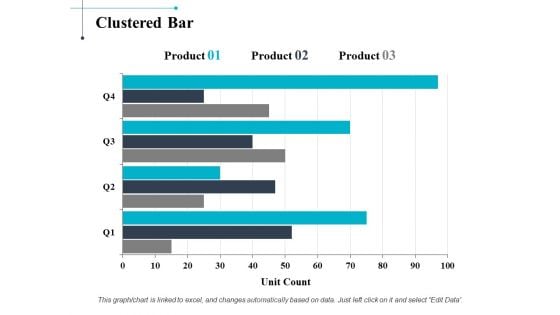
Clustered Bar Chart Ppt PowerPoint Presentation Professional Good
This is a clustered bar chart ppt powerpoint presentation professional good. This is a three stage process. The stages in this process are finance, marketing, management, investment, analysis.
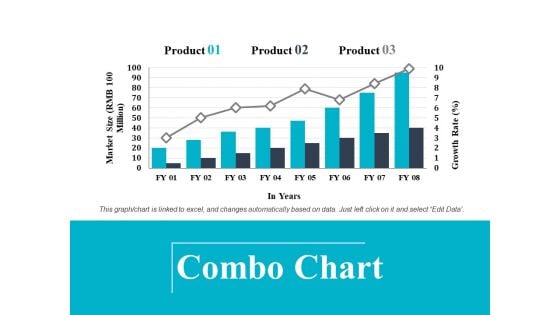
Combo Chart Ppt PowerPoint Presentation Visual Aids Files
This is a combo chart ppt powerpoint presentation visual aids files. This is a three stage process. The stages in this process are finance, marketing, management, investment, analysis.

Area Chart Financial Ppt PowerPoint Presentation Model Background
This is a area chart financial ppt powerpoint presentation model background. This is a two stage process. The stages in this process are finance, marketing, management, investment, analysis.
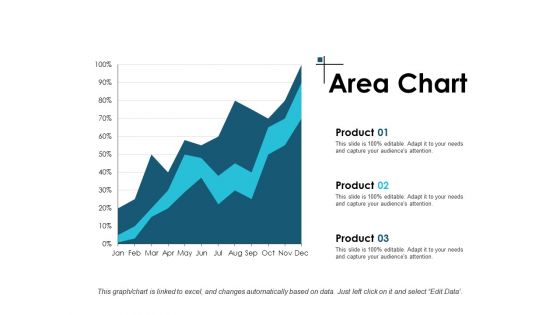
Area Chart Investment Ppt PowerPoint Presentation Infographics Summary
This is a area chart investment ppt powerpoint presentation infographics summary. This is a three stage process. The stages in this process are finance, marketing, management, investment, analysis.
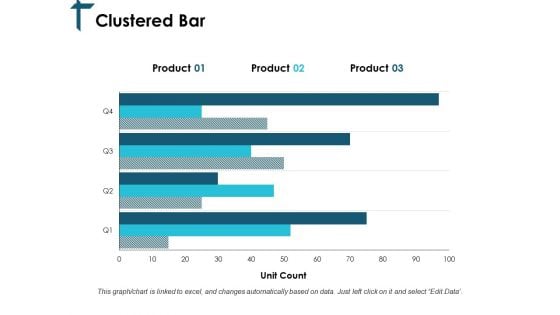
Clustered Bar Chart Ppt PowerPoint Presentation Summary Templates
This is a clustered bar chart ppt powerpoint presentation summary templates. This is a three stage process. The stages in this process are finance, marketing, management, investment, analysis.
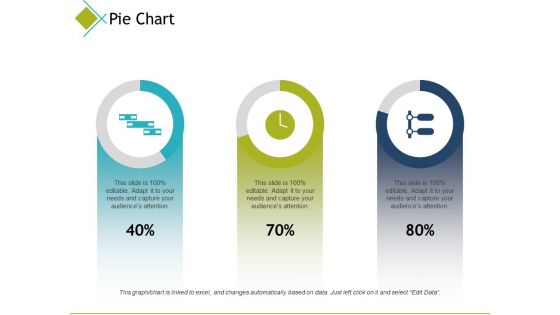
Pie Chart Finance Ppt PowerPoint Presentation Inspiration Introduction
This is a pie chart finance ppt powerpoint presentation inspiration introduction. This is a three stage process. The stages in this process are finance, marketing, analysis, business, investment.
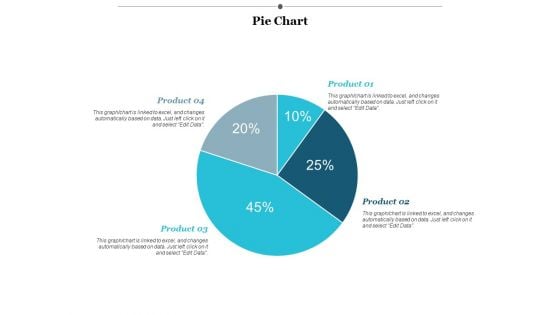
Pie Chart Finance Ppt PowerPoint Presentation Layouts Designs
This is a Pie Chart Finance Ppt PowerPoint Presentation Layouts Designs. This is a four stage process. The stages in this process are finance, marketing, management, investment, analysis.
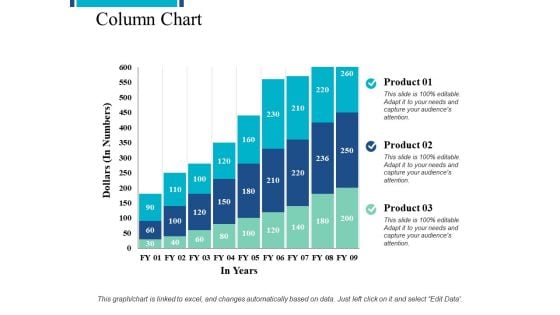
Column Chart Investment Ppt PowerPoint Presentation Show Diagrams
This is a column chart investment ppt powerpoint presentation show diagrams. This is a three stage process. The stages in this process are finance, analysis, business, investment, marketing.
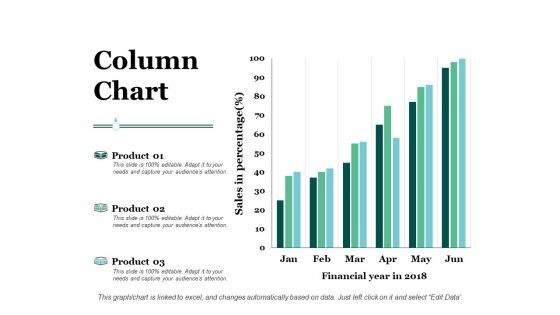
Column Chart Investment Ppt PowerPoint Presentation Professional Pictures
This is a column chart investment ppt powerpoint presentation professional pictures. This is a three stage process. The stages in this process are finance, analysis, business, investment, marketing.
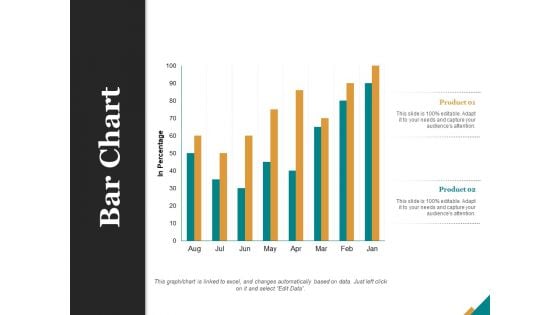
Bar Chart Finance Ppt PowerPoint Presentation Portfolio Model
This is a bar chart finance ppt powerpoint presentation portfolio model. This is a two stage process. The stages in this process are finance, marketing, management, investment, analysis.
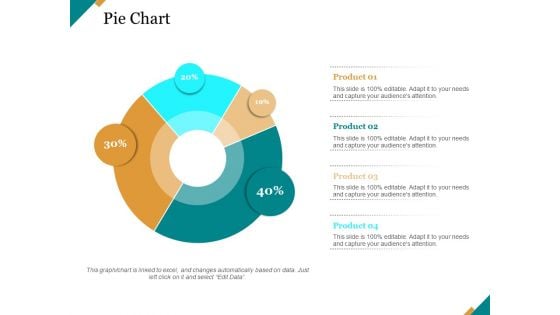
Pie Chart Finance Ppt PowerPoint Presentation Model Ideas
This is a pie chart finance ppt powerpoint presentation model ideas. This is a four stage process. The stages in this process are finance, marketing, management, investment, analysis.
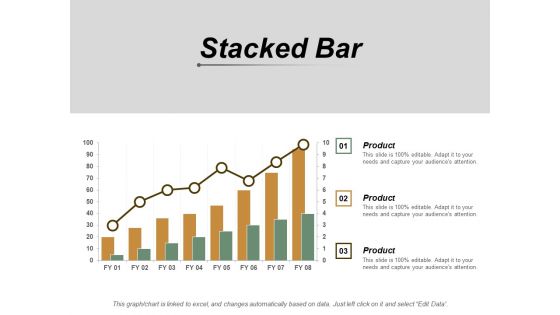
Stacked Bar Chart Ppt PowerPoint Presentation Gallery Outfit
This is a stacked bar chart ppt powerpoint presentation gallery outfit. This is a three stage process. The stages in this process are finance, marketing, management, investment, analysis.
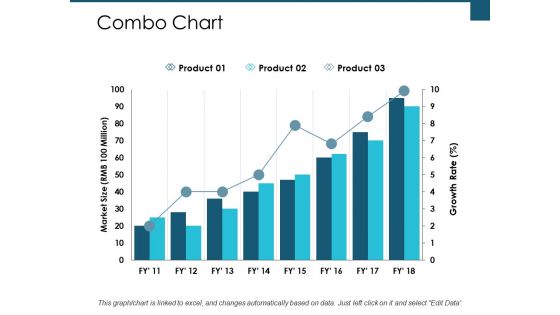
Combo Chart Finance Ppt PowerPoint Presentation Portfolio Templates
This is a combo chart finance ppt powerpoint presentation portfolio templates. This is a three stage process. The stages in this process are finance, analysis, business, investment, marketing.

Area Chart Financial Ppt PowerPoint Presentation Styles Templates
This is a area chart financial ppt powerpoint presentation styles templates. This is a two stage process. The stages in this process are finance, marketing, management, investment, analysis.
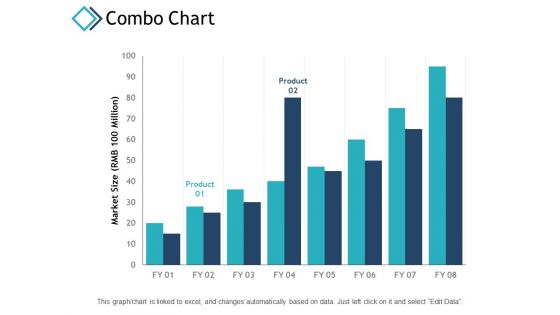
Combo Chart Finance Ppt PowerPoint Presentation Portfolio Gridlines
This is a combo chart finance ppt powerpoint presentation portfolio gridlines. This is a two stage process. The stages in this process are finance, analysis, business, investment, marketing.
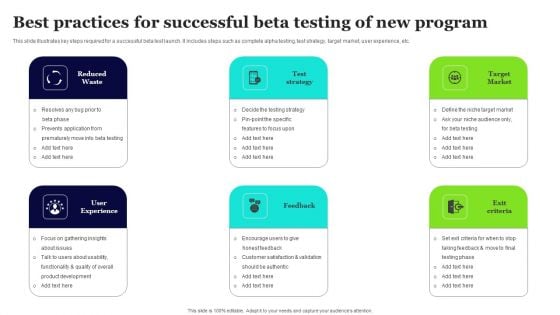
Best Practices For Successful Beta Testing Of New Program Summary PDF
This slide illustrates key steps required for a successful beta test launch. It includes steps such as complete alpha testing, test strategy, target market, user experience, etc. Persuade your audience using this Best Practices For Successful Beta Testing Of New Program Summary PDF. This PPT design covers six stages, thus making it a great tool to use. It also caters to a variety of topics including Reduced Waste, Test Strategy, Target Market. Download this PPT design now to present a convincing pitch that not only emphasizes the topic but also showcases your presentation skills.
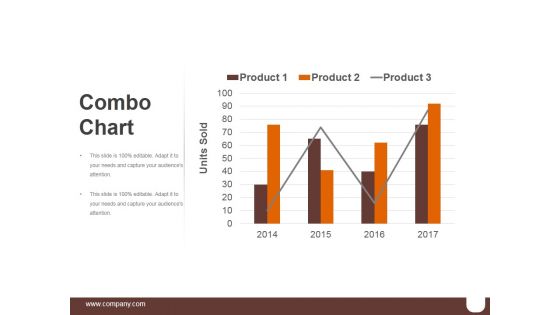
Combo Chart Template 1 Ppt PowerPoint Presentation Themes
This is a combo chart template 1 ppt powerpoint presentation themes. This is a four stage process. The stages in this process are business, marketing, finance, timeline, management.
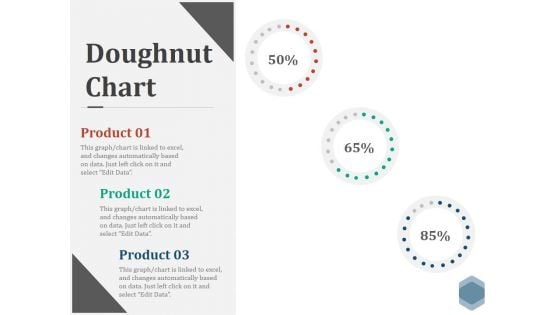
Doughnut Chart Ppt PowerPoint Presentation Visual Aids Files
This is a doughnut chart ppt powerpoint presentation visual aids files. This is a three stage process. The stages in this process are finance, donut, percentage, business, marketing.
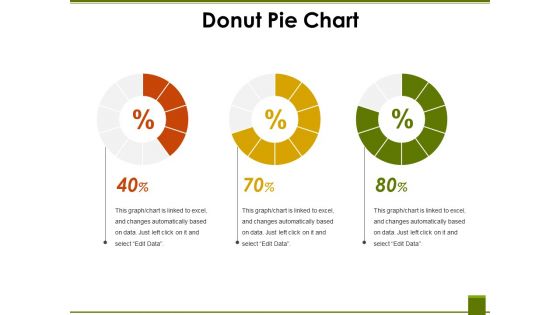
Donut Pie Chart Ppt PowerPoint Presentation File Mockup
This is a donut pie chart ppt powerpoint presentation file mockup. This is a three stage process. The stages in this process are finance, business, percentage, marketing.
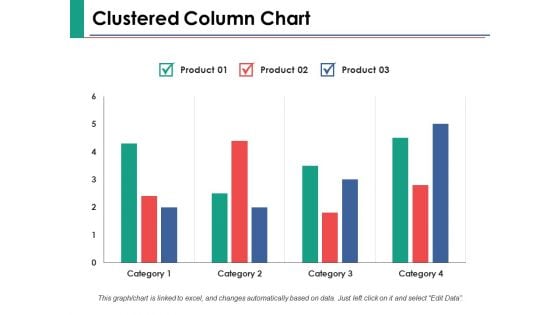
Clustered Column Chart Ppt PowerPoint Presentation Show Samples
This is a clustered column chart ppt powerpoint presentation show samples. This is a three stage process. The stages in this process are finance, marketing, management, investment, analysis.
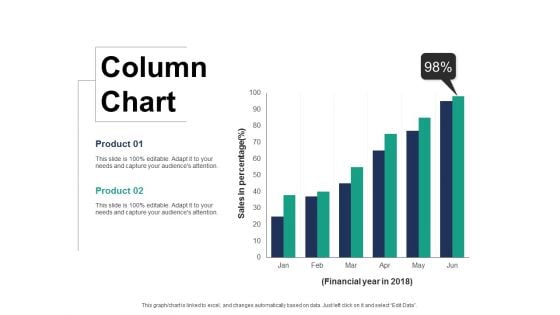
Column Chart Finance Ppt PowerPoint Presentation Layouts Display
This is a column chart finance ppt powerpoint presentation layouts display. This is a two stage process. The stages in this process are finance, marketing, management, investment, analysis.
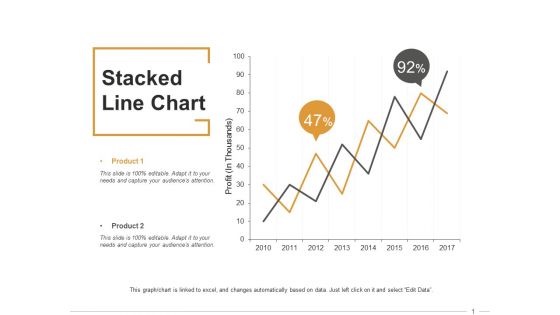
Stacked Line Chart Ppt PowerPoint Presentation Inspiration Format
This is a stacked line chart ppt powerpoint presentation inspiration format. This is a two stage process. The stages in this process are finance, marketing, management, investment, analysis.
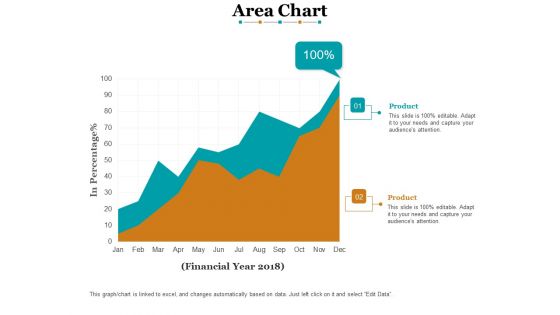
Area Chart Finance Ppt PowerPoint Presentation Model Ideas
This is a area chart finance ppt powerpoint presentation model ideas. This is a two stage process. The stages in this process are finance, marketing, analysis, business, investment.
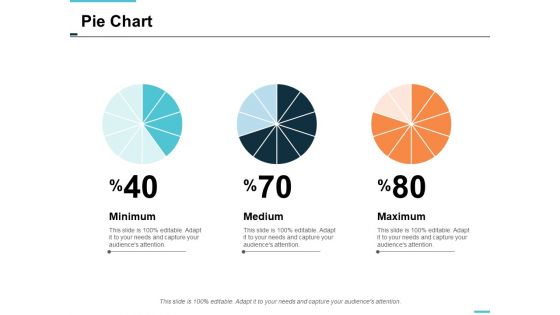
pie chart finance ppt powerpoint presentation styles skills
This is a pie chart finance ppt powerpoint presentation styles skills. This is a three stage process. The stages in this process are finance, marketing, management, investment, analysis.

Combo Chart Finance Ppt PowerPoint Presentation Portfolio Guidelines
This is a combo chart finance ppt powerpoint presentation portfolio guidelines. This is a three stage process. The stages in this process are finance, marketing, management, investment, analysis.
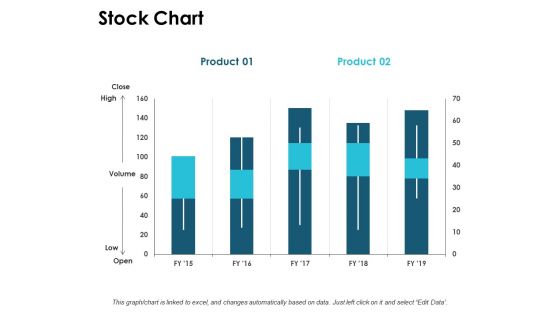
Stock Chart Graph Ppt PowerPoint Presentation Ideas Demonstration
This is a stock chart graph ppt powerpoint presentation ideas demonstration. This is a three stage process. The stages in this process are finance, marketing, management, investment, analysis.
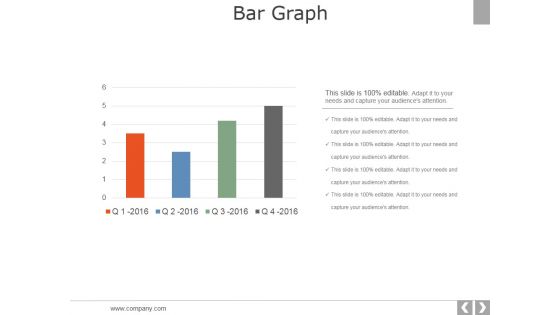
Bar Graph Ppt PowerPoint Presentation Styles Picture
This is a bar graph ppt powerpoint presentation styles picture. This is a four stage process. The stages in this process are business, strategy, marketing, analysis, chart and graph, bar graph.
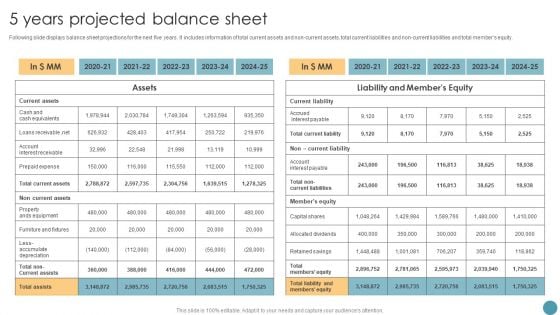
Feasibility Analysis Report For Construction Project 5 Years Projected Balance Sheet Ideas PDF
Following slide displays balance sheet projections for the next five years. It includes information of total current assets and non-current assets, total current liabilities and non-current liabilities and total members equity. If you are looking for a format to display your unique thoughts, then the professionally designed Feasibility Analysis Report For Construction Project 5 Years Projected Balance Sheet Ideas PDF is the one for you. You can use it as a Google Slides template or a PowerPoint template. Incorporate impressive visuals, symbols, images, and other charts. Modify or reorganize the text boxes as you desire. Experiment with shade schemes and font pairings. Alter, share or cooperate with other people on your work. Download Feasibility Analysis Report For Construction Project 5 Years Projected Balance Sheet Ideas PDF and find out how to give a successful presentation. Present a perfect display to your team and make your presentation unforgettable.
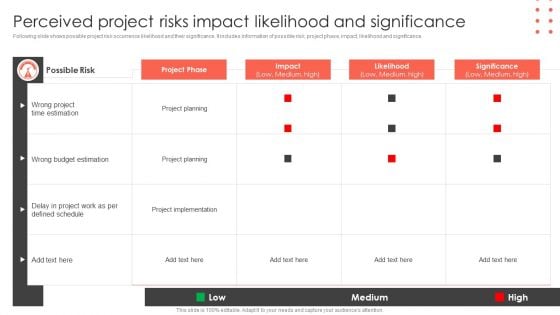
Perceived Project Risks Impact Likelihood And Significance Construct Project Feasibility Analysis Report Sample PDF
Following slide shows possible project risk occurrence likelihood and their significance. It includes information of possible risk, project phase, impact, likelihood and significance. If you are looking for a format to display your unique thoughts, then the professionally designed Perceived Project Risks Impact Likelihood And Significance Construct Project Feasibility Analysis Report Sample PDF is the one for you. You can use it as a Google Slides template or a PowerPoint template. Incorporate impressive visuals, symbols, images, and other charts. Modify or reorganize the text boxes as you desire. Experiment with shade schemes and font pairings. Alter, share or cooperate with other people on your work. Download Perceived Project Risks Impact Likelihood And Significance Construct Project Feasibility Analysis Report Sample PDF and find out how to give a successful presentation. Present a perfect display to your team and make your presentation unforgettable.
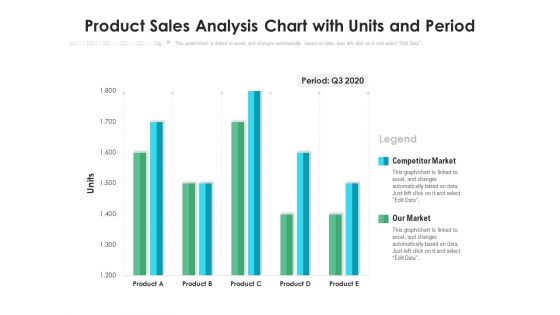
Product Sales Analysis Chart With Units And Period Ppt PowerPoint Presentation Layouts Brochure PDF
Presenting this set of slides with name product sales analysis chart with units and period ppt powerpoint presentation layouts brochure pdf. The topics discussed in these slides are competitor market, our market, period q3 2020. This is a completely editable PowerPoint presentation and is available for immediate download. Download now and impress your audience.

Staked Line With Markers Ppt PowerPoint Presentation Microsoft
This is a staked line with markers ppt powerpoint presentation microsoft. This is a one stage process. The stages in this process are staked line, marketing, strategy, analysis, business.
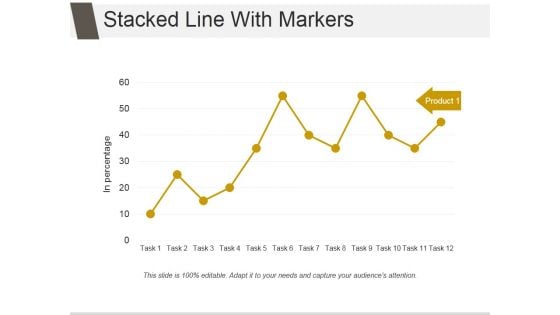
Stacked Line With Markers Ppt PowerPoint Presentation Rules
This is a stacked line with markers ppt powerpoint presentation rules. This is a twelve stage process. The stages in this process are business, strategy, analysis, marketing, finance, growth.
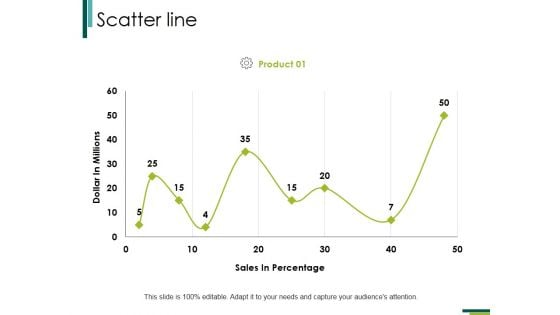
Scatter Line Ppt PowerPoint Presentation Portfolio Summary
This is a scatter line ppt powerpoint presentation portfolio summary. This is a one stage process. The stages in this process are scatter line, growth, marketing, analysis, strategy, business.
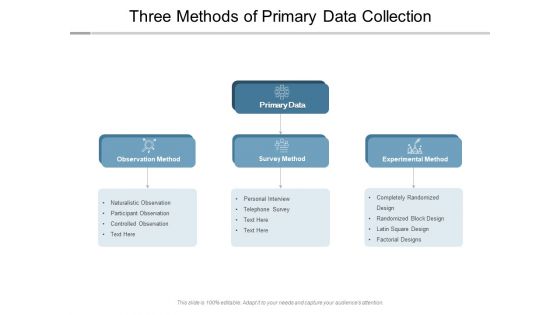
Three Methods Of Primary Data Collection Ppt PowerPoint Presentation Infographics Graphics Design
Presenting this set of slides with name three methods of primary data collection ppt powerpoint presentation infographics graphics design. The topics discussed in these slides are data sources, database management, marketing. This is a completely editable PowerPoint presentation and is available for immediate download. Download now and impress your audience.
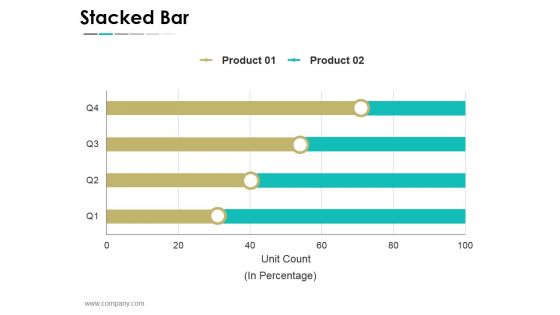
Stacked Bar Ppt PowerPoint Presentation Infographics Graphics
This is a stacked bar ppt powerpoint presentation infographics graphics. This is a four stage process. The stages in this process are business, strategy, marketing, success, unit count, in percentage.
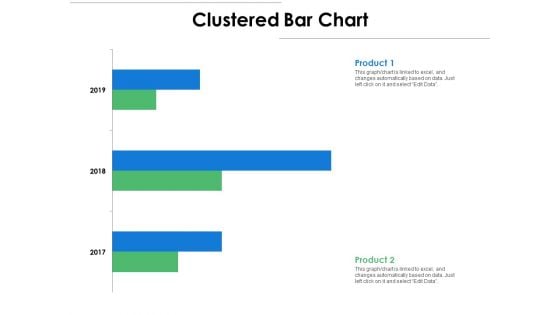
Clustered Bar Chart Analysis Ppt PowerPoint Presentation Outline Example
Presenting this set of slides with name clustered bar chart analysis ppt powerpoint presentation outline example. The topics discussed in these slides are finance, marketing, management, investment, analysis. This is a completely editable PowerPoint presentation and is available for immediate download. Download now and impress your audience.
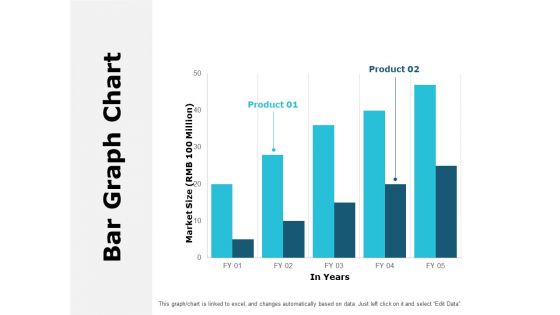
Bar Graph Chart Analysis Ppt PowerPoint Presentation Outline Good
Presenting this set of slides with name bar graph chart analysis ppt powerpoint presentation outline good. The topics discussed in these slides are finance, marketing, management, investment, analysis. This is a completely editable PowerPoint presentation and is available for immediate download. Download now and impress your audience.
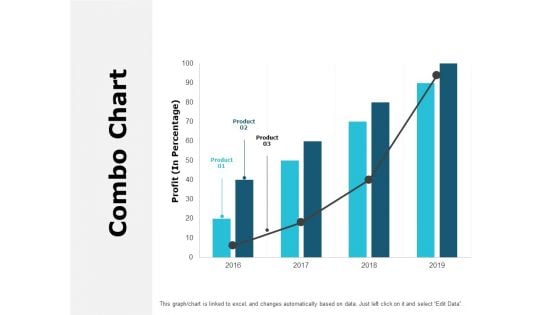
Combo Chart Analysis Ppt PowerPoint Presentation Outline Design Ideas
Presenting this set of slides with name combo chart analysis ppt powerpoint presentation outline design ideas. The topics discussed in these slides are finance, marketing, management, investment, analysis. This is a completely editable PowerPoint presentation and is available for immediate download. Download now and impress your audience.
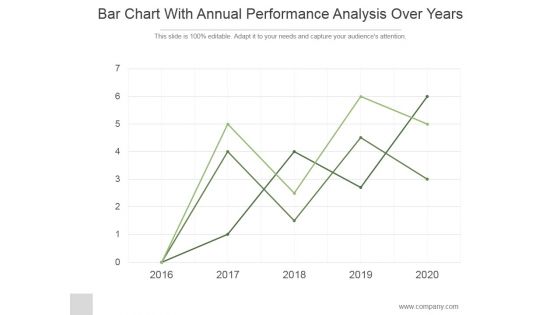
Bar Chart With Annual Performance Analysis Over Years Ppt PowerPoint Presentation Design Ideas
This is a bar chart with annual performance analysis over years ppt powerpoint presentation design ideas. This is a five stage process. The stages in this process are business, strategy, marketing, analysis, line graph.
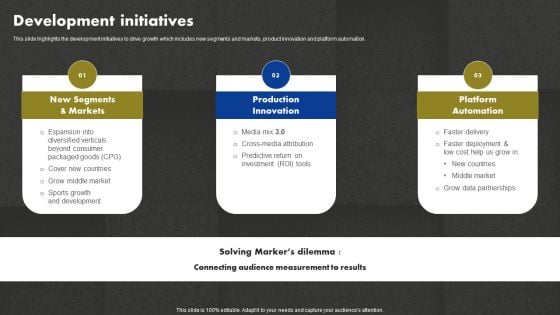
Data And Customer Analysis Company Outline Development Initiatives Pictures PDF
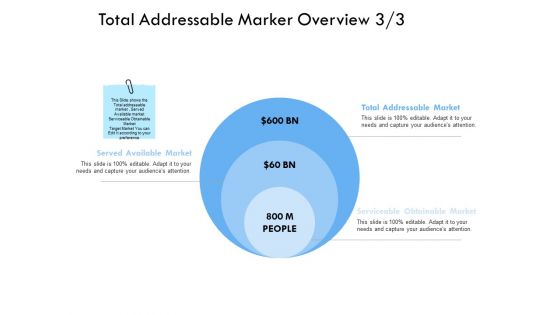
Total Addressable Marker Overview Attention Ppt PowerPoint Presentation Show
Presenting this set of slides with name total addressable marker overview attention ppt powerpoint presentation show. This is a three stage process. The stages in this process are stacked bar, finance, marketing, analysis, investment. This is a completely editable PowerPoint presentation and is available for immediate download. Download now and impress your audience.
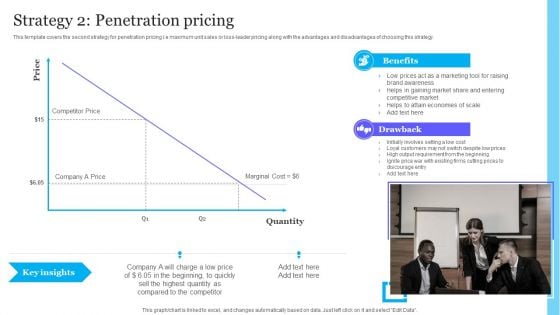
Complete Guide To Product Pricing Techniques Strategy 2 Penetration Pricing Summary PDF
This template covers the second strategy for penetration pricing i.e maximum unit sales or loss leader pricing along with the advantages and disadvantages of choosing this strategy. This Complete Guide To Product Pricing Techniques Strategy 2 Penetration Pricing Summary PDF is perfect for any presentation, be it in front of clients or colleagues. It is a versatile and stylish solution for organizing your meetings. The Complete Guide To Product Pricing Techniques Strategy 2 Penetration Pricing Summary PDF features a modern design for your presentation meetings. The adjustable and customizable slides provide unlimited possibilities for acing up your presentation. Slidegeeks has done all the homework before launching the product for you. So, do not wait, grab the presentation templates today.
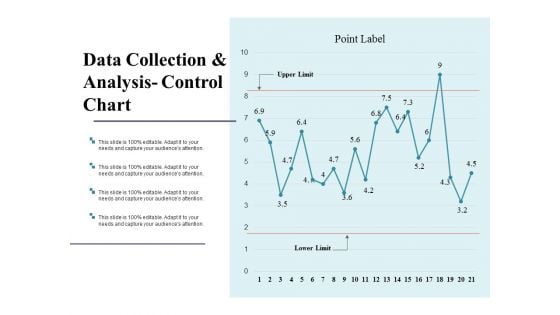
Data Collection And Analysis Control Chart Ppt PowerPoint Presentation Model Backgrounds
This is a data collection and analysis control chart ppt powerpoint presentation model backgrounds. This is a two stage process. The stages in this process are business, marketing, strategy, finance, analysis.
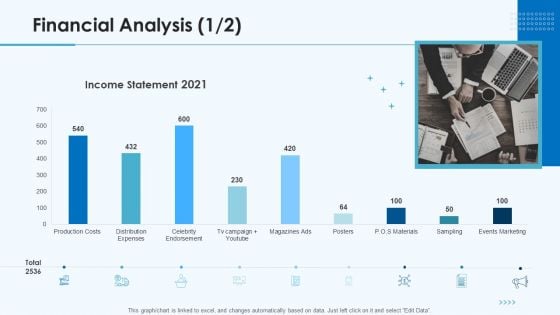
Product Pricing Strategies Financial Analysis Costs Ppt Styles Templates PDF
Deliver an awe inspiring pitch with this creative product pricing strategies financial analysis costs ppt styles templates pdf bundle. Topics like marketing, expenses, costs, material, campaign can be discussed with this completely editable template. It is available for immediate download depending on the needs and requirements of the user.


 Continue with Email

 Home
Home


