Market Entry
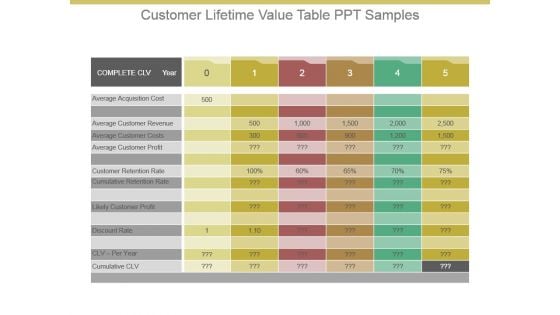
Customer Lifetime Value Table Ppt Samples
This is a customer lifetime value table ppt samples. This is a five stage process. The stages in this process are complete clv year, average acquisition cost, average customer revenue, average customer costs, average customer profit, customer retention rate, likely customer profit, discount rate, clv per year, cumulative clv, cumulative retention rate.
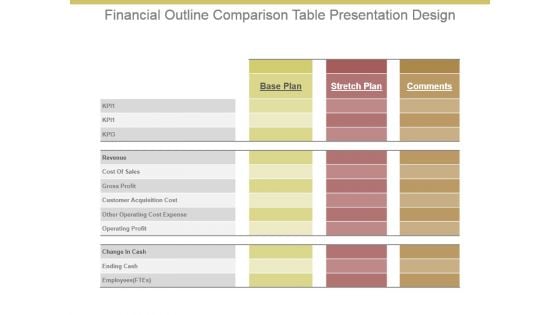
Financial Outline Comparison Table Presentation Design
This is a financial outline comparison table presentation design. This is a three stage process. The stages in this process are base plan, stretch plan, comments, kp, revenue, cost of sales, gross profit, customer acquisition cost, other operating cost expense, operating profit, change in cash, ending cash, employees ftes.
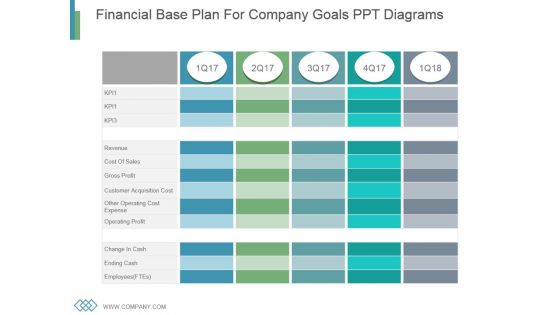
Financial Base Plan For Company Goals Ppt Diagrams
This is a financial base plan for company goals ppt diagrams. This is a five stage process. The stages in this process are revenue, cost of sales, gross profit, customer acquisition cost, other operating cost expense, operating profit, change in cash, ending cash, employees.
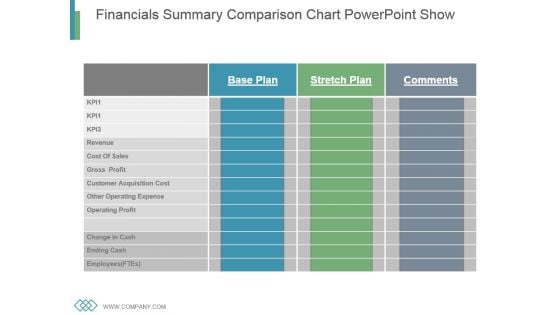
Financials Summary Comparison Chart Powerpoint Show
This is a financials summary comparison chart powerpoint show. This is a three stage process. The stages in this process are revenue, cost of sales, gross profit, customer acquisition cost, other operating cost expense, operating profit, change in cash, ending cash, employees.
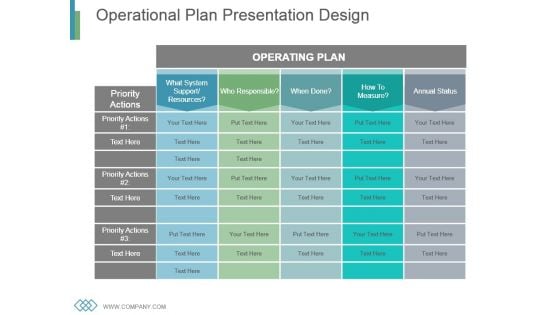
Operational Plan Presentation Design
This is a operational plan presentation design. This is a five stage process. The stages in this process are what system support resources, who responsible, when done, how, how to measure, annual status.
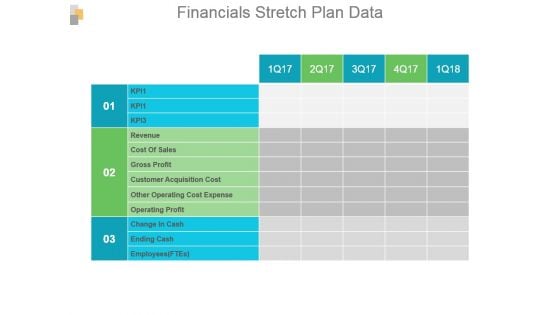
Financials Stretch Plan Data Powerpoint Slide Backgrounds
This is a financials stretch plan data powerpoint slide backgrounds. This is a three stage process. The stages in this process are employees, ending cash, change in cash, operating profit, other operating cost expense, customer acquisition cost, gross profit, cost of sales, revenue.
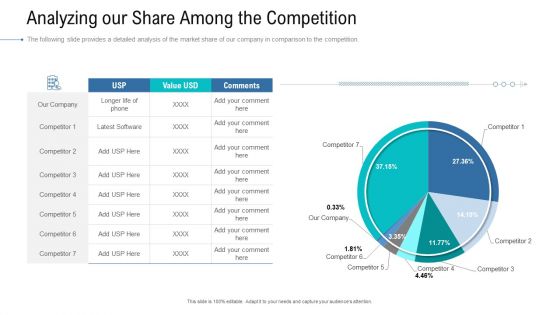
Organizational Development And Promotional Plan Analyzing Our Share Among The Competition Professional PDF
The following slide provides a detailed analysis of the market share of our company in comparison to the competition. Deliver an awe inspiring pitch with this creative organizational development and promotional plan analyzing our share among the competition professional pdf bundle. Topics like analyzing our share among the competition can be discussed with this completely editable template. It is available for immediate download depending on the needs and requirements of the user.
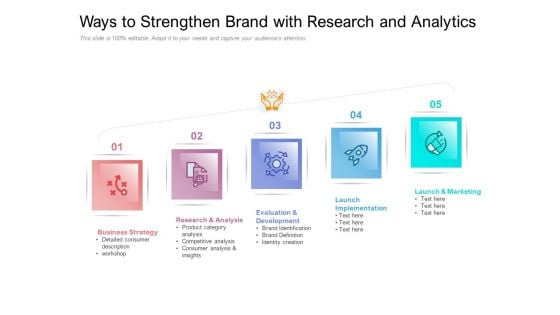
Ways To Strengthen Brand With Research And Analytics Ppt PowerPoint Presentation File Styles PDF
Presenting this set of slides with name ways to strengthen brand with research and analytics ppt powerpoint presentation file styles pdf. This is a five stage process. The stages in this process are strategy, analysis, development. This is a completely editable PowerPoint presentation and is available for immediate download. Download now and impress your audience.
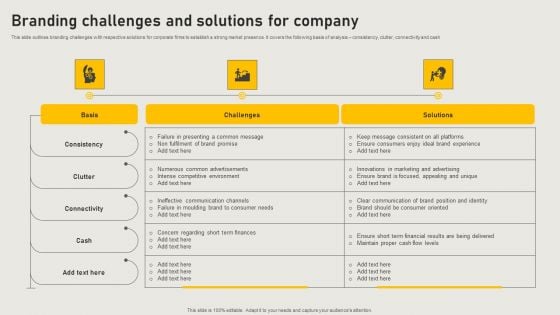
Branding Challenges And Solutions For Company Professional PDF
This slide outlines branding challenges with respective solutions for corporate firms to establish a strong market presence. It covers the following basis of analysis consistency, clutter, connectivity and cash. Showcasing this set of slides titled Branding Challenges And Solutions For Company Professional PDF. The topics addressed in these templates are Consistency, Connectivity, Communication. All the content presented in this PPT design is completely editable. Download it and make adjustments in color, background, font etc. as per your unique business setting.

Table Of Contents Brand Techniques Structure Summary PDF
This is a table of contents brand techniques structure summary pdf template with various stages. Focus and dispense information on six stages using this creative set, that comes with editable features. It contains large content boxes to add your information on topics like analysis, goals, strategy, development, market share. You can also showcase facts, figures, and other relevant content using this PPT layout. Grab it now.
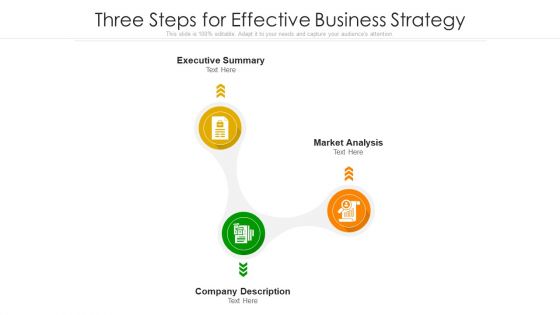
Three Steps For Effective Business Strategy Ppt PowerPoint Presentation Gallery Master Slide PDF
Persuade your audience using this three steps for effective business strategy ppt powerpoint presentation gallery master slide pdf. This PPT design covers three stages, thus making it a great tool to use. It also caters to a variety of topics including executive summary, market analysis, company description. Download this PPT design now to present a convincing pitch that not only emphasizes the topic but also showcases your presentation skills.
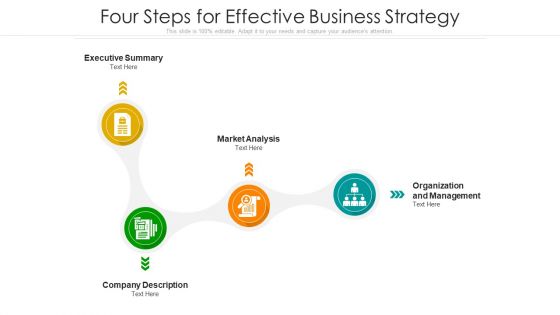
Four Steps For Effective Business Strategy Ppt PowerPoint Presentation File Example Introduction PDF
Persuade your audience using this four steps for effective business strategy ppt powerpoint presentation file example introduction pdf. This PPT design covers four stages, thus making it a great tool to use. It also caters to a variety of topics including executive summary, market analysis, company description. Download this PPT design now to present a convincing pitch that not only emphasizes the topic but also showcases your presentation skills.
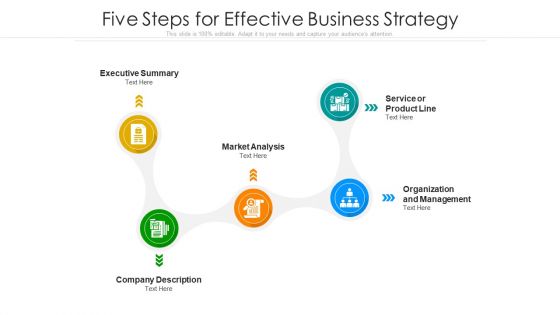
Five Steps For Effective Business Strategy Ppt PowerPoint Presentation File Display PDF
Persuade your audience using this five steps for effective business strategy ppt powerpoint presentation file display pdf. This PPT design covers five stages, thus making it a great tool to use. It also caters to a variety of topics including executive summary, market analysis, company description. Download this PPT design now to present a convincing pitch that not only emphasizes the topic but also showcases your presentation skills.
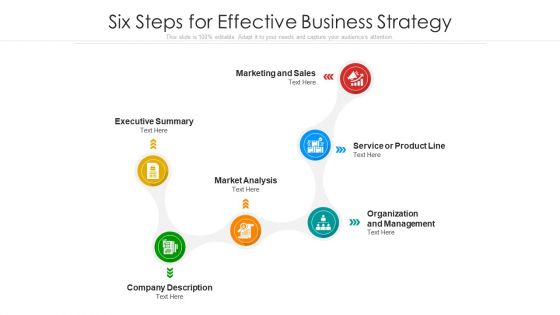
Six Steps For Effective Business Strategy Ppt PowerPoint Presentation Gallery Pictures PDF
Persuade your audience using this six steps for effective business strategy ppt powerpoint presentation gallery pictures pdf. This PPT design covers six stages, thus making it a great tool to use. It also caters to a variety of topics including executive summary, market analysis, company description. Download this PPT design now to present a convincing pitch that not only emphasizes the topic but also showcases your presentation skills.

Seven Steps For Effective Business Strategy Ppt PowerPoint Presentation File Inspiration PDF
Persuade your audience using this seven steps for effective business strategy ppt powerpoint presentation file inspiration pdf. This PPT design covers seven stages, thus making it a great tool to use. It also caters to a variety of topics including executive summary, market analysis, company description. Download this PPT design now to present a convincing pitch that not only emphasizes the topic but also showcases your presentation skills.
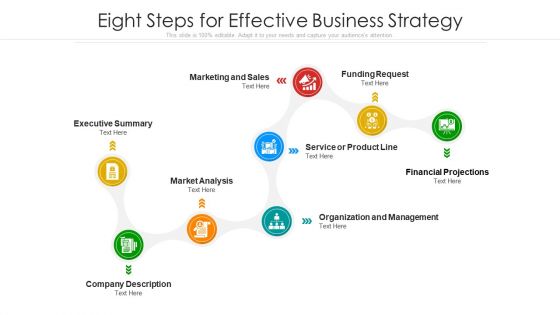
Eight Steps For Effective Business Strategy Ppt PowerPoint Presentation File Samples PDF
Persuade your audience using this eight steps for effective business strategy ppt powerpoint presentation file samples pdf. This PPT design covers eight stages, thus making it a great tool to use. It also caters to a variety of topics including executive summary, market analysis, company description. Download this PPT design now to present a convincing pitch that not only emphasizes the topic but also showcases your presentation skills.
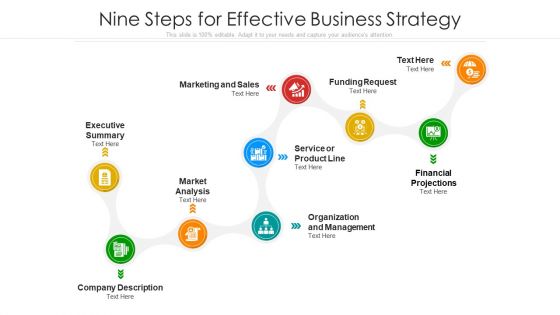
Nine Steps For Effective Business Strategy Ppt PowerPoint Presentation File Rules PDF
Persuade your audience using this nine steps for effective business strategy ppt powerpoint presentation file rules pdf. This PPT design covers nine stages, thus making it a great tool to use. It also caters to a variety of topics including executive summary, market analysis, company description. Download this PPT design now to present a convincing pitch that not only emphasizes the topic but also showcases your presentation skills.
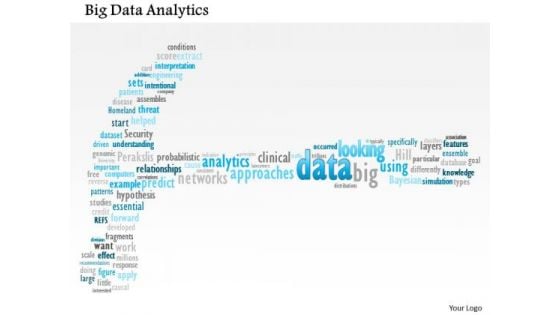
Business Framework Big Data Analytics PowerPoint Presentation
This unique power point diagram slide has been crafted with big data analytics. This data analytics is used to improve predictions and support decision making. Use this image slide for big data analysis related presentations.
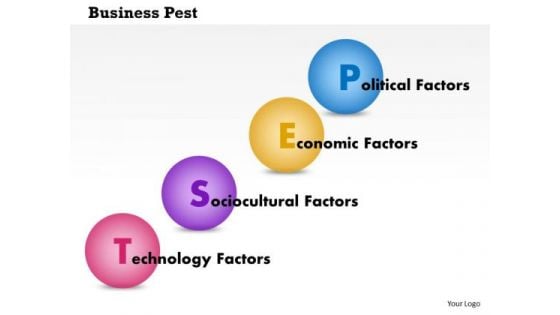
Business Framework Business Pest PowerPoint Presentation
Display social ,economic, social and technological status of any company with our PEST business framework Power Point slide. This PPTslide has been crafted with sequential order of PEST analysis. Use this PPT slide and get good comments on your efforts.
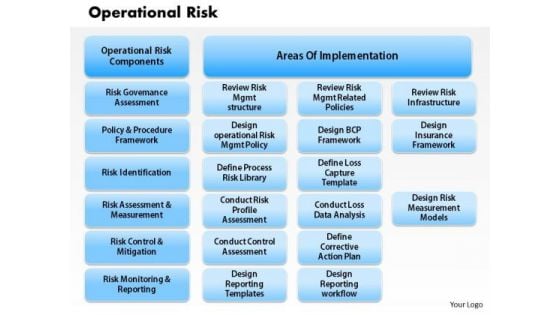
Business Framework Operational Risk PowerPoint Presentation
This image slide has been designed to display operational risk flowcharts. Use this image slide, in your presentations to depict business risk analysis. This image slide will enhance the quality of your presentations.
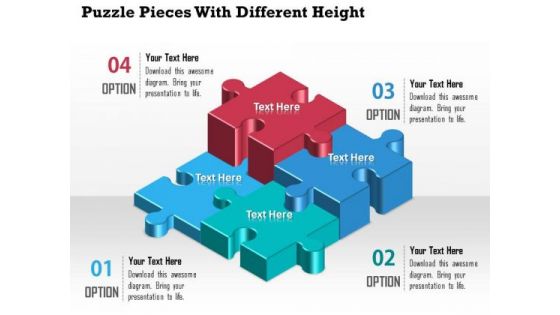
Business Diagram Puzzle Pieces With Different Height Presentation Template
A professional bar graph has been crafted with graphic of puzzles. All these puzzles are in different heights which shows the various levels of any data result representations. Use this diagram for your business result and data analysis related topics.
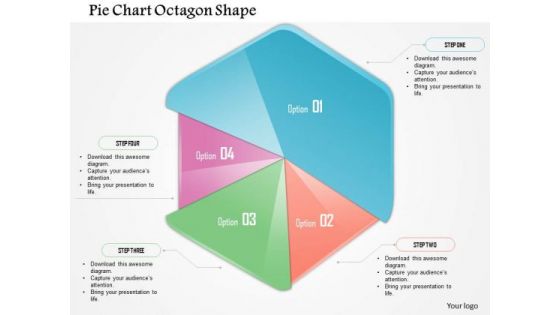
Business Diagram Pie Chart Octagon Shape Presentation Template
This business plan power point template has been designed with pie chart in octagon shape. This PPT contains the concept of result analysis for any business process. Use this PPT for business and sales related presentations.
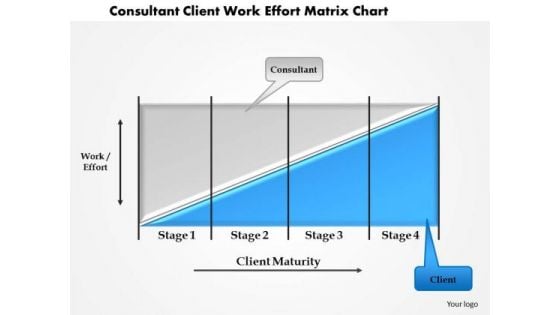
Business Framework Consultant Client Work Effort Matrix Chart PowerPoint Presentation
This business power point template slide has been crafted with graphic of bar graph. This bar graph is called as coase theorem. Use this professional diagram for your result analysis related presentation.
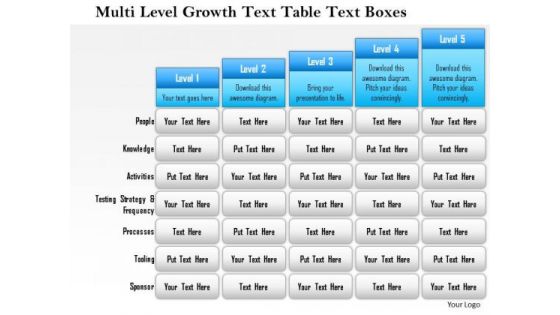
Business Framework Multi Level Growth Text Table Text Boxes 2 PowerPoint Presentation
Five staged text box style chart in bar graph design has been used to decorate this power point template slide. This diagram slide contains the multilevel growth concept. Use this PPT slide for financial growth and result analysis related topics.

Stock Photo Golden Dollar Symbol With Pie Graph PowerPoint Slide
This Power Point template has been crafted with graphic of golden dollar symbol and pie chart on a tablet. Display the concept of financial data analysis with this image. Use this image to present financial reports in business presentations.
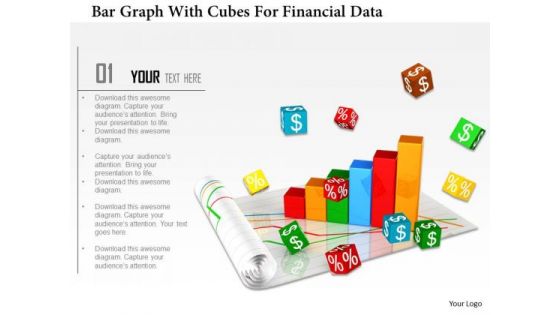
Stock Photo Bar Graph With Cubes For Financial Data PowerPoint Slide
Graphic of bar graph and cubes are used to decorate this image template. This PPT contains the concept of financial data analysis. Use this PPT for finance and business related presentations.
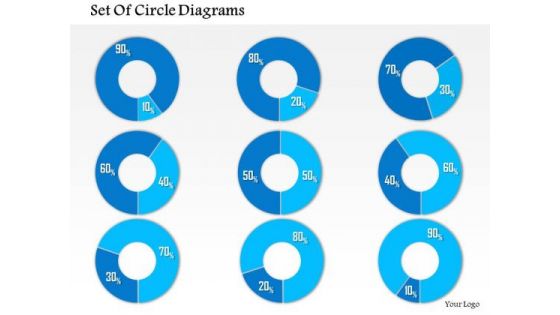
Business Framework 10 Percent To 90 Percent PowerPoint Presentation
This business diagram has been designed with graphic of multiple pie graphs. This diagram slide contains the concept of result analysis with percentage values. Use this diagram to present and compare data in an impressive manner
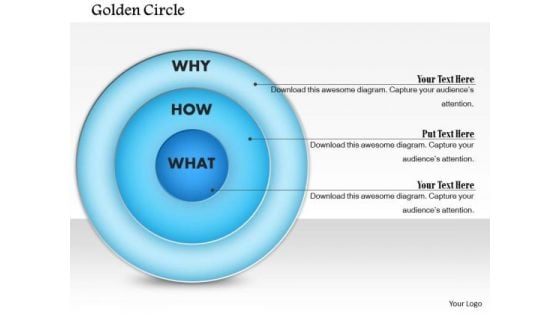
Business Framework Golden Circle PowerPoint Presentation
This business diagram has been designed with graphic of blue colored circle. This business slide is suitable to display data analysis in any business presentation. Use this slide to build a unique presentations for your viewers
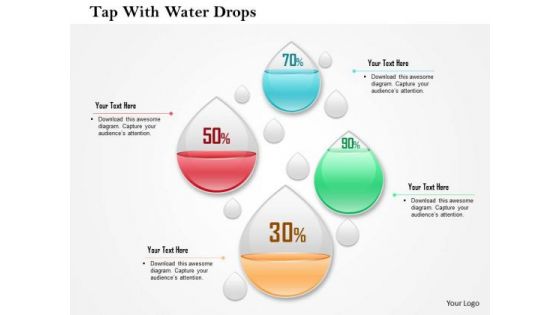
Business Diagram Four Water Drops With Percentage Values Presentation Template
This business diagram has been designed with graphic of four water drops and percentage values. This slide may be used to display percentage values for business analysis. Use this editable diagram for finance and business related presentations.
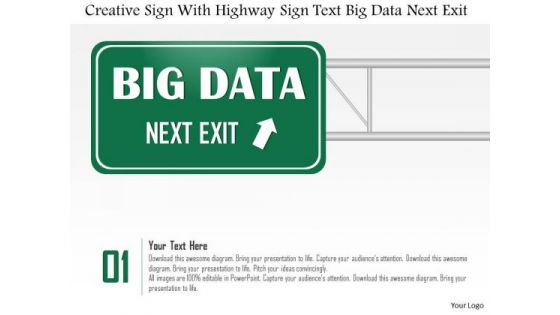
Business Diagram Creative Sign With Highway Sign Text Big Data Next Exit Ppt Slide
This diagram has been designed with graphic of magnifier and text boxes. These boxes are used to display creative sign and highway sign for big data analysis. This diagram can be used for data related topics in any presentation.
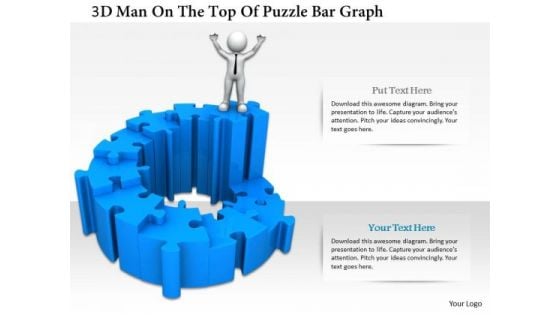
3d Man On The Top Of Puzzle Bar Graph
This PPT has been designed with graphic of 3d man and puzzle are graph. This PPT displays the concept of result analysis and financial growth. Use this PPT for your business and finance related presentations.
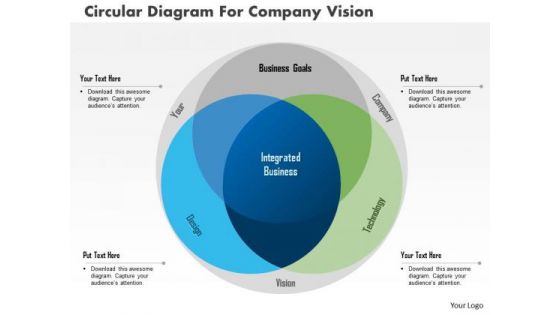
Business Diagram Circular Diagram For Company Vision Presentation Template
This power point template diagram has been crafted with three staged Venn diagram. This PPT contains the concept of future vision and analysis. Use this PPT for your business presentations.
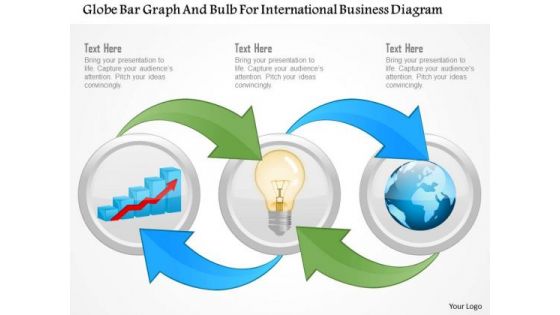
Business Diagram Globe Bar Graph And Bulb For International Business Diagram Presentation Template
Graphic of globe and bar graph with bulb has been used to craft this power point template diagram. This PPT diagram contains the concept of international business growth analysis. Use this PPT for global business and sales related presentations.
Business Diagram Business Man With Puzzles Icon Presentation Template
Graphic of business man with puzzles icons has been used to design this power point template. This diagram slide helps to portray concept like business strategy and analysis. Use this diagram to organize your thoughts and ideas.
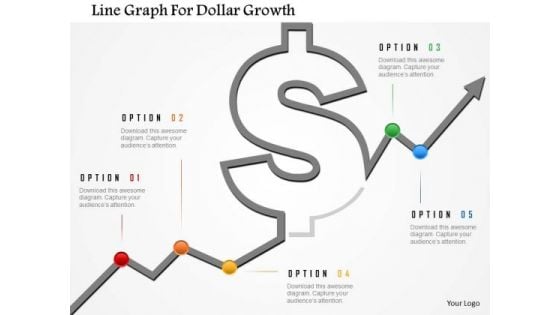
Business Diagram Line Graph For Dollar Growth Presentation Template
Graphic of dollar symbol and growth arrow has been used to design this power point template. This diagram contains the concept of financial result analysis. Use this business diagram for finance related presentations
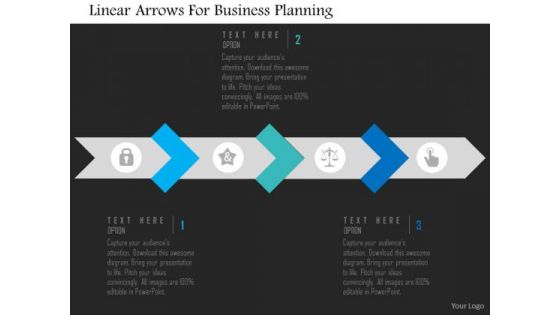
Business Diagram Linear Arrows For Business Planning Presentation Template
This slide illustrates diagram of linear arrows. You may use it to for business planning and analysis. This diagram is suitable to display business information and also helps to keep your audience interested till the end of your presentation.

3d Happy Person With Dollars PowerPoint Templates
Concept of financial growth analysis with happiness has been defined in this PowerPoint template. This diagram slide contains the graphic of 3d man standing over the currency. Use this image for business and finance related topics in any presentation.
Time Management Target Goal Bar Graph Ppt Slides Graphics
This power point template has been crafted with icons of time management, target, goal and bar graph. This icon slide can be used for business analysis and time planning. Build an innovative presentation with all these professional icons.
Battery Icons For Business Growth Levels Powerpoint Template
Levels of business growth can be displayed with this diagram. This PowerPoint template contains graphics of seven battery icons. You can use this design for data analysis in business presentations
Five Options Bar Graph With Icons Powerpoint Template
This PowerPoint slide has been designed with five options bar graph and icons. This slide of bar graph is suitable for statistical analysis. This professional slide helps in making an instant impact on viewers.
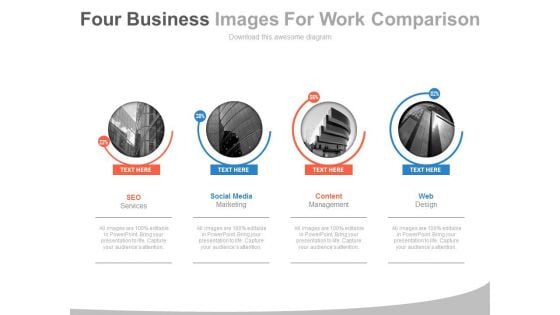
Four Companies With Web Services Powerpoint Slides
This PowerPoint template display graphics of four corporate buildings. You may use this PPT slide for financial and strategic analysis for web services companies. This dashboard slide may useful for multilevel status report creation and approval process.
Thumbs Up Text Tags With Finance Icons Powerpoint Template
Emphatically define your message with our above template containing thumbs up text tags with icons. This slide signifies business planning and analysis. Adjust the above diagram into your Presentations to visually support your contents.
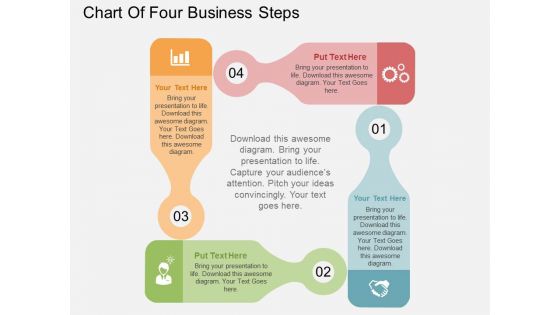
Chart Of Four Business Steps Powerpoint Templates
This business diagram displays flow of four business steps. This editable slide is suitable to present growth management. Use this diagram for business and finance related topics and display complete data analysis in your presentation.
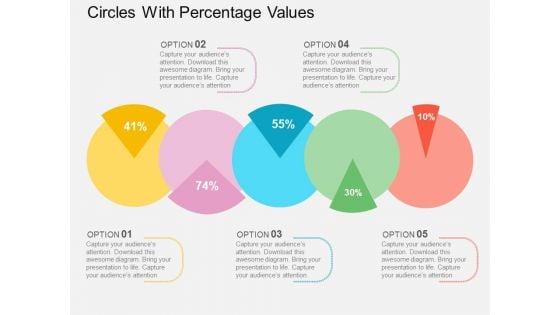
Circles With Percentage Values Powerpoint Templates
This PowerPoint template displays circles with percentage values. This business diagram is suitable for financial data analysis. Use this business diagram slide to highlight the key issues of your presentation.
Five Circular Steps With Business Icons Powerpoint Templates
This business diagram has been designed with circular graphics with business icons. This slide suitable for business analysis and strategy presentation. Use this diagram to present your views in a wonderful manner.
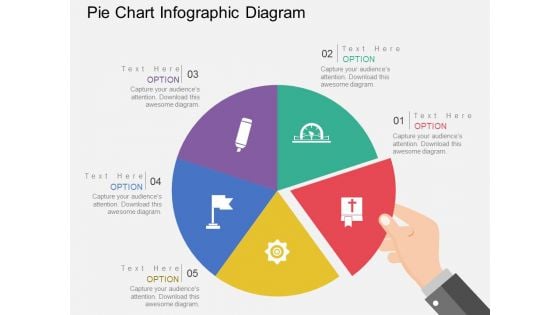
Pie Chart Infographic Diagram Powerpoint Templates
This Power Point template has been designed with pie chart infographic. This business slide is useful to present financial ratio analysis. Use this diagram to make business presentation. Illustrate these thoughts with this slide.
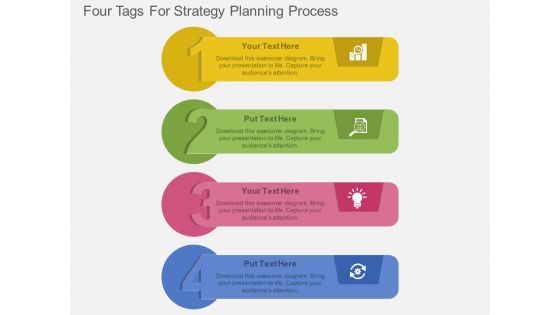
Four Tags For Strategy Planning Process Powerpoint Template
Steps for strategy planning can be explained with this diagram. This PowerPoint template contains diagram of four infographic tags. You can also use this design for data analysis in business presentations
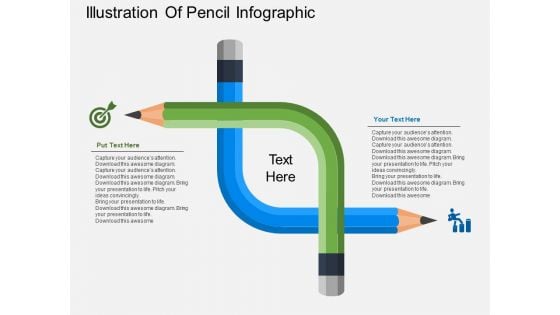
Illustration Of Pencil Infographic Powerpoint Templates
The above PowerPoint template displays a pencil Infographic diagram. This PPT slide may be used to display target planning and analysis. Grab center stage with this slide and capture the attention of your audience.
Rocket With Three Staged Icons Powerpoint Template
Growth analysis for business can be defined with this business diagram. This slide depicts rocket with three staged icons. Present your views using this innovative slide and be assured of leaving a lasting impression
Three Staged Square Step Diagram And Icons Powerpoint Template
Graphic square step with icons has been used to design this business diagram. This diagram slide may be used to depict order of business steps. Download this diagram for business research and analysis.
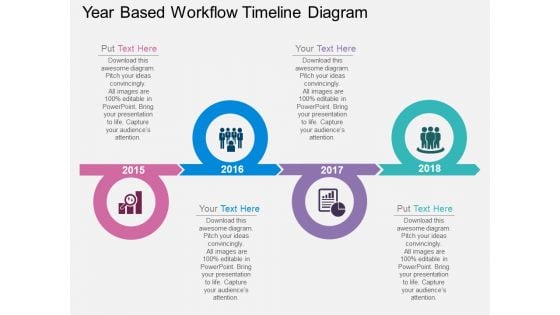
Year Based Workflow Timeline Diagram Powerpoint Template
Four Staged Text Box And Icons Powerpoint Template
Our above PPT slide displays graphics of four text boxes with icons. This diagram may be used for concepts like business planning and analysis. Download this template to leave permanent impression on your audience.
Five Hexagons With Business Icons Powerpoint Templates
This PowerPoint template contains graphics of hexagons with business icons. This layout helps you to portray concepts teamwork, idea sharing and business analysis. Streamline the flow of information across the board using this diagram.
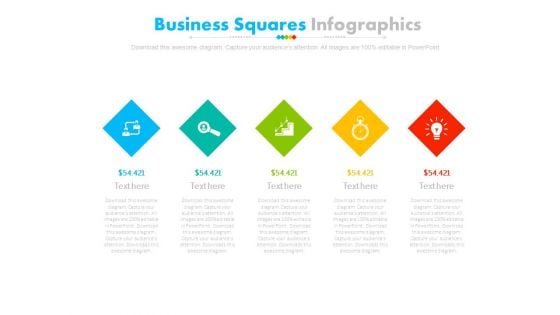
Five Steps Diamond Infographic Diagram Powerpoint Slides
This PowerPoint template has been designed with alphabet steps with icons. This PPT slide may be used to display financial strategy analysis. Make outstanding business presentation with this template.
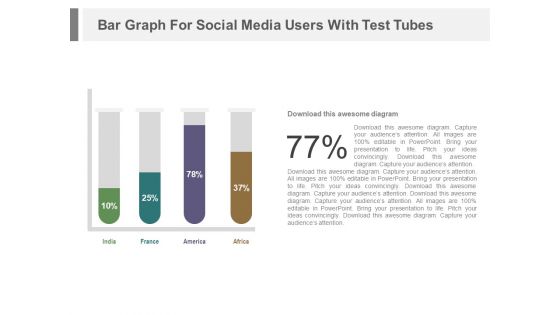
Test Tubes With Financial Data In Percentage Ratio Powerpoint Slides
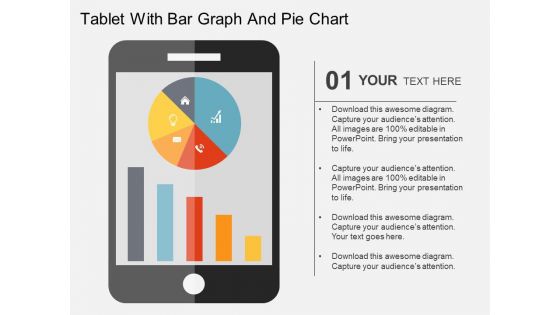
Tablet With Bar Graph And Pie Chart Powerpoint Templates
This business slide has been designed with business graphs on computer tablet. You may download this PPT slide to display statistical analysis. This slide will help you to sequence your thoughts.
Six Staged Infographics Square With Business Icons Powerpoint Templates
This business diagram displays circular puzzle infographic. This editable slide is suitable to present global communication. Use this diagram for business and finance related topics and display complete data analysis in your presentation.
Three Arrows With Icons Powerpoint Templates
This business diagram displays graphic of three arrows with icons. This power point template contains the concept of business analysis and research. Use this diagram to build unique presentation for your viewers.
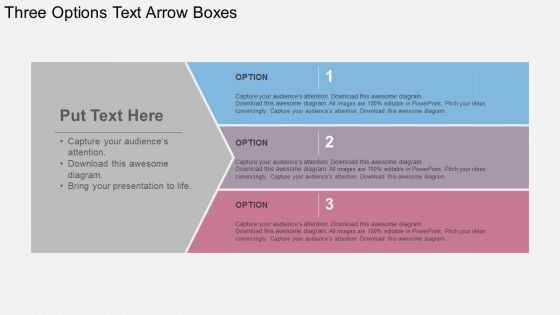
Three Options Text Arrow Boxes Powerpoint Templates
This business diagram displays graphic of arrows with icons. This power point template contains the concept of business analysis and research. Use this diagram to build unique presentation for your viewers.
Hexagons With Seven Business Icons Powerpoint Templates
Hexagonal layout with business icons has been displayed in this business slide. This business diagram helps to exhibit concepts of strategy, planning, communication, management and analysis. Use this diagram to build an exclusive presentation.


 Continue with Email

 Home
Home


