Market Trends
Infotech Solutions Research And Development Company Summary Company Patent Grants Icons PDF
This slide highlights the total patents granted to company in 2022 in multiple categories of IT, which includes AL and ML. cloud services, network design, cyber security and others. It also depicts historical patent trend with key insights. Deliver an awe inspiring pitch with this creative Infotech Solutions Research And Development Company Summary Company Patent Grants Icons PDF bundle. Topics like Network Design, Cyber Security, Cloud Services can be discussed with this completely editable template. It is available for immediate download depending on the needs and requirements of the user.
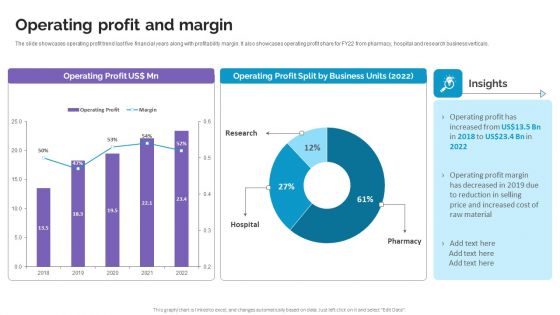
Operating Profit And Margin Life Science And Healthcare Solutions Company Profile Inspiration PDF
The slide showcases operating profit trend last five financial years along with profitability margin. It also showcases operating profit share for FY22 from pharmacy, hospital and research business verticals. From laying roadmaps to briefing everything in detail, our templates are perfect for you. You can set the stage with your presentation slides. All you have to do is download these easy-to-edit and customizable templates. Operating Profit And Margin Life Science And Healthcare Solutions Company Profile Inspiration PDF will help you deliver an outstanding performance that everyone would remember and praise you for. Do download this presentation today.
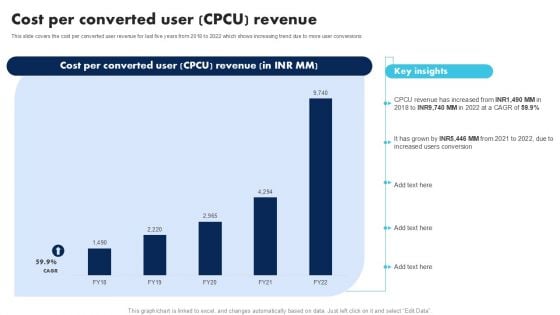
Information Technology Solutions Company Outline Cost Per Converted User CPCU Revenue Topics PDF
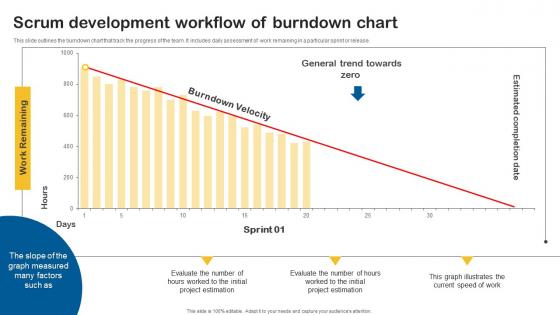
Scrum Development Workflow Of Burndown Chart Designs Pdf
This slide outlines the burndown chart that track the progress of the team. It includes daily assessment of work remaining in a particular sprint or release.Pitch your topic with ease and precision using this Scrum Development Workflow Of Burndown Chart Designs Pdf This layout presents information on Project Estimation, General Trend Towards, Graph Measured It is also available for immediate download and adjustment. So, changes can be made in the color, design, graphics or any other component to create a unique layout. This slide outlines the burndown chart that track the progress of the team. It includes daily assessment of work remaining in a particular sprint or release.
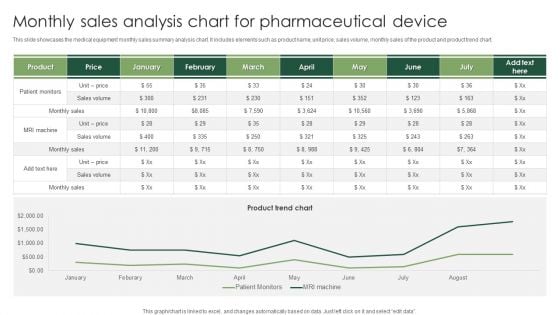
Monthly Sales Analysis Chart For Pharmaceutical Device Structure PDF
This slide showcases the medical equipment monthly sales summary analysis chart. It includes elements such as product name, unit price, sales volume, monthly sales of the product and product trend chart. Showcasing this set of slides titled Monthly Sales Analysis Chart For Pharmaceutical Device Structure PDF. The topics addressed in these templates are Monthly Sales Analysis, Pharmaceutical Device. All the content presented in this PPT design is completely editable. Download it and make adjustments in color, background, font etc. as per your unique business setting.
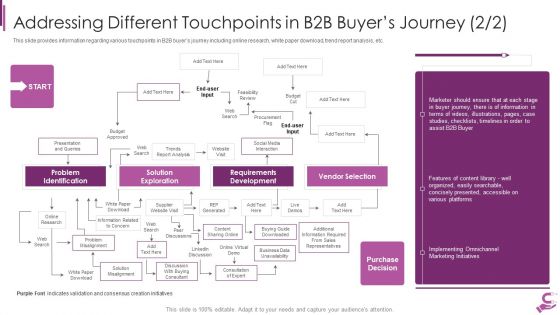
B2B Demand Generation Best Practices Addressing Different Touchpoints In B2B Buyers Journey Slides PDF
This slide provides information regarding various touchpoints in B2B buyers journey including online research, white paper download, trend report analysis, etc. Presenting b2b demand generation best practices addressing different touchpoints in b2b buyers journey slides pdf to provide visual cues and insights. Share and navigate important information on one stages that need your due attention. This template can be used to pitch topics like problem identification, solution exploration, requirements development, vendor selection, purchase decision. In addtion, this PPT design contains high resolution images, graphics, etc, that are easily editable and available for immediate download.
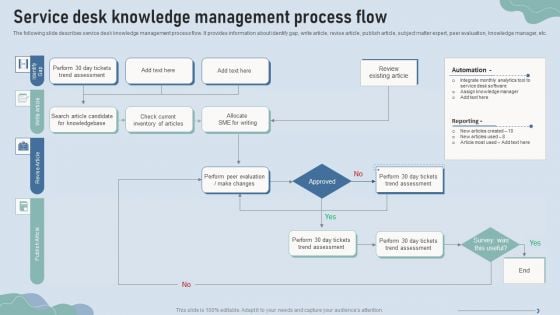
Improve IT Service Desk Service Desk Knowledge Management Process Flow Graphics PDF
The following slide describes service desk knowledge management process flow. It provides information about identify gap, write article, revise article, publish article, subject matter expert, peer evaluation, knowledge manager, etc. Presenting Improve IT Service Desk Service Desk Knowledge Management Process Flow Graphics PDF to provide visual cues and insights. Share and navigate important information on one stage that need your due attention. This template can be used to pitch topics like Trend Assessment, Candidate Knowledge Base, Perform Evaluation. In addtion, this PPT design contains high resolution images, graphics, etc, that are easily editable and available for immediate download.
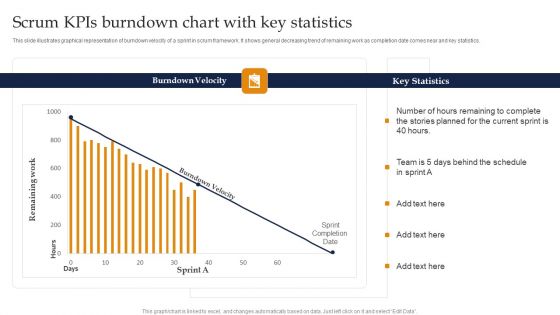
Scrum Kpis Burndown Chart With Key Statistics Ppt Pictures Visual Aids PDF
This slide illustrates graphical representation of burndown velocity of a sprint in scrum framework. It shows general decreasing trend of remaining work as completion date comes near and key statistics. Pitch your topic with ease and precision using this Scrum Kpis Burndown Chart With Key Statistics Ppt Pictures Visual Aids PDF. This layout presents information on Burndown Velocity, Key Statistics, Current Sprint. It is also available for immediate download and adjustment. So, changes can be made in the color, design, graphics or any other component to create a unique layout.
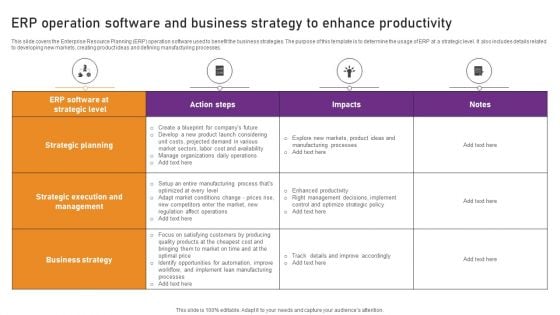
Erp Operation Software And Business Strategy To Enhance Productivity Formats PDF
This slide covers the ecommerce demand forecasting plan used in a business. The purpose of this template is to determine the method to create the forecast. It also includes details related to trend projection, sample surveys, etc.Showcasing this set of slides titled Erp Operation Software And Business Strategy To Enhance Productivity Formats PDF. The topics addressed in these templates are Manufacturing Processes, Right Management, Improve Accordingly. All the content presented in this PPT design is completely editable. Download it and make adjustments in color, background, font etc. as per your unique business setting.
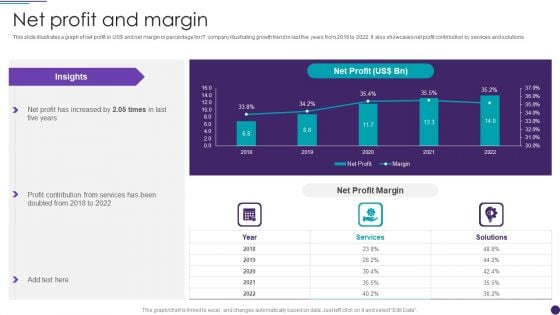
IT Services Business Profile Net Profit And Margin Sample PDF
This slide illustrates a graph of net profit in US doller and net margin in percentage for IT company illustrating growth trend in last five years from 2018 to 2022. It also showcases net profit contribution by services and solutions. Deliver and pitch your topic in the best possible manner with this IT Services Business Profile Net Profit And Margin Sample PDF. Use them to share invaluable insights on Services, Net Profit Margin and impress your audience. This template can be altered and modified as per your expectations. So, grab it now.
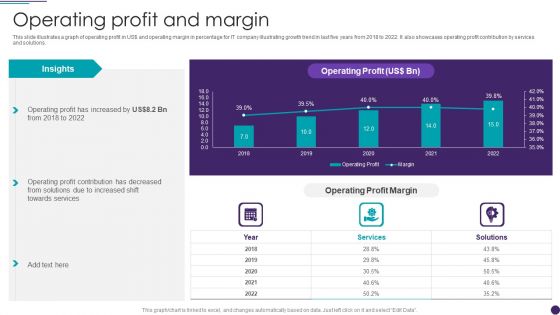
IT Services Business Profile Operating Profit And Margin Sample PDF
This slide illustrates a graph of operating profit in US doller and operating margin in percentage for IT company illustrating growth trend in last five years from 2018 to 2022. It also showcases operating profit contribution by services and solutions. Deliver an awe inspiring pitch with this creative IT Services Business Profile Operating Profit And Margin Sample PDF bundle. Topics like Operating Profit, Services can be discussed with this completely editable template. It is available for immediate download depending on the needs and requirements of the user.
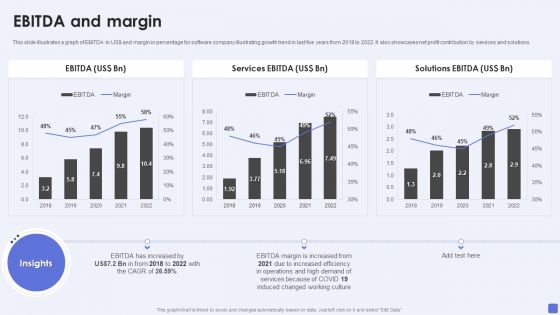
Software Services Business Profile EBITDA And Margin Ppt PowerPoint Presentation Gallery Slide Portrait PDF
This slide illustrates a graph of EBITDA in US dollar and margin in percentage for software company illustrating growth trend in last five years from 2018 to 2022. It also showcases net profit contribution by services and solutions. Deliver an awe inspiring pitch with this creative Software Services Business Profile EBITDA And Margin Ppt PowerPoint Presentation Gallery Slide Portrait PDF bundle. Topics like Services EB, Solutions EBITDA, EBITDA Margin can be discussed with this completely editable template. It is available for immediate download depending on the needs and requirements of the user.
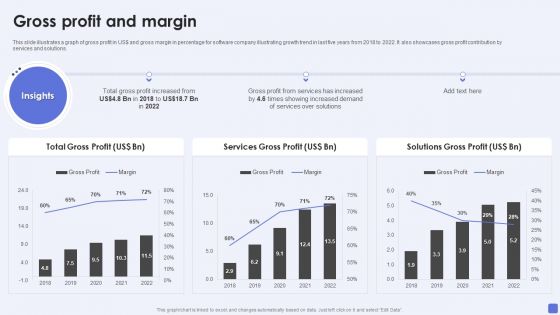
Software Services Business Profile Gross Profit And Margin Ppt PowerPoint Presentation Gallery Templates PDF
This slide illustrates a graph of gross profit in US dollar and gross margin in percentage for software company illustrating growth trend in last five years from 2018 to 2022. It also showcases gross profit contribution by services and solutions. Deliver an awe inspiring pitch with this creative Software Services Business Profile Gross Profit And Margin Ppt PowerPoint Presentation Gallery Templates PDF bundle. Topics like Total Gross Profit, Services Gross Profit, Solutions Gross Profit can be discussed with this completely editable template. It is available for immediate download depending on the needs and requirements of the user.
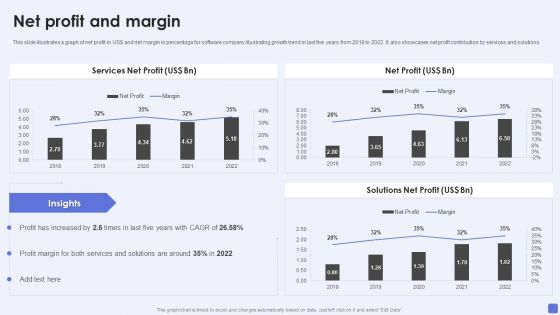
Software Services Business Profile Net Profit And Margin Ppt PowerPoint Presentation File Slides PDF
This slide illustrates a graph of net profit in US dollar and net margin in percentage for software company illustrating growth trend in last five years from 2018 to 2022. It also showcases net profit contribution by services and solutions. Deliver an awe inspiring pitch with this creative Software Services Business Profile Net Profit And Margin Ppt PowerPoint Presentation File Slides PDF bundle. Topics like Services Net Profit, Net Profit, Solutions Net Profit can be discussed with this completely editable template. It is available for immediate download depending on the needs and requirements of the user.
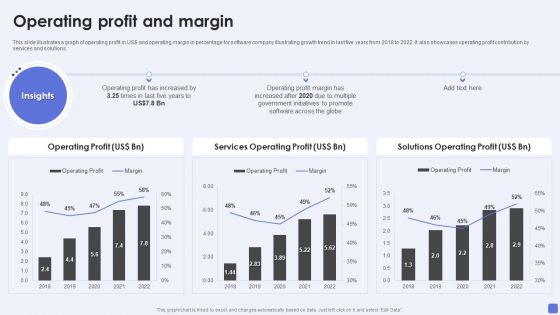
Software Services Business Profile Operating Profit And Margin Ppt PowerPoint Presentation Gallery Inspiration PDF
This slide illustrates a graph of operating profit in US dollar and operating margin in percentage for software company illustrating growth trend in last five years from 2018 to 2022. It also showcases operating profit contribution by services and solutions. Deliver and pitch your topic in the best possible manner with this Software Services Business Profile Operating Profit And Margin Ppt PowerPoint Presentation Gallery Inspiration PDF. Use them to share invaluable insights on Operating Profit, Services Operating Profit, Solutions Operating Profit and impress your audience. This template can be altered and modified as per your expectations. So, grab it now.
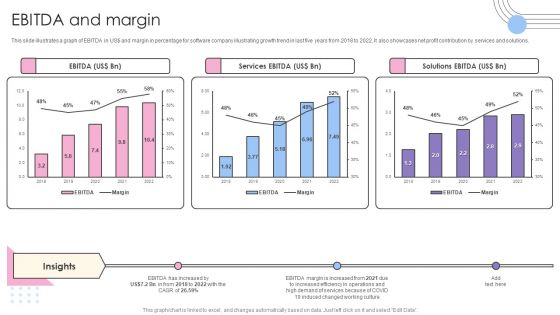
Software Products And Solutions Firm Details EBITDA And Margin Structure PDF
This slide illustrates a graph of EBITDA in US dollar and margin in percentage for software company illustrating growth trend in last five years from 2018 to 2022. It also showcases net profit contribution by services and solutions. Deliver an awe inspiring pitch with this creative Software Products And Solutions Firm Details EBITDA And Margin Structure PDF bundle. Topics like EBITDA, Services EBITDA, Solutions EBITDA, 2018 To 2022 can be discussed with this completely editable template. It is available for immediate download depending on the needs and requirements of the user.
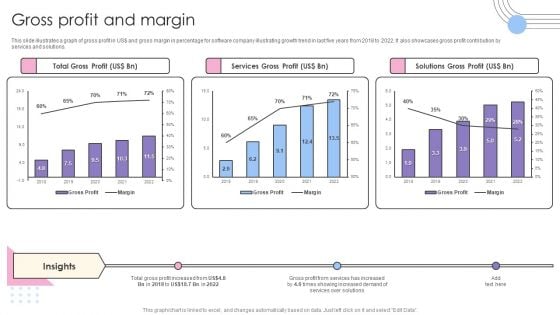
Software Products And Solutions Firm Details Gross Profit And Margin Pictures PDF
This slide illustrates a graph of gross profit in US dollar and gross margin in percentage for software company illustrating growth trend in last five years from 2018 to 2022. It also showcases gross profit contribution by services and solutions. Deliver and pitch your topic in the best possible manner with this Software Products And Solutions Firm Details Gross Profit And Margin Pictures PDF. Use them to share invaluable insights on Total Gross Profit, Services Gross Profit, Solutions Gross Profit and impress your audience. This template can be altered and modified as per your expectations. So, grab it now.
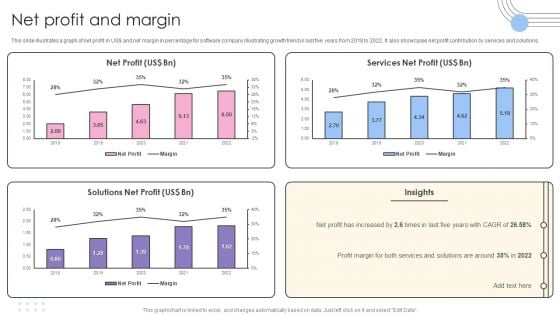
Software Products And Solutions Firm Details Net Profit And Margin Information PDF
This slide illustrates a graph of net profit in US dollar and net margin in percentage for software company illustrating growth trend in last five years from 2018 to 2022. It also showcases net profit contribution by services and solutions. Deliver and pitch your topic in the best possible manner with this Software Products And Solutions Firm Details Net Profit And Margin Information PDF. Use them to share invaluable insights on Net Profit, Services Net Profit, Solutions Net Profit and impress your audience. This template can be altered and modified as per your expectations. So, grab it now.

Software Products And Solutions Firm Details Operating Profit And Margin Mockup PDF
This slide illustrates a graph of operating profit in US dollar and operating margin in percentage for software company illustrating growth trend in last five years from 2018 to 2022. It also showcases operating profit contribution by services and solutions. Deliver an awe inspiring pitch with this creative Software Products And Solutions Firm Details Operating Profit And Margin Mockup PDF bundle. Topics like Operating Profit, Services Operating Profit, Solutions Operating Profit can be discussed with this completely editable template. It is available for immediate download depending on the needs and requirements of the user.
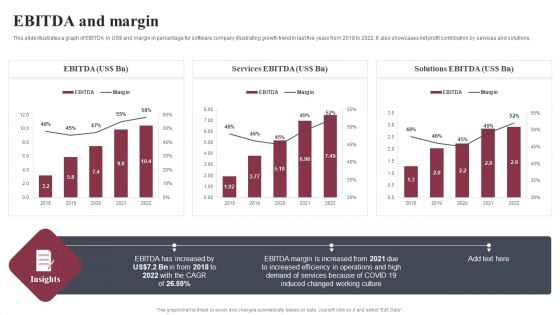
Business Software Development Company Profile EBITDA And Margin Summary PDF
This slide illustrates a graph of EBITDA in US dollar and margin in percentage for software company illustrating growth trend in last five years from 2018 to 2022. It also showcases net profit contribution by services and solutions. Deliver an awe inspiring pitch with this creative Business Software Development Company Profile EBITDA And Margin Summary PDF bundle. Topics like EBITDA, Services EBITDA, Solutions EBITDA can be discussed with this completely editable template. It is available for immediate download depending on the needs and requirements of the user.
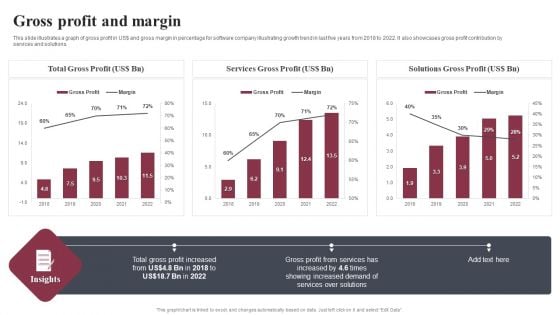
Business Software Development Company Profile Gross Profit And Margin Microsoft PDF
This slide illustrates a graph of gross profit in US dollar and gross margin in percentage for software company illustrating growth trend in last five years from 2018 to 2022. It also showcases gross profit contribution by services and solutions. Deliver and pitch your topic in the best possible manner with this Business Software Development Company Profile Gross Profit And Margin Microsoft PDF. Use them to share invaluable insights on Total Gross Profit, Services Gross Profit, Solutions Gross Profit and impress your audience. This template can be altered and modified as per your expectations. So, grab it now.
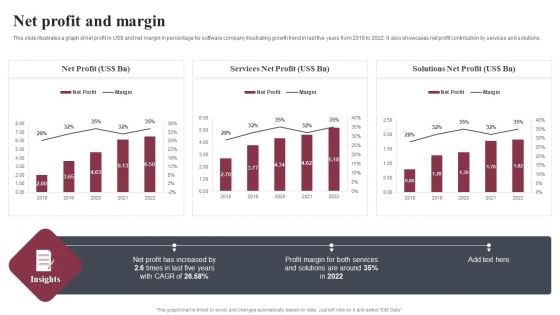
Business Software Development Company Profile Net Profit And Margin Mockup PDF
This slide illustrates a graph of net profit in US dollar and net margin in percentage for software company illustrating growth trend in last five years from 2018 to 2022. It also showcases net profit contribution by services and solutions. Deliver an awe inspiring pitch with this creative Business Software Development Company Profile Net Profit And Margin Mockup PDF bundle. Topics like Net Profit, Services Net Profit, Solutions Net Profit can be discussed with this completely editable template. It is available for immediate download depending on the needs and requirements of the user.
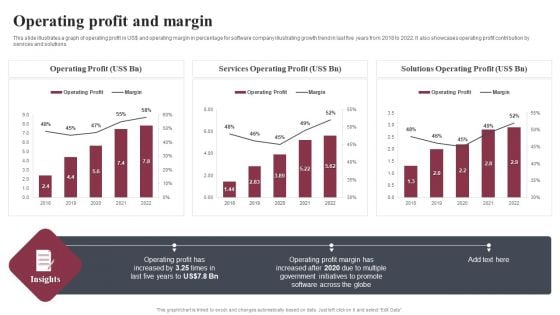
Business Software Development Company Profile Operating Profit And Margin Summary PDF
This slide illustrates a graph of operating profit in US dollar and operating margin in percentage for software company illustrating growth trend in last five years from 2018 to 2022. It also showcases operating profit contribution by services and solutions. Deliver and pitch your topic in the best possible manner with this Business Software Development Company Profile Operating Profit And Margin Summary PDF. Use them to share invaluable insights on Operating Profit, Services Operating Profit, Solutions Operating Profit and impress your audience. This template can be altered and modified as per your expectations. So, grab it now.
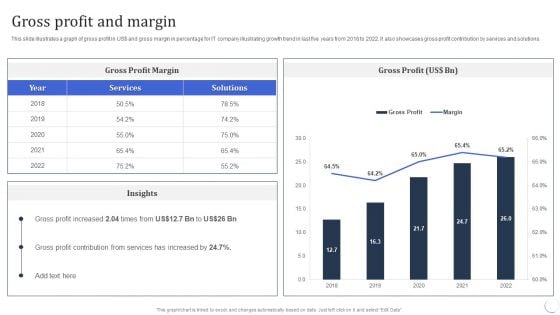
Infotech Solutions Research And Development Company Summary Gross Profit And Margin Ideas PDF
This slide illustrates a graph of gross profit in US dollar and gross margin in percentage for IT company illustrating growth trend in last five years from 2018 to 2022. It also showcases gross profit contribution by services and solutions. Deliver an awe inspiring pitch with this creative Infotech Solutions Research And Development Company Summary Gross Profit And Margin Ideas PDF bundle. Topics like Services, Gross Profit Margin can be discussed with this completely editable template. It is available for immediate download depending on the needs and requirements of the user.
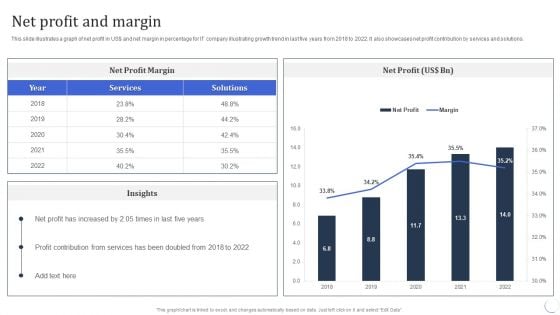
Infotech Solutions Research And Development Company Summary Net Profit And Margin Information PDF
This slide illustrates a graph of net profit in US dollar and net margin in percentage for IT company illustrating growth trend in last five years from 2018 to 2022. It also showcases net profit contribution by services and solutions. Deliver and pitch your topic in the best possible manner with this Infotech Solutions Research And Development Company Summary Net Profit And Margin Information PDF. Use them to share invaluable insights on Profit Contribution, Services, Net Profit and impress your audience. This template can be altered and modified as per your expectations. So, grab it now.
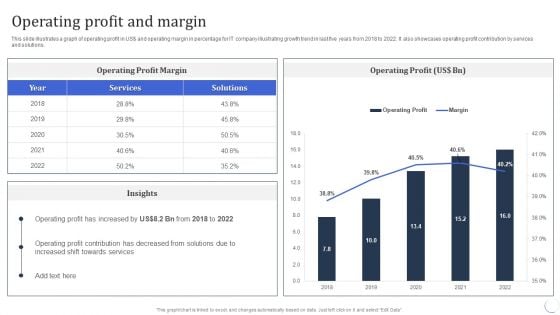
Infotech Solutions Research And Development Company Summary Operating Profit And Margin Download PDF
This slide illustrates a graph of operating profit in US dollar and operating margin in percentage for IT company illustrating growth trend in last five years from 2018 to 2022. It also showcases operating profit contribution by services and solutions. Deliver an awe inspiring pitch with this creative Infotech Solutions Research And Development Company Summary Operating Profit And Margin Download PDF bundle. Topics like Services, Operating Profit can be discussed with this completely editable template. It is available for immediate download depending on the needs and requirements of the user.
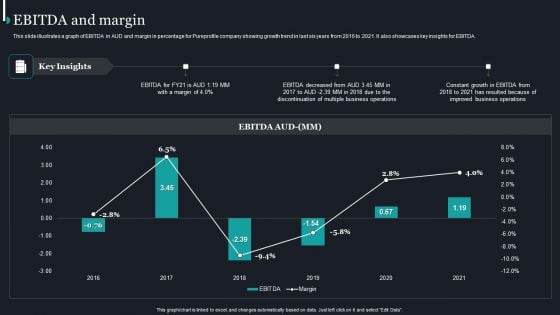
Pureprofile Business Overview EBITDA And Margin Ppt Gallery Sample PDF
This slide illustrates a graph of EBITDA in AUD and margin in percentage for Pureprofile company showing growth trend in last six years from 2016 to 2021. It also showcases key insights for EBITDA. Deliver and pitch your topic in the best possible manner with this Pureprofile Business Overview EBITDA And Margin Ppt Gallery Sample PDF. Use them to share invaluable insights on EBITDA Decreased, Business Operations, 2016 To 2021 and impress your audience. This template can be altered and modified as per your expectations. So, grab it now.
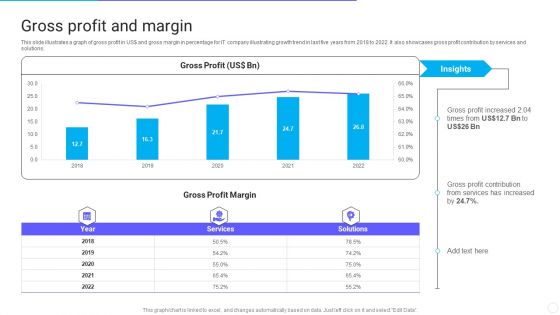
IT Application Services Company Outline Gross Profit And Margin Elements PDF
This slide illustrates a graph of gross profit in US dollar and gross margin in percentage for IT company illustrating growth trend in last five years from 2018 to 2022. It also showcases gross profit contribution by services and solutions. Deliver an awe inspiring pitch with this creative IT Application Services Company Outline Gross Profit And Margin Elements PDF bundle. Topics like Gross Profit Margin, Services can be discussed with this completely editable template. It is available for immediate download depending on the needs and requirements of the user.
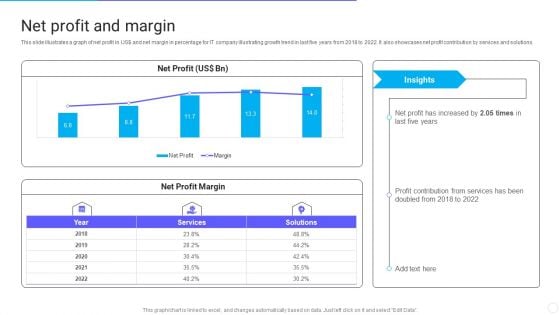
IT Application Services Company Outline Net Profit And Margin Structure PDF
This slide illustrates a graph of net profit in US dollar and net margin in percentage for IT company illustrating growth trend in last five years from 2018 to 2022. It also showcases net profit contribution by services and solutions. Deliver and pitch your topic in the best possible manner with this IT Application Services Company Outline Net Profit And Margin Structure PDF. Use them to share invaluable insights on Net Profit Margin, Services, Margin and impress your audience. This template can be altered and modified as per your expectations. So, grab it now.
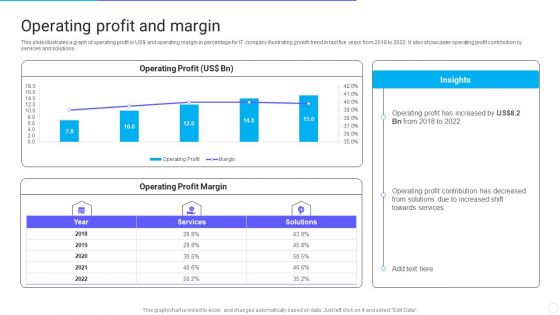
IT Application Services Company Outline Operating Profit And Margin Structure PDF
This slide illustrates a graph of operating profit in US dollar and operating margin in percentage for IT company illustrating growth trend in last five years from 2018 to 2022. It also showcases operating profit contribution by services and solutions. Deliver an awe inspiring pitch with this creative IT Application Services Company Outline Operating Profit And Margin Structure PDF bundle. Topics like Operating Profit And Margin can be discussed with this completely editable template. It is available for immediate download depending on the needs and requirements of the user.
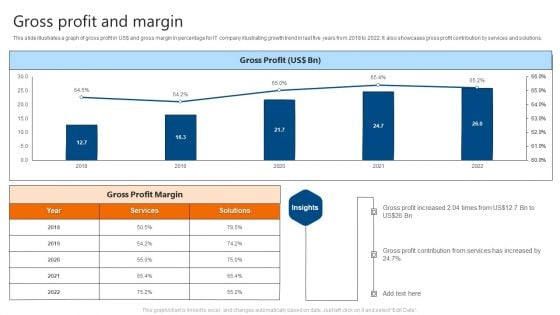
Gross Profit And Margin IT Software Development Company Profile Slides PDF
This slide illustrates a graph of gross profit in US doller and gross margin in percentage for IT company illustrating growth trend in last five years from 2018 to 2022. It also showcases gross profit contribution by services and solutions. Deliver and pitch your topic in the best possible manner with this Gross Profit And Margin IT Software Development Company Profile Slides PDF. Use them to share invaluable insights on Gross Profit, Margin and impress your audience. This template can be altered and modified as per your expectations. So, grab it now.
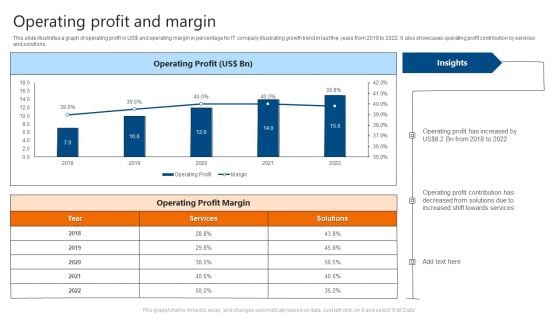
Operating Profit And Margin IT Software Development Company Profile Guidelines PDF
This slide illustrates a graph of operating profit in US doller and operating margin in percentage for IT company illustrating growth trend in last five years from 2018 to 2022. It also showcases operating profit contribution by services and solutions. Deliver and pitch your topic in the best possible manner with this Operating Profit And Margin IT Software Development Company Profile Guidelines PDF. Use them to share invaluable insights on Operating Profit, Operating Profit Margin and impress your audience. This template can be altered and modified as per your expectations. So, grab it now.
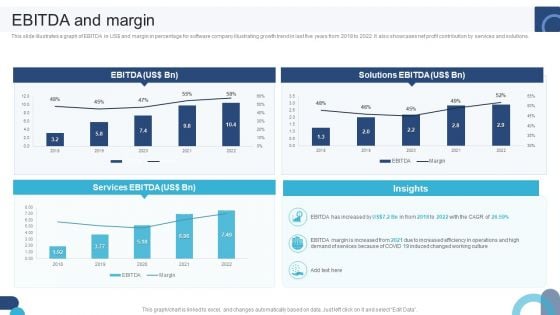
Digital Application Software Development Business Profile EBITDA And Margin Guidelines PDF
This slide illustrates a graph of EBITDA in US dollar and margin in percentage for software company illustrating growth trend in last five years from 2018 to 2022. It also showcases net profit contribution by services and solutions. If your project calls for a presentation, then Slidegeeks is your go-to partner because we have professionally designed, easy-to-edit templates that are perfect for any presentation. After downloading, you can easily edit Digital Application Software Development Business Profile EBITDA And Margin Guidelines PDF and make the changes accordingly. You can rearrange slides or fill them with different images. Check out all the handy templates
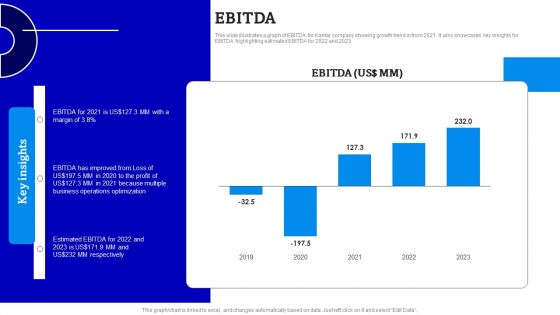
Consulting Firm Business Profile EBITDA Mockup PDF
This slide illustrates a graph of EBITDA for Kantar company showing growth trend in from 2021. It also showcases key insights for EBITDA highlighting estimated EBITDA for 2022 and 2023 Present like a pro with Consulting Firm Business Profile EBITDA Mockup PDF Create beautiful presentations together with your team, using our easy to use presentation slides. Share your ideas in real time and make changes on the fly by downloading our templates. So whether you are in the office, on the go, or in a remote location, you can stay in sync with your team and present your ideas with confidence. With Slidegeeks presentation got a whole lot easier. Grab these presentations today.
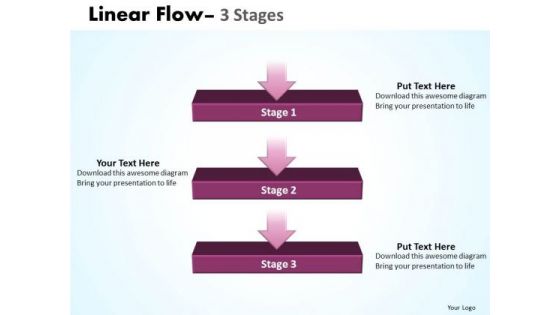
Usa Ppt Theme Linear Flow 3 State Diagram Time Management PowerPoint 1 Design
USA PPT Theme linear flow 3 state diagram time management powerpoint 1 design-Use this diagram to show sequential steps in a task. It helps to lay the base of your trend of thought and enhance the essence of your viable ideas. -USA PPT Theme linear flow 3 state diagram time management powerpoint 1 design-Arrow, Background, Business, Chart, Diagram, Financial, Flow, Graphic, Gray, Icon, Illustration, Linear, Management, Orange, Perspective, Process, Reflection, Shapes, Stage, Text Erroneous beliefs can be a bane. Be correct and accurate with our Usa Ppt Theme Linear Flow 3 State Diagram Time Management PowerPoint 1 Design.
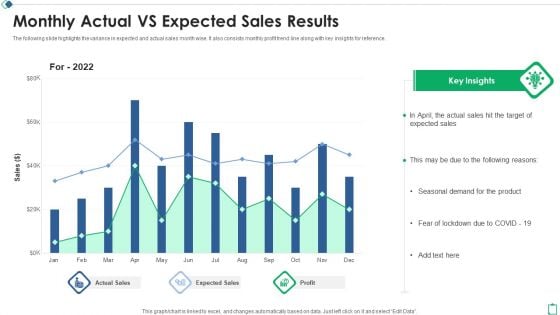
Monthly Actual Vs Expected Sales Results Ppt Show Deck PDF
The following slide highlights the variance in expected and actual sales month wise. It also consists monthly profit trend line along with key insights for reference. Showcasing this set of slides titled Monthly Actual Vs Expected Sales Results Ppt Show Deck PDF. The topics addressed in these templates are Target Expected Sales, Actual Sales Profit, Expected Sales 2022. All the content presented in this PPT design is completely editable. Download it and make adjustments in color, background, font etc. as per your unique business setting.
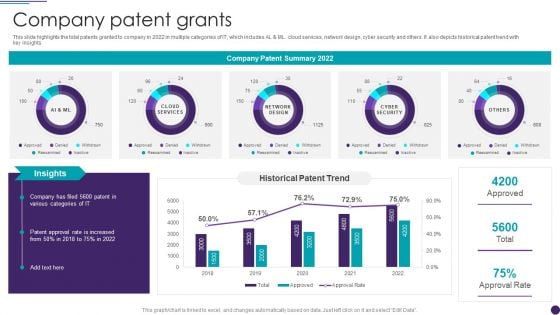
IT Services Business Profile Company Patent Grants Infographics PDF
This slide highlights the total patents granted to company in 2022 in multiple categories of IT, which includes AL and ML. cloud services, network design, cyber security and others. It also depicts historical patent trend with key insights. Deliver an awe inspiring pitch with this creative IT Services Business Profile Company Patent Grants Infographics PDF bundle. Topics like Network Design, Cyber Security, Cloud Services can be discussed with this completely editable template. It is available for immediate download depending on the needs and requirements of the user.
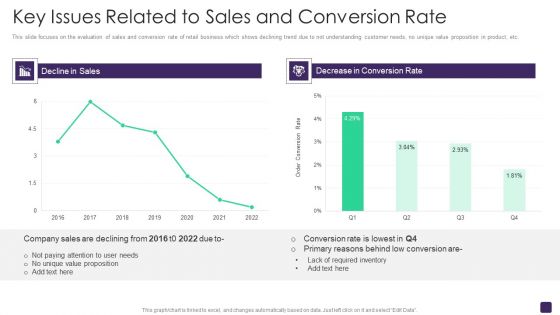
Retail Merchandising Program Key Issues Related To Sales And Conversion Rate Sample PDF
This slide focuses on the evaluation of sales and conversion rate of retail business which shows declining trend due to not understanding customer needs, no unique value proposition in product, etc. Deliver an awe inspiring pitch with this creative Retail Merchandising Program Key Issues Related To Sales And Conversion Rate Sample PDF bundle. Topics like Decline Sales, Decrease Conversion Rate, 2016 To 2022 can be discussed with this completely editable template. It is available for immediate download depending on the needs and requirements of the user.

Personal Care Company Profile Annual Revenue 2018 To 2022 Graphics PDF
This slide highlights the annual revenue of our company in last five years with CAGR from 2018 to 2022 which shows increasing trend due to improved product sales. Deliver and pitch your topic in the best possible manner with this Personal Care Company Profile Annual Revenue 2018 To 2022 Graphics PDF. Use them to share invaluable insights on Annual Revenue, Key Insights, Annual Revenue, 2018 To 2022 and impress your audience. This template can be altered and modified as per your expectations. So, grab it now.
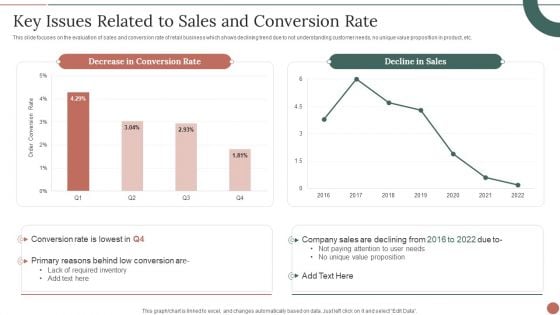
Retail Business Product Planning Procedure Key Issues Related To Sales And Conversion Rate Formats PDF
This slide focuses on the evaluation of sales and conversion rate of retail business which shows declining trend due to not understanding customer needs, no unique value proposition in product, etc. Deliver an awe inspiring pitch with this creative Retail Business Product Planning Procedure Key Issues Related To Sales And Conversion Rate Formats PDF bundle. Topics like Required Inventory, Conversion Rate, Company Sales can be discussed with this completely editable template. It is available for immediate download depending on the needs and requirements of the user.
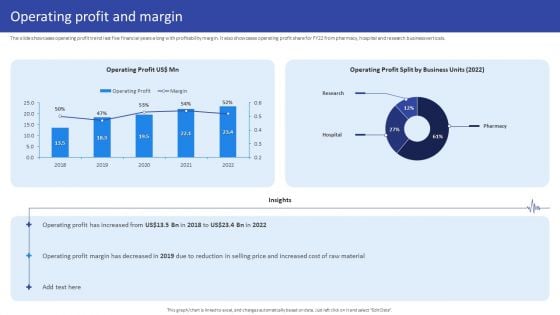
Hospital Medical Research Company Profile Operating Profit And Margin Sample PDF
The slide showcases operating profit trend last five financial years along with profitability margin. It also showcases operating profit share for FY22 from pharmacy, hospital and research business verticals. Deliver and pitch your topic in the best possible manner with this Hospital Medical Research Company Profile Operating Profit And Margin Sample PDF. Use them to share invaluable insights on Operating Profit, Operating Profit Split, Business Units 2022 and impress your audience. This template can be altered and modified as per your expectations. So, grab it now.
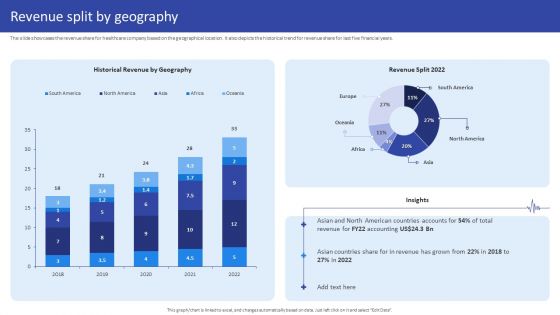
Hospital Medical Research Company Profile Revenue Split By Geography Portrait PDF
The slide showcases the revenue share for healthcare company based on the geographical location. It also depicts the historical trend for revenue share for last five financial years. Deliver and pitch your topic in the best possible manner with this Hospital Medical Research Company Profile Revenue Split By Geography Portrait PDF. Use them to share invaluable insights on Historical Revenue Geography, Revenue Split 2022, 2018 To 2022 and impress your audience. This template can be altered and modified as per your expectations. So, grab it now.
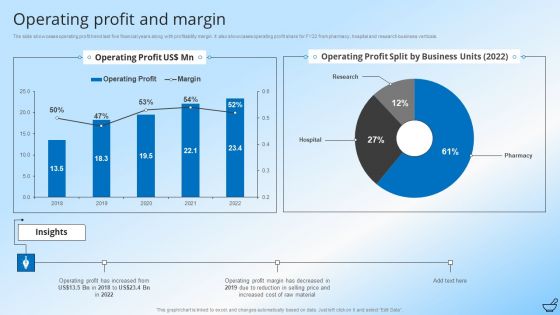
Pharmaceutical And Clinical Research Summary Operating Profit And Margin Microsoft PDF
The slide showcases operating profit trend last five financial years along with profitability margin. It also showcases operating profit share for FY22 from pharmacy, hospital and research business verticals. Deliver and pitch your topic in the best possible manner with this Pharmaceutical And Clinical Research Summary Operating Profit And Margin Microsoft PDF. Use them to share invaluable insights on Operating Profit Margin, Raw Material, Price and impress your audience. This template can be altered and modified as per your expectations. So, grab it now.
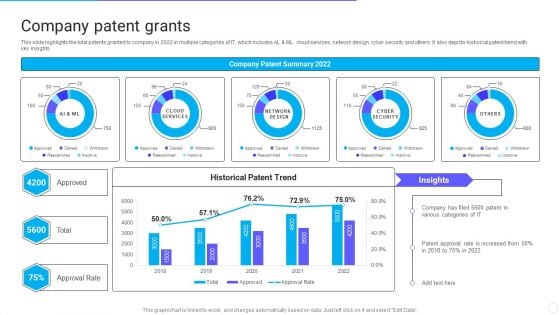
IT Application Services Company Outline Company Patent Grants Introduction PDF
This slide highlights the total patents granted to company in 2022 in multiple categories of IT, which includes AL and ML. cloud services, network design, cyber security and others. It also depicts historical patent trend with key insights. Deliver an awe inspiring pitch with this creative IT Application Services Company Outline Company Patent Grants Introduction PDF bundle. Topics like Approval Rate, Company Patent Grants can be discussed with this completely editable template. It is available for immediate download depending on the needs and requirements of the user.
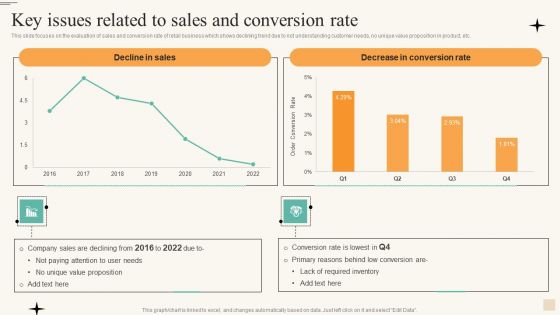
Retail Merchandise Management To Improve Buyer Engagement Key Issues Related Download PDF
This slide focuses on the evaluation of sales and conversion rate of retail business which shows declining trend due to not understanding customer needs, no unique value proposition in product, etc. This Retail Merchandise Management To Improve Buyer Engagement Key Issues Related Download PDF is perfect for any presentation, be it in front of clients or colleagues. It is a versatile and stylish solution for organizing your meetings. The product features a modern design for your presentation meetings. The adjustable and customizable slides provide unlimited possibilities for acing up your presentation. Slidegeeks has done all the homework before launching the product for you. So, do not wait, grab the presentation templates today.
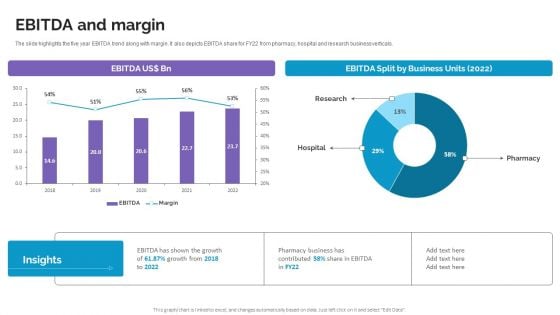
Ebitda And Margin Life Science And Healthcare Solutions Company Profile Template PDF
The slide highlights the five year EBITDA trend along with margin. It also depicts EBITDA share for FY22 from pharmacy, hospital and research business verticals. Slidegeeks has constructed Ebitda And Margin Life Science And Healthcare Solutions Company Profile Template PDF after conducting extensive research and examination. These presentation templates are constantly being generated and modified based on user preferences and critiques from editors. Here, you will find the most attractive templates for a range of purposes while taking into account ratings and remarks from users regarding the content. This is an excellent jumping-off point to explore our content and will give new users an insight into our top-notch PowerPoint Templates.
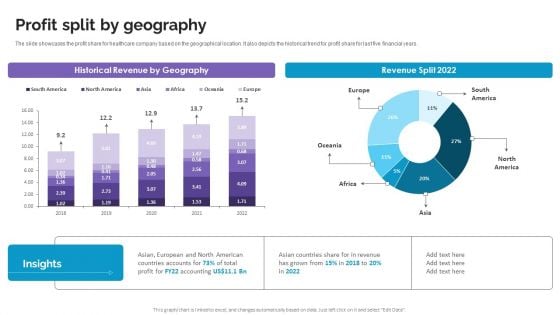
Profit Split By Geography Life Science And Healthcare Solutions Company Profile Graphics PDF
The slide showcases the profit share for healthcare company based on the geographical location. It also depicts the historical trend for profit share for last five financial years. If your project calls for a presentation, then Slidegeeks is your go-to partner because we have professionally designed, easy-to-edit templates that are perfect for any presentation. After downloading, you can easily edit Profit Split By Geography Life Science And Healthcare Solutions Company Profile Graphics PDF and make the changes accordingly. You can rearrange slides or fill them with different images. Check out all the handy templates
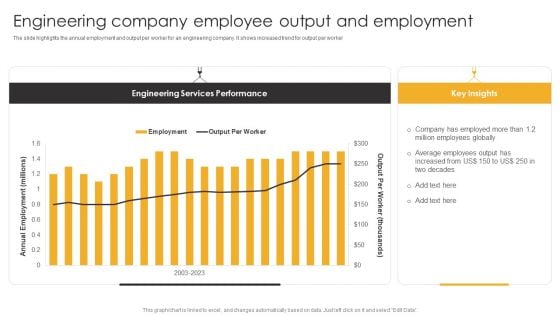
Product Engineering Services Engineering Company Employee Output And Employment Mockup PDF
The slide highlights the annual employment and output per worker for an engineering company. It shows increased trend for output per worker. Create an editable Product Engineering Services Engineering Company Employee Output And Employment Mockup PDF that communicates your idea and engages your audience. Whether youre presenting a business or an educational presentation, pre-designed presentation templates help save time. Product Engineering Services Engineering Company Employee Output And Employment Mockup PDF is highly customizable and very easy to edit, covering many different styles from creative to business presentations. Slidegeeks has creative team members who have crafted amazing templates. So, go and get them without any delay.
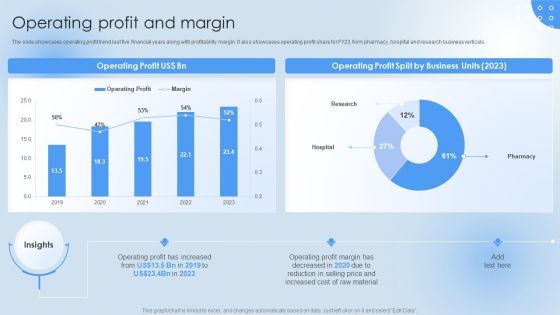
Pharmaceutical Company Financial Summary Operating Profit And Margin Background PDF
The slide showcases operating profit trend last five financial years along with profitability margin. It also showcases operating profit share for FY23 from pharmacy, hospital and research business verticals. Present like a pro with Pharmaceutical Company Financial Summary Operating Profit And Margin Background PDF Create beautiful presentations together with your team, using our easy-to-use presentation slides. Share your ideas in real-time and make changes on the fly by downloading our templates. So whether youre in the office, on the go, or in a remote location, you can stay in sync with your team and present your ideas with confidence. With Slidegeeks presentation got a whole lot easier. Grab these presentations today.
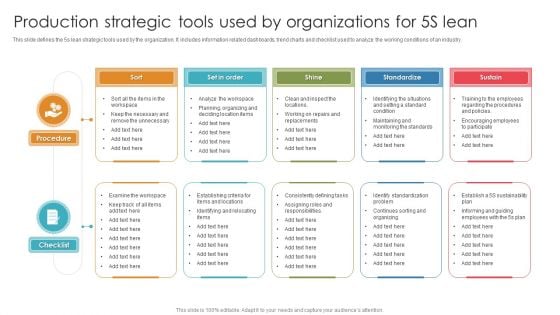
Production Strategic Tools Used By Organizations For 5S Lean Ppt Infographics Microsoft PDF
This slide defines the 5s lean strategic tools used by the organization. It includes information related dashboards, trend charts and checklist used to analyze the working conditions of an industry. Pitch your topic with ease and precision using this Production Strategic Tools Used By Organizations For 5S Lean Ppt Infographics Microsoft PDF. This layout presents information on Procedure, Checklist, Standardize. It is also available for immediate download and adjustment. So, changes can be made in the color, design, graphics or any other component to create a unique layout.
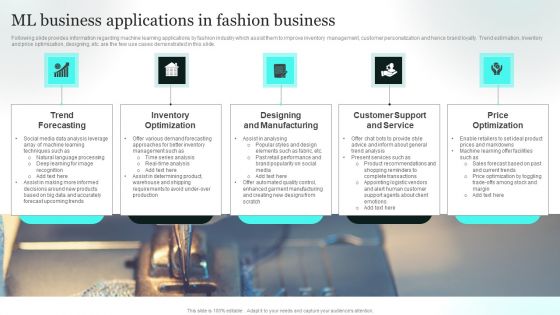
ML Business Applications In Fashion Business Background PDF
Following slide provides information regarding machine learning applications by fashion industry which assist them to improve inventory management, customer personalization and hence brand loyalty. Trend estimation, inventory and price optimization, designing, etc. are the few use cases demonstrated in this slide. Showcasing this set of slides titled ML Business Applications In Fashion Business Background PDF. The topics addressed in these templates are Designing And Manufacturing, Customer Support And Service, Price Optimization. All the content presented in this PPT design is completely editable. Download it and make adjustments in color, background, font etc. as per your unique business setting.
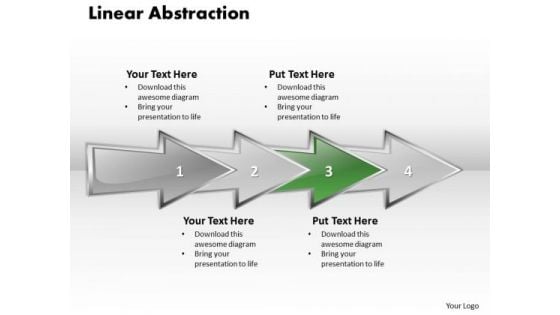
Ppt Linear Abstraction Arrow Animated Graph PowerPoint 2007 Templates
PPT linear abstraction arrow animated graph powerpoint 2007 Templates-Use this diagram to show a progression or sequential steps in a task, process, or workflow. They help to lay the base of your trend of thought and enhance the essence of your viable ideas. Create captivating presentations to deliver comparative and weighted arguments.-PPT linear abstraction arrow animated graph powerpoint 2007 Templates-analysis, arrow, background, business, chart, communication, concept, construction, delivery, design, development, engineering, fabrication, feasibiliti, generated, growth, idea, industry, making, production, products, science, sequence, shape Realign your team with our Ppt Linear Abstraction Arrow Animated Graph PowerPoint 2007 Templates. Download without worries with our money back guaranteee.
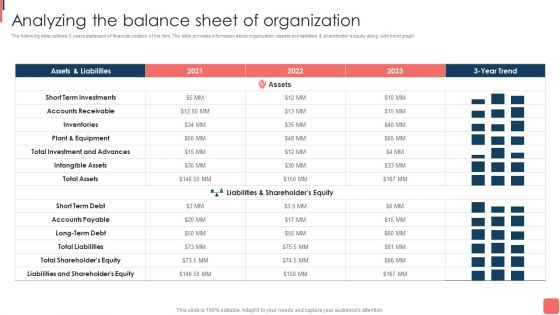
Effective Financial Planning Assessment Techniques Analyzing The Balance Sheet Of Organization Slides PDF
The following slide outlines 3 years statement of financial position of the firm. The slide provides information about organization assets and liabilities shareholders equity along with trend graph. From laying roadmaps to briefing everything in detail, our templates are perfect for you. You can set the stage with your presentation slides. All you have to do is download these easy-to-edit and customizable templates. Effective Financial Planning Assessment Techniques Analyzing The Balance Sheet Of Organization Slides PDF will help you deliver an outstanding performance that everyone would remember and praise you for. Do download this presentation today.
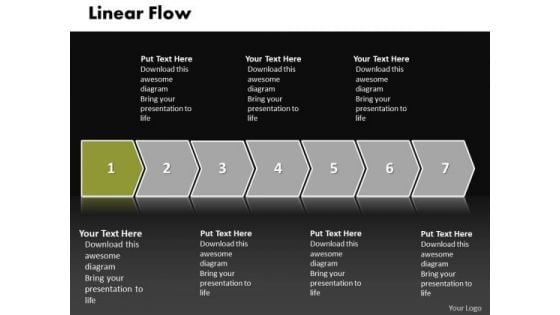
Ppt Linear Flow Illustration Practice The PowerPoint Macro Steps Of An Action Templates
PPT linear flow illustration practice the powerpoint macro steps of an action Templates-This image represents the concept of structured analysis technique that employs a set of visual representations of the data that moves through the organization. This helps you to lay the base of your trend of thought-PPT linear flow illustration practice the powerpoint macro steps of an action Templates-3d, Arrow, Background, Banner, Business, Chart, Colorful, Diagram, Direction, Element, Financial, Flow, Gradient, Illustration, Isolated, Mirrored, Placeholder, Presentation, Process, Steps Our Ppt Linear Flow Illustration Practice The PowerPoint Macro Steps Of An Action Templates cater for different factions. They assist in finding common ground.
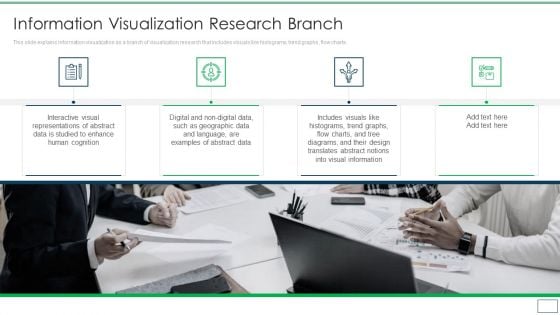
Departments Of Visualization Research Information Visualization Research Branch Clipart PDF
This slide explains information visualization as a branch of visualization research that includes visuals like histograms, trend graphs, flow charts.Presenting Departments Of Visualization Research Information Visualization Research Branch Clipart PDF to provide visual cues and insights. Share and navigate important information on four stages that need your due attention. This template can be used to pitch topics like Interactive Visual, Representations Of Abstract, Information In addtion, this PPT design contains high resolution images, graphics, etc, that are easily editable and available for immediate download.
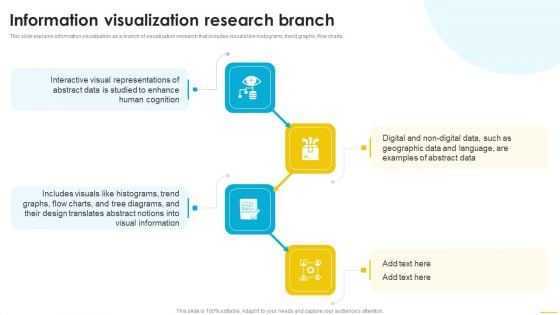
Information Visualization Research Branch Template PDF
This slide explains information visualization as a branch of visualization research that includes visuals like histograms, trend graphs, flow charts. Slidegeeks is here to make your presentations a breeze with Information Visualization Research Branch Template PDF With our easy to use and customizable templates, you can focus on delivering your ideas rather than worrying about formatting. With a variety of designs to choose from, you are sure to find one that suits your needs. And with animations and unique photos, illustrations, and fonts, you can make your presentation pop. So whether you are giving a sales pitch or presenting to the board, make sure to check out Slidegeeks first.
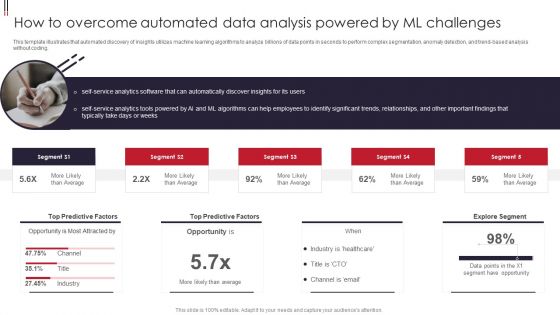
Information Visualizations Playbook How To Overcome Automated Data Analysis Powered By Ml Challenges Professional PDF
This template illustrates that automated discovery of insights utilizes machine learning algorithms to analyze billions of data points in seconds to perform complex segmentation, anomaly detection, and trend based analysis without coding. Presenting Information Visualizations Playbook How To Overcome Automated Data Analysis Powered By Ml Challenges Professional PDF to provide visual cues and insights. Share and navigate important information on five stages that need your due attention. This template can be used to pitch topics like Average, Opportunity, Analytics Tools. In addtion, this PPT design contains high resolution images, graphics, etc, that are easily editable and available for immediate download.
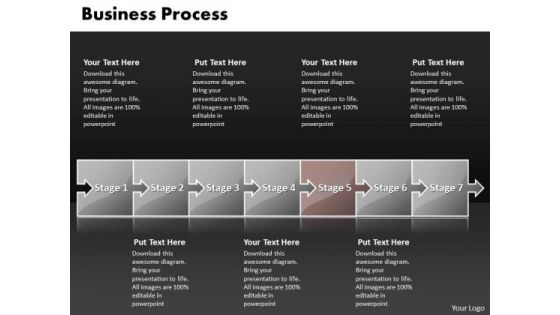
Ppt Puzzle Business PowerPoint Presentation Flow Of Process Diagarm Templates
PPT puzzle business powerpoint presentation flow of process diagarm Templates-Develop competitive advantage with our above template which contains a Puzzle diagram illustrating seven stages in a process. It helps to lay the base of your trend of thought-PPT puzzle business powerpoint presentation flow of process diagarm Templates-Abstract, Arrow, Backgrounds, Business, Computer, Concepts, Connection, Cooperation, Creativity, Crowd, Design, Digital, Digitally, Electric, Equalizer, Generated, Graph, Graphic, Group, Icon, Ideas, Illustration, Image, Individuality, Isolated, Leader, Leadership, Link, Motivation, Music, Objects, Order, Part, Pattern, Piece, Playing, Puzzle Our Ppt Puzzle Business PowerPoint Presentation Flow Of Process Diagarm Templates will help achieve fame. You will be well known for your erudition.
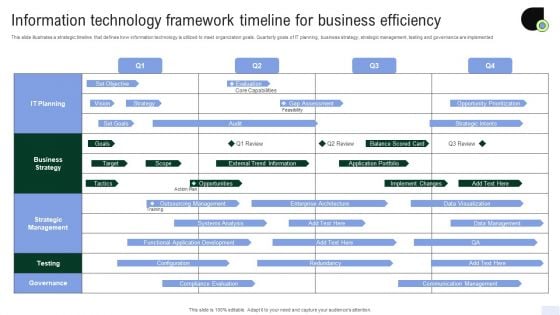
Information Technology Framework Timeline For Business Efficiency Sample PDF

Change Administration Strategies Introduction To The Playbook Infographics PDF
Purpose of the following slide is to provide an overview of the entire playbook as it provides brief introduction of digital transformation as a latest trend of the industry. The following also provides a page wise description of multiple sections of the playbook. Deliver and pitch your topic in the best possible manner with this Change Administration Strategies Introduction To The Playbook Infographics PDF. Use them to share invaluable insights on Executing Transformation Strategy, Develop Roadmap, Executing Vision and impress your audience. This template can be altered and modified as per your expectations. So, grab it now.


 Continue with Email

 Home
Home


