Market Trends
7 Levels Infographics For Distributorship For Sale Ppt PowerPoint Presentation Icon Layouts PDF
Persuade your audience using this 7 levels infographics for distributorship for sale ppt powerpoint presentation icon layouts pdf. This PPT design covers seven stages, thus making it a great tool to use. It also caters to a variety of topics including 7 levels infographics for distributorship for sale. Download this PPT design now to present a convincing pitch that not only emphasizes the topic but also showcases your presentation skills.
Sales Department Online Meeting For Target Achievement Ppt PowerPoint Presentation Icon Infographics PDF
Persuade your audience using this sales department online meeting for target achievement ppt powerpoint presentation icon infographics pdf. This PPT design covers five stages, thus making it a great tool to use. It also caters to a variety of topics including sales department online meeting for target achievement. Download this PPT design now to present a convincing pitch that not only emphasizes the topic but also showcases your presentation skills.
Artificial Intelligence Applications And Advantages For Sales Management Icon Information PDF
Persuade your audience using this Artificial Intelligence Applications And Advantages For Sales Management Icon Information PDF. This PPT design covers three stages, thus making it a great tool to use. It also caters to a variety of topics including Artificial Intelligence, Applications Advantages, Sales Management. Download this PPT design now to present a convincing pitch that not only emphasizes the topic but also showcases your presentation skills.
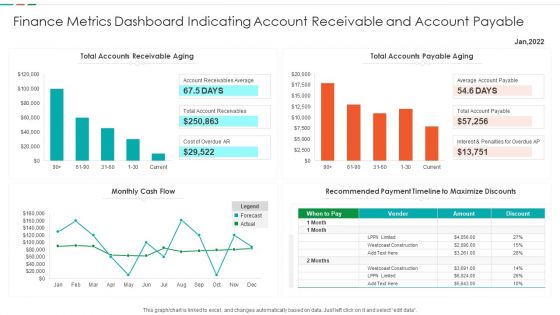
Finance Metrics Dashboard Indicating Account Receivable And Account Payable Demonstration PDF
This graph or chart is linked to excel, and changes automatically based on data. Just left click on it and select edit data. Showcasing this set of slides titled Finance Metrics Dashboard Indicating Account Receivable And Account Payable Demonstration PDF. The topics addressed in these templates are Total Accounts Receivable, Total Accounts Payable, Recommended Payment Timeline, Monthly Cash Flow. All the content presented in this PPT design is completely editable. Download it and make adjustments in color, background, font etc. as per your unique business setting.
Revenue Split By Country Location Ppt PowerPoint Presentation Icon Deck
Presenting this set of slides with name revenue split by country location ppt powerpoint presentation icon deck. This is a five stage process. The stages in this process are location, information, geography, management, strategy. This is a completely editable PowerPoint presentation and is available for immediate download. Download now and impress your audience.
Location Geography Ppt PowerPoint Presentation Icon Clipart
Presenting this set of slides with name location geography ppt powerpoint presentation icon clipart. This is a four stage process. The stages in this process are location. This is a completely editable PowerPoint presentation and is available for immediate download. Download now and impress your audience.
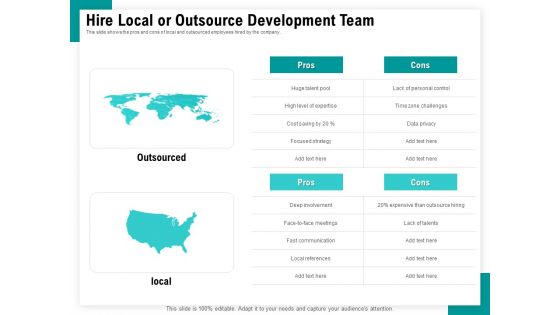
Android Framework For Apps Development And Deployment Hire Local Or Outsource Development Team Ppt Show Deck PDF
Presenting this set of slides with name android framework for apps development and deployment hire local or outsource development team ppt show deck pdf. This is a two stage process. The stages in this process are outsourced, local. This is a completely editable PowerPoint presentation and is available for immediate download. Download now and impress your audience.
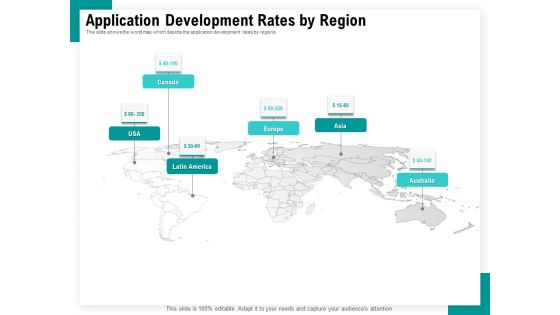
Android Framework For Apps Development And Deployment Application Development Rates By Region Slides PDF
Presenting this set of slides with name android framework for apps development and deployment application development rates by region slides pdf. This is a six stage process. The stages in this process are application development rates region. This is a completely editable PowerPoint presentation and is available for immediate download. Download now and impress your audience.
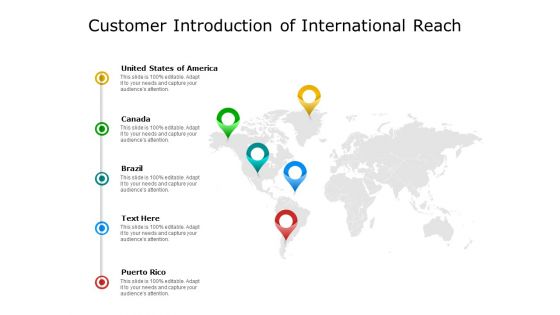
Customer Introduction Of International Reach Ppt PowerPoint Presentation Outline Rules PDF
Presenting customer introduction of international reach ppt powerpoint presentation outline rules pdf to dispense important information. This template comprises five stages. It also presents valuable insights into the topics including united states of america, canada, brazil, puerto rico. This is a completely customizable PowerPoint theme that can be put to use immediately. So, download it and address the topic impactfully.
Optimizing Traditional Media To Boost Sales Direct Mail Campaign Checklist For Lead Generation Icons PDF
Whether you have daily or monthly meetings, a brilliant presentation is necessary. Optimizing Traditional Media To Boost Sales Direct Mail Campaign Checklist For Lead Generation Icons PDF can be your best option for delivering a presentation. Represent everything in detail using Optimizing Traditional Media To Boost Sales Direct Mail Campaign Checklist For Lead Generation Icons PDF and make yourself stand out in meetings. The template is versatile and follows a structure that will cater to your requirements. All the templates prepared by Slidegeeks are easy to download and edit. Our research experts have taken care of the corporate themes as well. So, give it a try and see the results.
Business Sales Process With Influence Buying Ppt PowerPoint Presentation Icon Ideas PDF
This template covers about identifying qualified leads as per requirements with influencing for successfully converting the sales. This is a business sales process with influence buying ppt powerpoint presentation icon ideas pdf template with various stages. Focus and dispense information on five stages using this creative set, that comes with editable features. It contains large content boxes to add your information on topics like sale, assess needs, influence buying. You can also showcase facts, figures, and other relevant content using this PPT layout. Grab it now.
Challenges Faced By Sales Channel Partners Ppt Icon Layout Ideas PDF
This slide covers the challenges faced by sales channel partners such as channel conflict, finding right technology, underperforming partners, misaligned goals, etc. This is a challenges faced by sales channel partners ppt icon layout ideas pdf template with various stages. Focus and dispense information on four stages using this creative set, that comes with editable features. It contains large content boxes to add your information on topics like technology, misaligned goals, sales, customer. You can also showcase facts, figures, and other relevant content using this PPT layout. Grab it now.
Remuneration Strategy For Multiple Sales Position Ppt Icon Background Designs PDF
The following slide highlights the commission scheme for multiple sales position. It illustrates positions, base pay, commission and target pay, where positions includes sales development representative, account executive, customer success manger and area manager. Pitch your topic with ease and precision using this Remuneration Strategy For Multiple Sales Position Ppt Icon Background Designs PDF. This layout presents information on Amount Executive, Reporting, Commission Scheme. It is also available for immediate download and adjustment. So, changes can be made in the color, design, graphics or any other component to create a unique layout.
Manpower Corporate Security Business Profile Sales Revenue By Region And Services Icons PDF
This slide highlights the security company sales revenue by region and services. It showcases retail mall security, social event security, university hospital security, executive protection and building security. Deliver and pitch your topic in the best possible manner with this Manpower Corporate Security Business Profile Sales Revenue By Region And Services Icons PDF. Use them to share invaluable insights on Sales Revenue, Region And Services and impress your audience. This template can be altered and modified as per your expectations. So, grab it now.
Competitive Sales Analysis Of SBU Management Ppt PowerPoint Presentation Icon Maker PDF
The following slide presents competitive view of annual sales of different SBUs to assess their performance and suitably take strategic decisions. It also includes key insight for reference.Showcasing this set of slides titled Competitive Sales Analysis Of SBU Management Ppt PowerPoint Presentation Icon Maker PDF. The topics addressed in these templates are Generate Maximum, Decrease Sales, Key Insights. All the content presented in this PPT design is completely editable. Download it and make adjustments in color, background, font etc. as per your unique business setting.
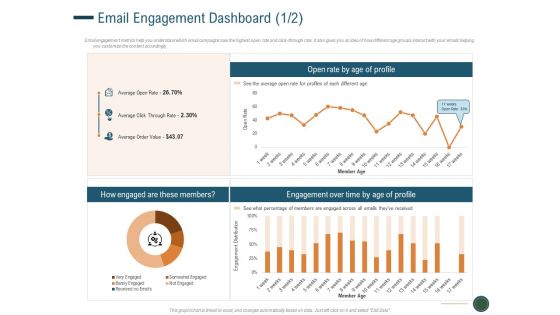
Enhance Profit Client Journey Analysis Email Engagement Dashboard Slides PDF
Email engagement metrics help you understand which email campaigns saw the highest open rate and click-through rate. It also gives you an idea of how different age groups interact with your emails helping you customize the content accordingly. Deliver and pitch your topic in the best possible manner with this enhance profit client journey analysis email engagement dashboard slides pdf. Use them to share invaluable insights on engagement over time by age of profile, open rate by age of profile and impress your audience. This template can be altered and modified as per your expectations. So, grab it now.
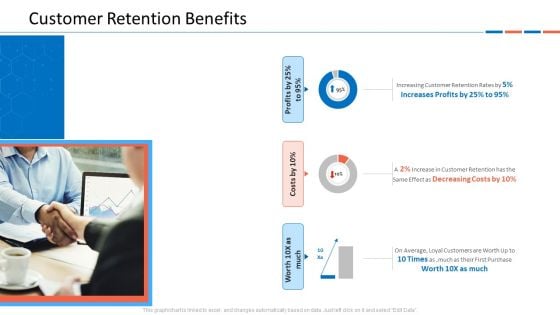
Customer Relationship Management Dashboard Customer Retention Benefits Inspiration PDF
This graph or chart is linked to excel, and changes automatically based on data. Just left click on it and select Edit Data.Deliver an awe inspiring pitch with this creative customer relationship management dashboard customer retention benefits inspiration pdf bundle. Topics like increasing customer retention rates, on average, loyal customers are worth up to 10 times as ,much as their first purchase, profits by 25percent to 95percent can be discussed with this completely editable template. It is available for immediate download depending on the needs and requirements of the user.
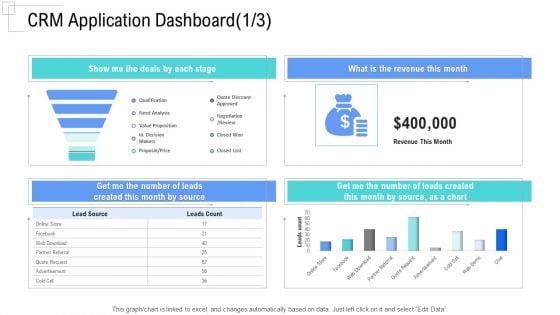
Managing Customer Experience CRM Application Dashboard Month Mockup PDF
This graph or chart is linked to excel, and changes automatically based on data. Just left click on it and select Edit Data.Deliver an awe-inspiring pitch with this creative managing customer experience crm application dashboard month mockup pdf bundle. Topics like show me the deals by each stage, what is the revenue this month, get me the number of leads created this month by source can be discussed with this completely editable template. It is available for immediate download depending on the needs and requirements of the user.
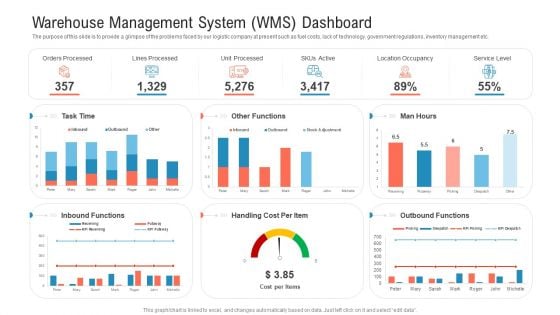
Warehouse Management System Wms Dashboard Cost Summary PDF
The purpose of this slide is to provide a glimpse of the problems faced by our logistic company at present such as fuel costs, lack of technology, government regulations, inventory management etc. Deliver and pitch your topic in the best possible manner with this warehouse management system wms dashboard cost summary pdf. Use them to share invaluable insights on orders processed, lines processed, unit processed, skus active, location occupancy and impress your audience. This template can be altered and modified as per your expectations. So, grab it now.
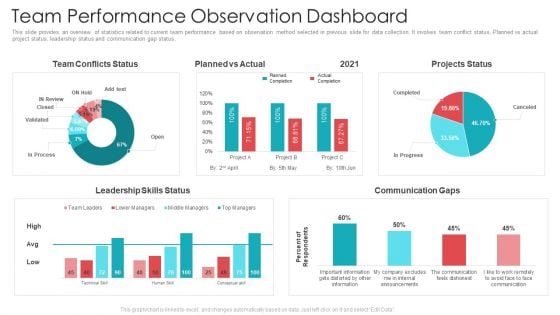
Official Team Collaboration Plan Team Performance Observation Dashboard Background PDF
This slide provides an overview of statistics related to current team performance based on observation method selected in previous slide for data collection. It involves team conflict status, Planned vs actual project status, leadership status and communication gap status. Deliver an awe-inspiring pitch with this creative official team collaboration plan team performance observation dashboard background pdf bundle. Topics like leadership skills status, team conflicts status, communication gaps can be discussed with this completely editable template. It is available for immediate download depending on the needs and requirements of the user.
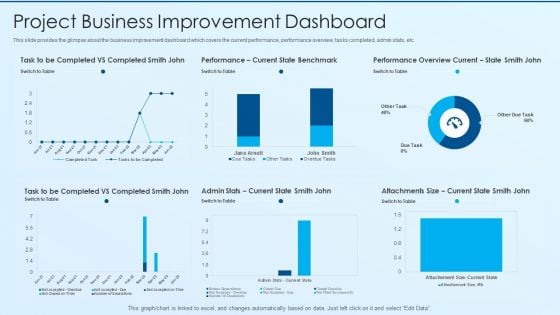
Process Advancement Scheme Project Business Improvement Dashboard Mockup PDF
This slide provides the glimpse about the factors which leads to software project failure such as lack of user participation, changing requirements, unclear objectives, lack of talent people, poor governance, etc. Deliver and pitch your topic in the best possible manner with this process advancement scheme project business improvement dashboard mockup pdf. Use them to share invaluable insights on lack user participation, changing requirement, unclear objectives and impress your audience. This template can be altered and modified as per your expectations. So, grab it now.
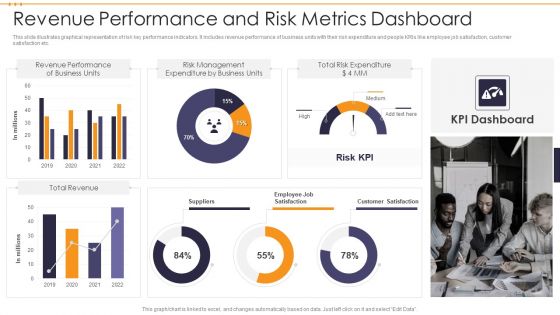
Revenue Performance And Risk Metrics Dashboard Demonstration PDF
This slide illustrates graphical representation of risk key performance indicators. It includes revenue performance of business units with their risk expenditure and people KRIs like employee job satisfaction, customer satisfaction etc. Showcasing this set of slides titled Revenue Performance And Risk Metrics Dashboard Demonstration PDF. The topics addressed in these templates are Total Risk Expenditure, Risk Management, Revenue Performance . All the content presented in this PPT design is completely editable. Download it and make adjustments in color, background, font etc. as per your unique business setting.
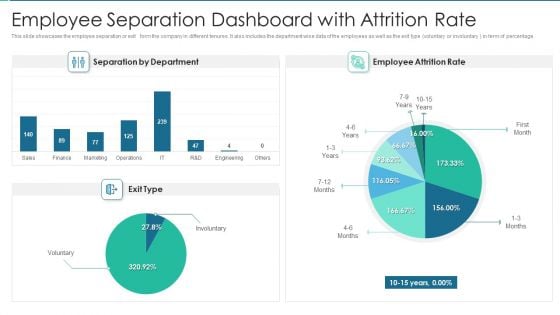
Employee Separation Dashboard With Attrition Rate Elements PDF
This slide showcases the employee separation or exit form the company in different tenures. It also includes the department wise data of the employees as well as the exit type voluntary or involuntary in term of percentage.Showcasing this set of slides titled Employee Separation Dashboard With Attrition Rate Elements PDF The topics addressed in these templates are Separation By Department, Employee Attrition Rate All the content presented in this PPT design is completely editable. Download it and make adjustments in color, background, font etc. as per your unique business setting.
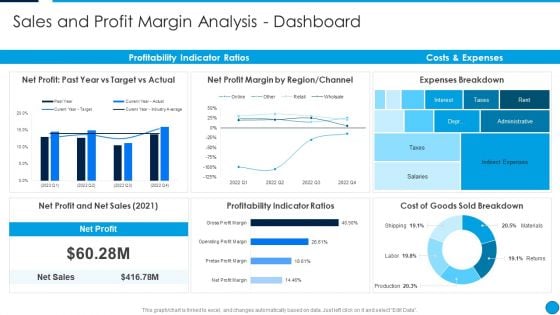
Summary Financial Sales And Profit Margin Analysis Dashboard Pictures PDF
This graph or chart is linked to excel, and changes automatically based on data. Just left click on it and select Edit Data. Deliver an awe inspiring pitch with this creative Summary Financial Sales And Profit Margin Analysis Dashboard Pictures PDF bundle. Topics like Net Profit, Past Year Vs Target Vs Actual, Net Profit Margin By Region, Channel, Expenses Breakdown, Costs And Expenses, Profitability Indicator Ratios can be discussed with this completely editable template. It is available for immediate download depending on the needs and requirements of the user.
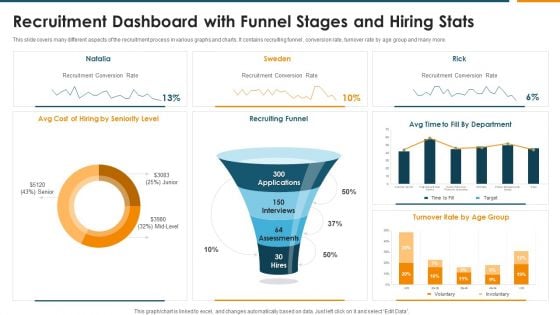
Recruitment Dashboard With Funnel Stages And Hiring Stats Rules PDF
This slide covers many different aspects of the recruitment process in various graphs and charts. It contains recruiting funnel , conversion rate, turnover rate by age group and many more. Pitch your topic with ease and precision using this Recruitment Dashboard With Funnel Stages And Hiring Stats Rules PDF. This layout presents information on Recruiting Funnel, Recruitment Conversion Rate, Seniority Level. It is also available for immediate download and adjustment. So, changes can be made in the color, design, graphics or any other component to create a unique layout.
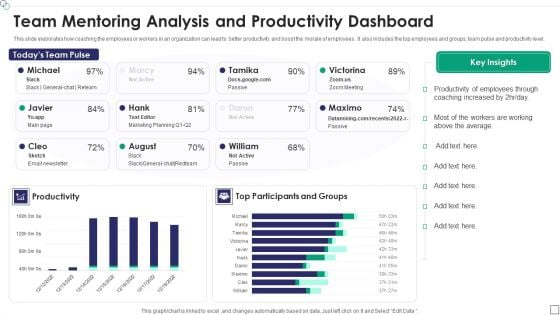
Team Mentoring Analysis And Productivity Dashboard Template PDF
This slide elaborates how coaching the employees or workers in an organization can lead to better productivity and boost the morale of employees . It also includes the top employees and groups, team pulse and productivity level.Showcasing this set of slides titled Team Mentoring Analysis And Productivity Dashboard Template PDF The topics addressed in these templates are Productivity Of Employees, Coaching Increased, Productivity All the content presented in this PPT design is completely editable. Download it and make adjustments in color, background, font etc. as per your unique business setting.
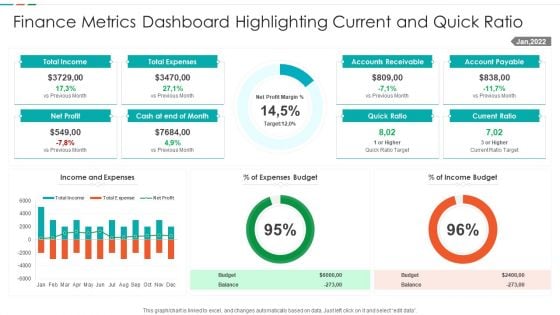
Finance Metrics Dashboard Highlighting Current And Quick Ratio Template PDF
This graph or chart is linked to excel, and changes automatically based on data. Just left click on it and select edit data. Showcasing this set of slides titled Finance Metrics Dashboard Highlighting Current And Quick Ratio Template PDF. The topics addressed in these templates are Total Income Budget, Total Expenses Balance, Net Profit Quick, Ratio Current Ratio. All the content presented in this PPT design is completely editable. Download it and make adjustments in color, background, font etc. as per your unique business setting.
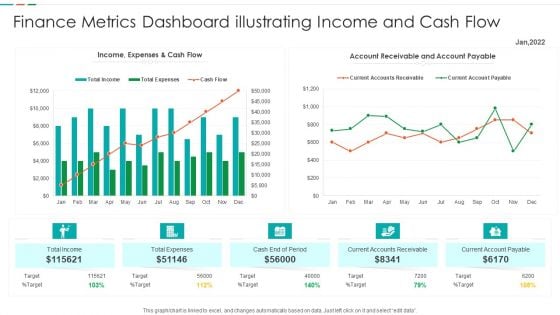
Finance Metrics Dashboard Illustrating Income And Cash Flow Template PDF
This graph or chart is linked to excel, and changes automatically based on data. Just left click on it and select edit data. Pitch your topic with ease and precision using this Finance Metrics Dashboard Illustrating Income And Cash Flow Template PDF. This layout presents information on Current Accounts Receivable, Current Account Payable, Cash End Period, Account Receivable Account. It is also available for immediate download and adjustment. So, changes can be made in the color, design, graphics or any other component to create a unique layout.
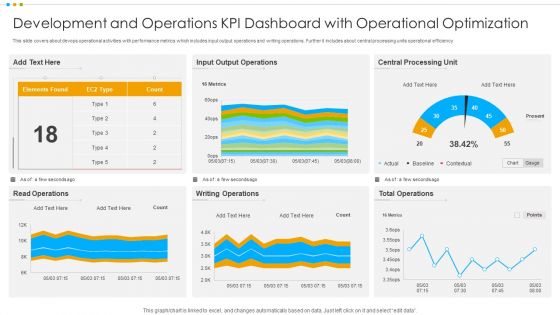
Development And Operations KPI Dashboard With Operational Optimization Pictures PDF
This slide covers about devops operational activities with performance metrics which includes input output operations and writing operations. Further it includes about central processing units operational efficiency.Pitch your topic with ease and precision using this Development And Operations KPI Dashboard With Operational Optimization Pictures PDF This layout presents information on Output Operations, Central Processing, Total Operations It is also available for immediate download and adjustment. So, changes can be made in the color, design, graphics or any other component to create a unique layout.

Home Insurance Analytics Statistics With Settlement Time Dashboard Ideas PDF
This slide illustrates home insurance facts and figures of the organization. It includes monthly claim volume, claim status, average notification time, acknowledged time, decision time etc. Pitch your topic with ease and precision using this Home Insurance Analytics Statistics With Settlement Time Dashboard Ideas PDF. This layout presents information on Average Acknowledged Time, Average Decision Time, Average Lead Time. It is also available for immediate download and adjustment. So, changes can be made in the color, design, graphics or any other component to create a unique layout.
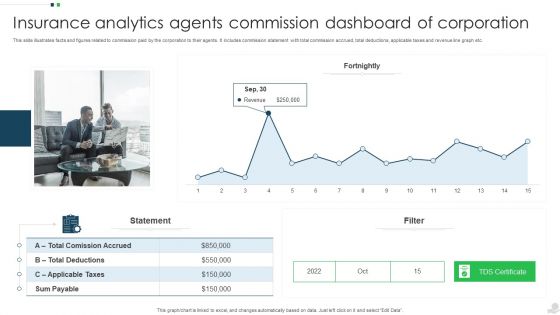
Insurance Analytics Agents Commission Dashboard Of Corporation Introduction PDF
This slide illustrates facts and figures related to commission paid by the corporation to their agents. It includes commission statement with total commission accrued, total deductions, applicable taxes and revenue line graph etc. Pitch your topic with ease and precision using this Insurance Analytics Agents Commission Dashboard Of Corporation Introduction PDF. This layout presents information on Applicable Taxes, Sum Payable, Revenue. It is also available for immediate download and adjustment. So, changes can be made in the color, design, graphics or any other component to create a unique layout.
Insurance Analytics Enrollment Around The World Dashboard Icons PDF
This slide illustrates total insurance enrollment of all insurance corporations. It includes monthly enrollment charts, enrollments in 2021, enrollment by scheme, enrollment levels, worldwide enrollments, enrollment age wise etc. Showcasing this set of slides titled Insurance Analytics Enrollment Around The World Dashboard Icons PDF. The topics addressed in these templates are Enrollments Levels, Enrollments Worldwide, Enrollments Age Wise. All the content presented in this PPT design is completely editable. Download it and make adjustments in color, background, font etc. as per your unique business setting.
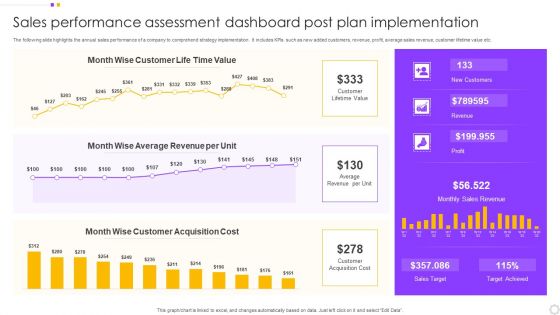
Sales Performance Assessment Dashboard Post Plan Implementation Introduction PDF
The following slide highlights the annual sales performance of a company to comprehend strategy implementation. It includes KPIs such as new added customers, revenue, profit, average sales revenue, customer lifetime value etc. Pitch your topic with ease and precision using this Sales Performance Assessment Dashboard Post Plan Implementation Introduction PDF. This layout presents information on Customer, Value, Average Revenue. It is also available for immediate download and adjustment. So, changes can be made in the color, design, graphics or any other component to create a unique layout.
Remarketing Techniques Dashboard For Tracking Facebook Retargeting Campaign Sample PDF
This slide covers metrics for analysing the results of Facebook retargeting campaign. It includes KPIs such as ad spend, cost per click, click-through rate, ad reach, post engagement, ad clicks, ad impressions, link clicks, etc. Deliver an awe inspiring pitch with this creative Remarketing Techniques Dashboard For Tracking Facebook Retargeting Campaign Sample PDF bundle. Topics like Ad Spend, Cost Per Thousand, Cost Per Click, Clicks Through Rate can be discussed with this completely editable template. It is available for immediate download depending on the needs and requirements of the user.
Remarketing Techniques Dashboard For Tracking Instagram Retargeting Campaign Slides PDF
This slide covers metrics for analysing the results of the Instagram retargeting campaign. It includes KPIs such as amount spend, total reach, total impressions, website clicks, page likes, ad clicks, post reactions, etc. Deliver and pitch your topic in the best possible manner with this Remarketing Techniques Dashboard For Tracking Instagram Retargeting Campaign Slides PDF. Use them to share invaluable insights on Latest Campaigns, Ad Placement, Total Amount Spent and impress your audience. This template can be altered and modified as per your expectations. So, grab it now.
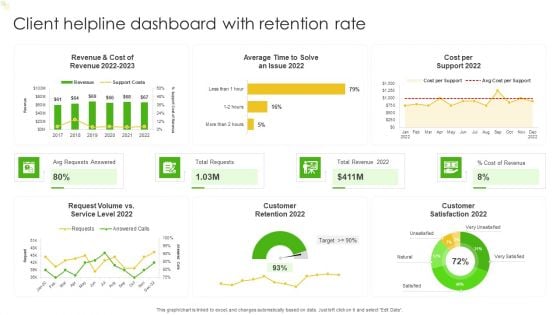
Client Helpline Dashboard With Retention Rate Ppt Gallery Ideas PDF
This graph or chart is linked to excel, and changes automatically based on data. Just left click on it and select Edit Data. Pitch your topic with ease and precision using this Client Helpline Dashboard With Retention Rate Ppt Gallery Ideas PDF. This layout presents information on Cost per Support 2022, Total Requests, Total Revenue 2022, Avg Requests Answered. It is also available for immediate download and adjustment. So, changes can be made in the color, design, graphics or any other component to create a unique layout.

Healthcare Big Data Assessment Dashboard Slide2 Introduction PDF
This slide covers the records about the patients used to describe massive volumes of information created by the adoption of digital technologies that collect patients records and help in managing hospital performance. Showcasing this set of slides titled Healthcare Big Data Assessment Dashboard Slide2 Introduction PDF. The topics addressed in these templates are Forecasted Patient Turnover, Service Indicators, Occupancy. All the content presented in this PPT design is completely editable. Download it and make adjustments in color, background, font etc. as per your unique business setting.
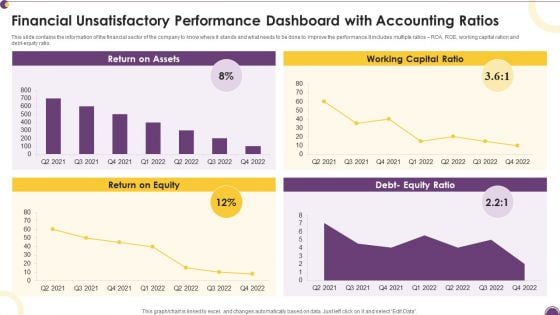
Financial Unsatisfactory Performance Dashboard With Accounting Ratios Diagrams PDF
This slide contains the information of the financial sector of the company to know where it stands and what needs to be done to improve the performance.It includes multiple ratios ROA, ROE, working capital ration and debt-equity ratio. Pitch your topic with ease and precision using this Financial Unsatisfactory Performance Dashboard With Accounting Ratios Diagrams PDF. This layout presents information on Return Assets, Working Capital, Return Equity. It is also available for immediate download and adjustment. So, changes can be made in the color, design, graphics or any other component to create a unique layout.
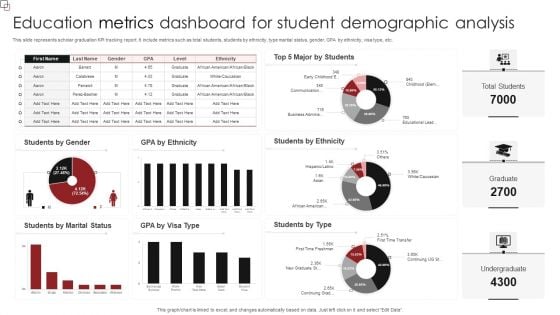
Education Metrics Dashboard For Student Demographic Analysis Diagrams PDF
This slide represents scholar graduation KPI tracking report. It include metrics such as total students, students by ethnicity, type marital status, gender, GPA by ethnicity, visa type, etc. Showcasing this set of slides titled Education Metrics Dashboard For Student Demographic Analysis Diagrams PDF. The topics addressed in these templates are Students Ethnicity, Students Type, Students Marital Status. All the content presented in this PPT design is completely editable. Download it and make adjustments in color, background, font etc. as per your unique business setting.
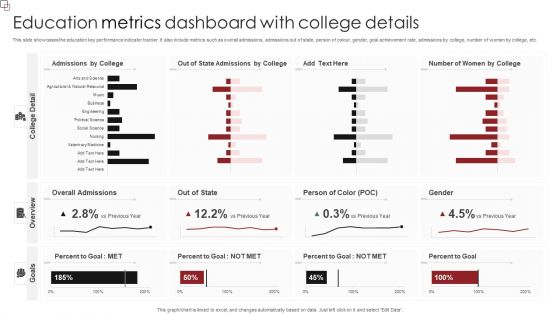
Education Metrics Dashboard With College Details Formats PDF
This slide showcases the education key performance indicator tracker. It also include metrics such as overall admissions, admissions out of state, person of colour, gender, goal achievement rate, admissions by college, number of women by college, etc. Pitch your topic with ease and precision using this Education Metrics Dashboard With College Details Formats PDF. This layout presents information on Overall Admissions, Person Of Color, Percent To Goal. It is also available for immediate download and adjustment. So, changes can be made in the color, design, graphics or any other component to create a unique layout.
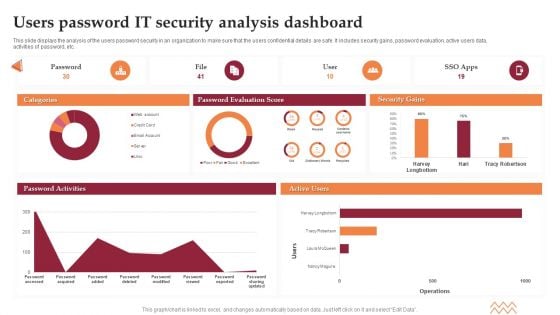
Users Password IT Security Analysis Dashboard Elements PDF
This slide displays the analysis of the users password security in an organization to make sure that the users confidential details are safe. It includes security gains, password evaluation, active users data, activities of password, etc. Showcasing this set of slides titled Users Password IT Security Analysis Dashboard Elements PDF. The topics addressed in these templates are Password Evaluation Score, Security Gains. All the content presented in this PPT design is completely editable. Download it and make adjustments in color, background, font etc. as per your unique business setting.
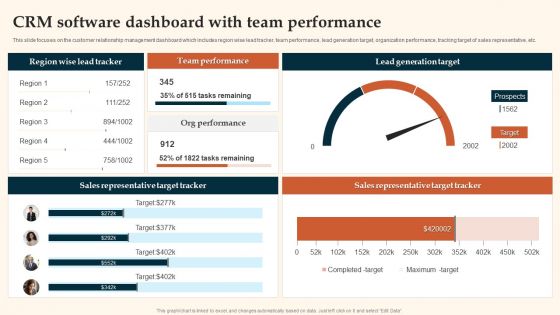
Crm Software Dashboard With Team Performance Topics PDF
This slide shows the using customer relationship management tool for managing their database which includes name of customer, bio, social profiles, creation date, last seen, country, total visits and plan. Showcasing this set of slides titled Crm Software Dashboard With Team Performance Topics PDF. The topics addressed in these templates are Competitive Customer Relationship Tool, Customer Database Management. All the content presented in this PPT design is completely editable. Download it and make adjustments in color, background, font etc. as per your unique business setting.
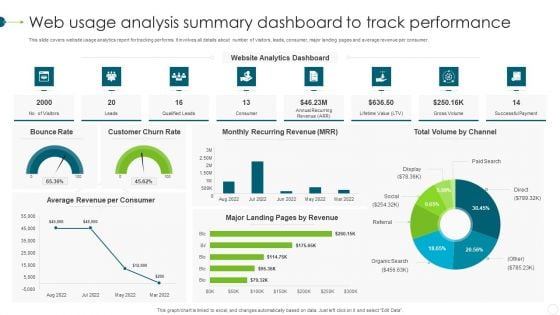
Web Usage Analysis Summary Dashboard To Track Performance Background PDF
This slide covers website usage analytics report for tracking performs. It involves all details about number of visitors, leads, consumer, major landing pages and average revenue per consumer. Showcasing this set of slides titled Web Usage Analysis Summary Dashboard To Track Performance Background PDF. The topics addressed in these templates are Customer Churn Rate, Bounce Rate, Monthly Recurring Revenue. All the content presented in this PPT design is completely editable. Download it and make adjustments in color, background, font etc. as per your unique business setting.
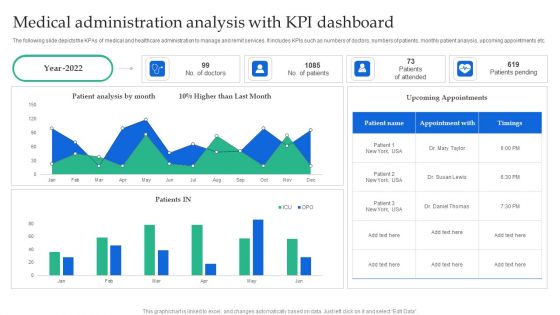
Medical Administration Analysis With KPI Dashboard Clipart PDF
The following slide depicts the KPAs of medical and healthcare administration to manage and remit services. It includes KPIs such as numbers of doctors, numbers of patients, monthly patient analysis, upcoming appointments etc. Showcasing this set of slides titled Medical Administration Analysis With KPI Dashboard Clipart PDF. The topics addressed in these templates are Patient Analysis, Higher Than, Upcoming Appointments. All the content presented in this PPT design is completely editable. Download it and make adjustments in color, background, font etc. as per your unique business setting.

Virtual Assets Investment Guide Cryptocurrency Portfolio Investment Dashboard Guidelines PDF
Identifying the metrics which help in analyzing the product performance play a crucial role when it comes to tracking performance. The following slide highlights such manor KPIs, these are total sell, total buy, etc. Deliver an awe inspiring pitch with this creative Virtual Assets Investment Guide Cryptocurrency Portfolio Investment Dashboard Guidelines PDF bundle. Topics like Bitcoin BTC, Total Sell, Total Buy can be discussed with this completely editable template. It is available for immediate download depending on the needs and requirements of the user.
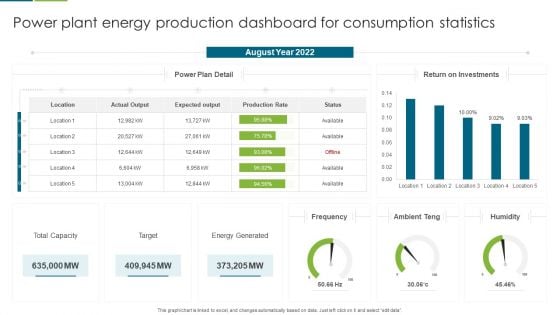
Power Plant Energy Production Dashboard For Consumption Statistics Download PDF
This graph or chart is linked to excel, and changes automatically based on data. Just left click on it and select edit data. Pitch your topic with ease and precision using this Multiple Country Energy Consumption Statistics Comparison Dashboard Formats PDF. This layout presents information on August Year 2022, Return on Investments, Power Plan Detail . It is also available for immediate download and adjustment. So, changes can be made in the color, design, graphics or any other component to create a unique layout.
Customer Service Request Tickets Administration Dashboard Icons PDF
This slide covers division of tickets into different groups. It also includes a pie chart dividing tickets in multiple categories such as status, tech groups, alert level, request type and alert condition. Pitch your topic with ease and precision using this Customer Service Request Tickets Administration Dashboard Icons PDF. This layout presents information on Tickets Activity, Tickets Alert Level, Tickets Teach Group. It is also available for immediate download and adjustment. So, changes can be made in the color, design, graphics or any other component to create a unique layout.
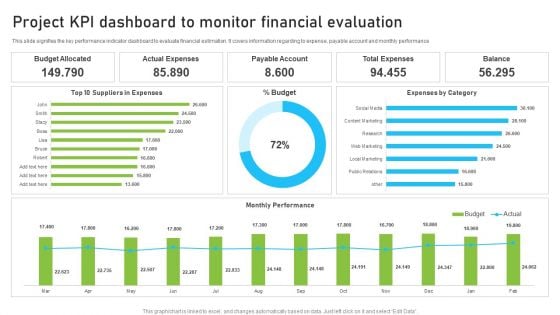
Project KPI Dashboard To Monitor Financial Evaluation Background PDF
This slide signifies the construction project management projection plan. It covers information regarding to the estimate ID, Task, effort hours, resource quantity, performance factor and duration evaluation. Pitch your topic with ease and precision using this Project KPI Dashboard To Monitor Financial Evaluation Background PDF. This layout presents information on Actual Expenses, Payable Account, Budget Allocated. It is also available for immediate download and adjustment. So, changes can be made in the color, design, graphics or any other component to create a unique layout.
Tracking Goals Dashboard With Progress Report Rules PDF
This slide showcases the progress report which helps to determine gaps in the objective achievement process and take corrective actions. It also includes objective details such as contributor, due date, and progress percentage. Showcasing this set of slides titled Tracking Goals Dashboard With Progress Report Rules PDF. The topics addressed in these templates are Immediate Action Required, Progress Update Required, Concise Goal Outcome Required. All the content presented in this PPT design is completely editable. Download it and make adjustments in color, background, font etc. as per your unique business setting.
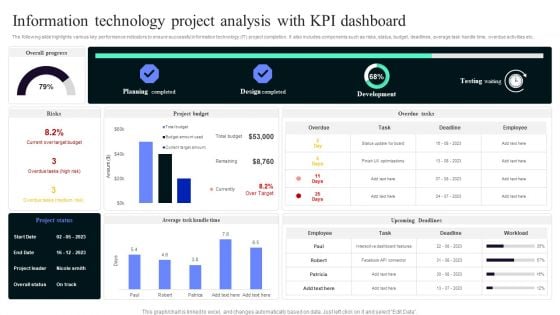
Information Technology Project Analysis With Kpi Dashboard Portrait PDF
The following slide highlights various key performance indicators to ensure successful information technology IT project completion. It also includes components such as risks, status, budget, deadlines, average task handle time, overdue activities etc. Pitch your topic with ease and precision using this Information Technology Project Analysis With Kpi Dashboard Portrait PDF. This layout presents information on Planning Completed, Design Completed, Development . It is also available for immediate download and adjustment. So, changes can be made in the color, design, graphics or any other component to create a unique layout.
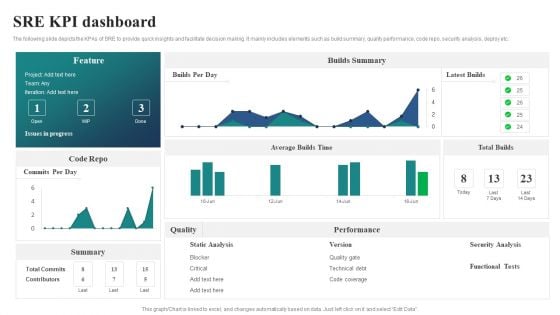
SRE KPI Dashboard Ppt PowerPoint Presentation File Slide Portrait PDF
The following slide depicts the KPAs of SRE to provide quick insights and facilitate decision making. It mainly includes elements such as build summary, quality performance, code repo, security analysis, deploy etc. Showcasing this set of slides titled SRE KPI Dashboard Ppt PowerPoint Presentation File Slide Portrait PDF. The topics addressed in these templates are Builds Summary, Latest Builds, Total Builds. All the content presented in this PPT design is completely editable. Download it and make adjustments in color, background, font etc. as per your unique business setting.
Workforce Productivity Tracking Report Kpi Dashboard Icons PDF
The following slide presents the KPAs of project work stream for transparency and better decision making. It includes KPIs such as work stream status, priority check, planned vs actual budget etc. Showcasing this set of slides titled Workforce Productivity Tracking Report Kpi Dashboard Icons PDF. The topics addressed in these templates are Initiation Meeting, Resource Assessment, Technological Analysis. All the content presented in this PPT design is completely editable. Download it and make adjustments in color, background, font etc. as per your unique business setting.
Key Blocks For Project Management Dashboard Ppt Icon Tips PDF
This slide illustrates graphical representations of facts and figures related to project drivers. It includes stakeholders engagement, feedback and response rate, business units performance etc. Showcasing this set of slides titled Key Blocks For Project Management Dashboard Ppt Icon Tips PDF. The topics addressed in these templates are Stakeholders Engagement Score, Business Units Performance, Effective Communication Score. All the content presented in this PPT design is completely editable. Download it and make adjustments in color, background, font etc. as per your unique business setting.
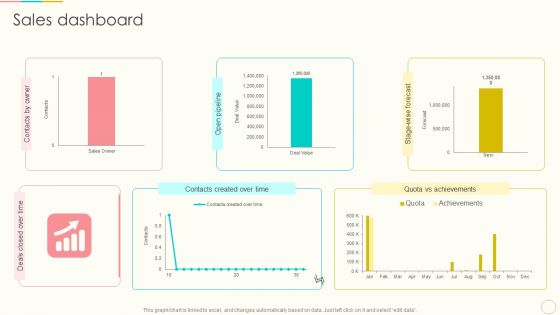
Lead Management To Engage Potential Customers Sales Dashboard Themes PDF
Do you know about Slidesgeeks Lead Management To Engage Potential Customers Sales Dashboard Themes PDF These are perfect for delivering any kind od presentation. Using it, create PowerPoint presentations that communicate your ideas and engage audiences. Save time and effort by using our pre designed presentation templates that are perfect for a wide range of topic. Our vast selection of designs covers a range of styles, from creative to business, and are all highly customizable and easy to edit. Download as a PowerPoint template or use them as Google Slides themes.
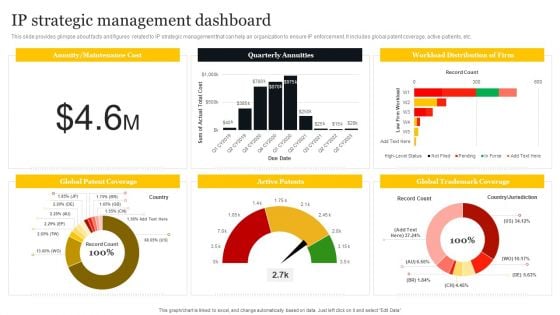
IP Strategic Management Dashboard Ppt PowerPoint Presentation File Example PDF
This slide provides glimpse about facts and figures related to IP strategic management that can help an organization to ensure IP enforcement. It includes global patent coverage, active patients, etc. Showcasing this set of slides titled IP Strategic Management Dashboard Ppt PowerPoint Presentation File Example PDF. The topics addressed in these templates are Quarterly Annuities, Workload Distribution Firm, Active Patents. All the content presented in this PPT design is completely editable. Download it and make adjustments in color, background, font etc. as per your unique business setting.
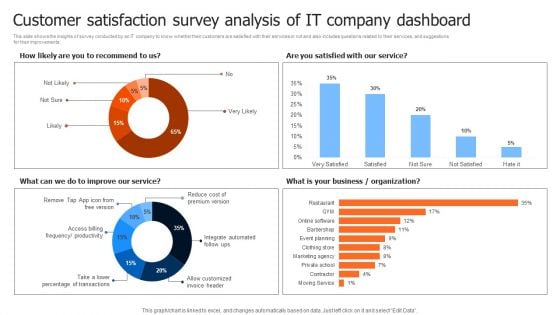
Customer Satisfaction Survey Analysis Of It Company Dashboard Themes PDF
This slide shows the insights of survey conducted by an IT company to know whether their customers are satisfied with their services or not and also includes questions related to their services, and suggestions for their improvements. Pitch your topic with ease and precision using this Customer Satisfaction Survey Analysis Of It Company Dashboard Themes PDF. This layout presents information on Organization, Business, Service. It is also available for immediate download and adjustment. So, changes can be made in the color, design, graphics or any other component to create a unique layout.
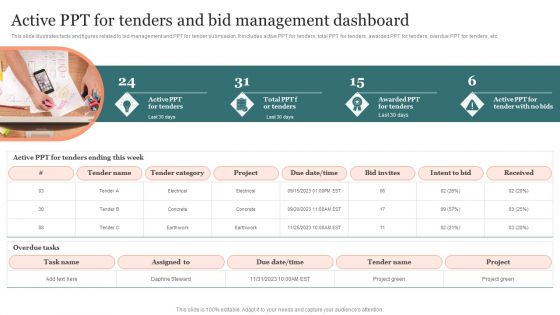
Active Ppt For Tenders And Bid Management Dashboard Microsoft PDF
This slide illustrates facts and figures related to bid management and PPT for tender submission. It includes active PPT for tenders, total PPT for tenders, awarded PPT for tenders, overdue PPT for tenders, etc. Presenting Active Ppt For Tenders And Bid Management Dashboard Microsoft PDF to dispense important information. This template comprises four stages. It also presents valuable insights into the topics including Project, Tender Name, Bid Invites. This is a completely customizable PowerPoint theme that can be put to use immediately. So, download it and address the topic impactfully.
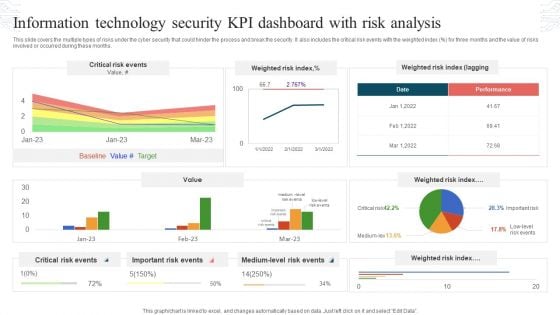
Information Technology Security KPI Dashboard With Risk Analysis Topics PDF
This slide covers the multiple types of risks under the cyber security that could hinder the process and break the security. It also includes the critical risk events with the weighted index percent for three months and the value of risks involved or occurred during these months. Showcasing this set of slides titled Information Technology Security KPI Dashboard With Risk Analysis Topics PDF. The topics addressed in these templates are Critical Risk Events, Weighted Risk Index, Important Risk Events. All the content presented in this PPT design is completely editable. Download it and make adjustments in color, background, font etc. as per your unique business setting.

Information Technology Security Team Analytics Dashboard With KPI Themes PDF
This slide elaborates about the number of incidents that have taken place in cyber security and the malware types with per incident. It also includes the number of open and resolved ticked. Showcasing this set of slides titled Information Technology Security Team Analytics Dashboard With KPI Themes PDF. The topics addressed in these templates are Open Incidents, Resolved Incidents, Open Tickets, Resolved Tickets. All the content presented in this PPT design is completely editable. Download it and make adjustments in color, background, font etc. as per your unique business setting.

Weekly Performance Report Dashboard With Project Budget Download PDF
This slide contains the weekly performance report of various phases of project with the overdue tasks and their upcoming . it also includes the project budget with the tracking of workload on staff members. Pitch your topic with ease and precision using this Weekly Performance Report Dashboard With Project Budget Download PDF. This layout presents information on Planning, Design, Development, Testing. It is also available for immediate download and adjustment. So, changes can be made in the color, design, graphics or any other component to create a unique layout.


 Continue with Email

 Home
Home


