Market Trends
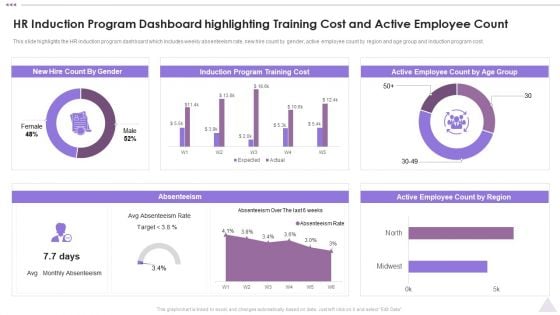
New Staff Orientation Session HR Induction Program Dashboard Highlighting Training Cost Template PDF
This slide highlights the HR induction program dashboard which includes weekly absenteeism rate, new hire count by gender, active employee count by region and age group and induction program cost. Deliver and pitch your topic in the best possible manner with this New Staff Orientation Session HR Induction Program Dashboard Highlighting Training Cost Template PDF. Use them to share invaluable insights on Induction Program, Training Cost, Absenteeism, Active Employee and impress your audience. This template can be altered and modified as per your expectations. So, grab it now.
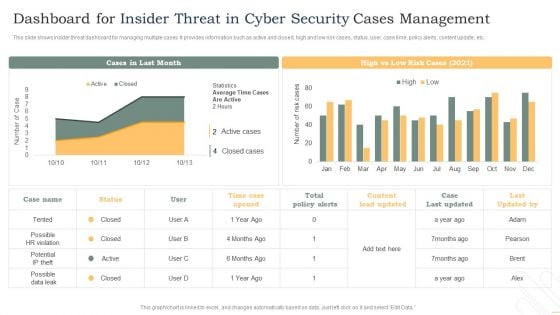
Dashboard For Insider Threat In Cyber Security Cases Management Background PDF
This slide shows insider threat dashboard for managing multiple cases. It provides information such as active and closed, high and low risk cases, status, user, case time, policy alerts, content update, etc. Showcasing this set of slides titled Dashboard For Insider Threat In Cyber Security Cases Management Background PDF. The topics addressed in these templates are Total Policy Alerts, High, Low, Time Case Opened. All the content presented in this PPT design is completely editable. Download it and make adjustments in color, background, font etc. as per your unique business setting.
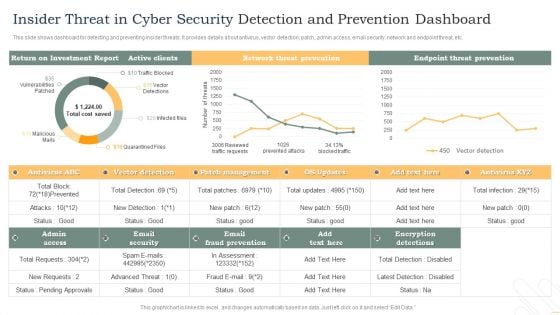
Insider Threat In Cyber Security Detection And Prevention Dashboard Diagrams PDF
This slide shows dashboard for detecting and preventing insider threats. It provides details about antivirus, vector detection, patch, admin access, email security, network and endpoint threat, etc. Pitch your topic with ease and precision using this Insider Threat In Cyber Security Detection And Prevention Dashboard Diagrams PDF. This layout presents information on Active Clients, Network Threat Prevention, Endpoint Threat Prevention. It is also available for immediate download and adjustment. So, changes can be made in the color, design, graphics or any other component to create a unique layout.
Insider Threat In Cyber Security Tracking Dashboard With User Details Portrait PDF
This slide shows user details tracked by insider threat dashboard. It provides information such as exposure events, file activity, archive, document, image, pdf, ppt, scripts, etc. Pitch your topic with ease and precision using this Insider Threat In Cyber Security Tracking Dashboard With User Details Portrait PDF. This layout presents information on Private Data, Exposure Events, User Activity, File Activity, Over Time. It is also available for immediate download and adjustment. So, changes can be made in the color, design, graphics or any other component to create a unique layout.
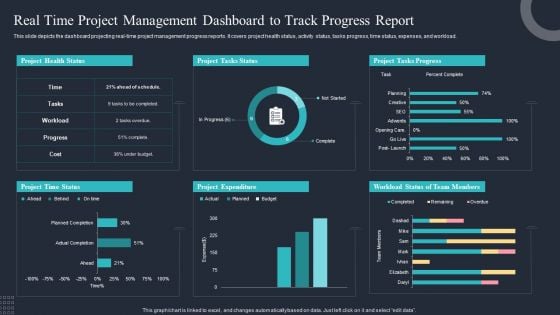
Real Time Project Management Dashboard To Track Progress Report Clipart PDF
This slide depicts the dashboard projecting real-time project management progress reports. It covers project health status, activity status, tasks progress, time status, expenses, and workload. Showcasing this set of slides titled Real Time Project Management Dashboard To Track Progress Report Clipart PDF. The topics addressed in these templates are Project Health Status, Project Tasks Status, Project Tasks Progress. All the content presented in this PPT design is completely editable. Download it and make adjustments in color, background, font etc. as per your unique business setting.
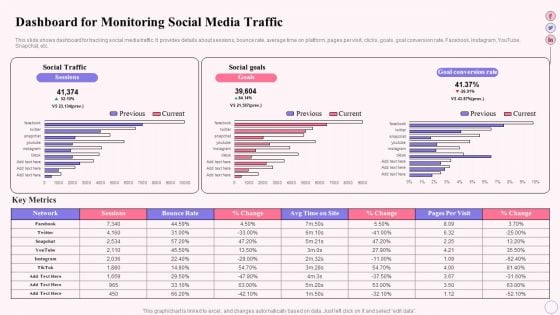
Integrating Social Media Tactics Dashboard For Monitoring Social Media Traffic Ideas PDF
This slide shows dashboard for tracking social media traffic. It provides details about sessions, bounce rate, average time on platform, pages per visit, clicks, goals, goal conversion rate, Facebook, Instagram, YouTube, Snapchat, etc. Deliver and pitch your topic in the best possible manner with this Integrating Social Media Tactics Dashboard For Monitoring Social Media Traffic Ideas PDF. Use them to share invaluable insights on Social Traffic, Social Goals, Goal Conversion Rate and impress your audience. This template can be altered and modified as per your expectations. So, grab it now.
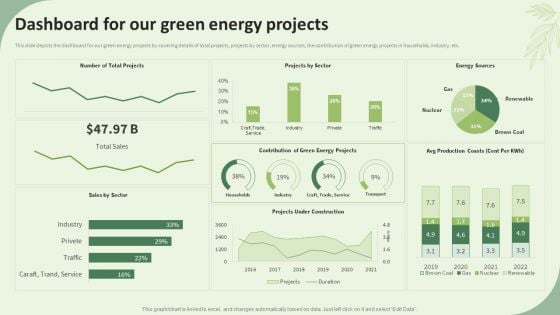
Sustainable Energy Resources Dashboard For Our Green Energy Projects Mockup PDF
This slide depicts the dashboard for our green energy projects by covering details of total projects, projects by sector, energy sources, the contribution of green energy projects in households, industry, etc. Deliver and pitch your topic in the best possible manner with this Sustainable Energy Resources Dashboard For Our Green Energy Projects Mockup PDF. Use them to share invaluable insights on Projects Sector, Energy Sources, Sales Sector and impress your audience. This template can be altered and modified as per your expectations. So, grab it now.
AI Playbook For Business KPI Dashboard For Tracking Business Performance Demonstration PDF
Mentioned slide portrays KPI dashboard that can be used by organizations to measure their business performance post AI introduction. KPIS covered here are progress, before versus after AI implementation, risks and issues. Deliver and pitch your topic in the best possible manner with this AI Playbook For Business KPI Dashboard For Tracking Business Performance Demonstration PDF. Use them to share invaluable insights on Performance KPIs, Progress, Risk And Issues and impress your audience. This template can be altered and modified as per your expectations. So, grab it now.
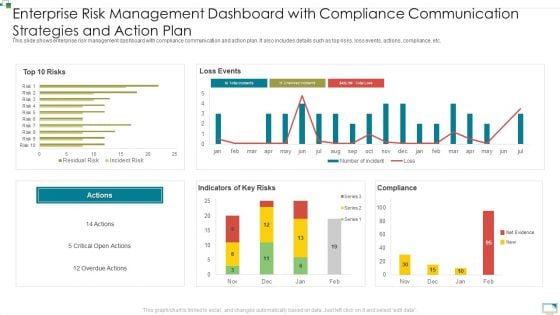
Enterprise Risk Management Dashboard With Compliance Communication Strategies And Action Plan Infographics PDF
This slide shows enterprise risk management dashboard with compliance communication and action plan. It also includes details such as top risks, loss events, actions, compliance, etc. Showcasing this set of slides titled Enterprise Risk Management Dashboard With Compliance Communication Strategies And Action Plan Infographics PDF. The topics addressed in these templates are Top 10 Risks, Loss Events, Actions. All the content presented in this PPT design is completely editable. Download it and make adjustments in color, background, font etc. as per your unique business setting.
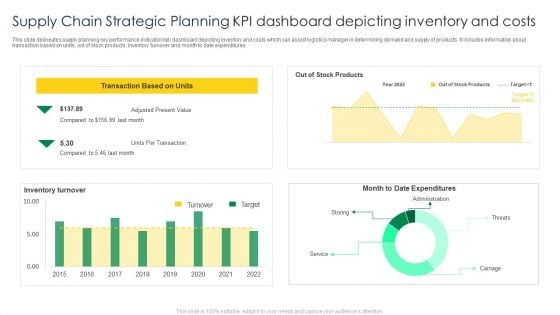
Supply Chain Strategic Planning KPI Dashboard Depicting Inventory And Costs Template PDF
This slide delineates supply planning key performance indicator kpi dashboard depicting inventory and costs which can assist logistics manager in determining demand and supply of products. It includes information about transaction based on units, out of stock products, inventory turnover and month to date expenditures. Showcasing this set of slides titled Supply Chain Strategic Planning KPI Dashboard Depicting Inventory And Costs Template PDF. The topics addressed in these templates are Transaction Based Units, 2016 To 2022. All the content presented in this PPT design is completely editable. Download it and make adjustments in color, background, font etc. as per your unique business setting.
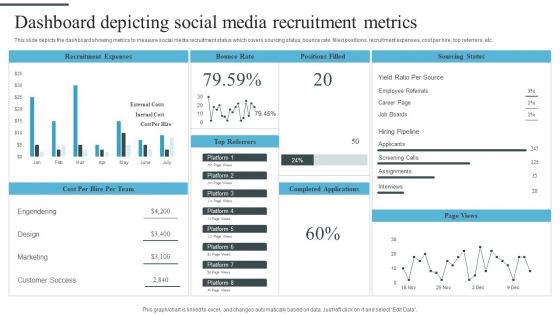
Tactical Process For Social Dashboard Depicting Social Media Recruitment Metrics Themes PDF
This slide depicts the dashboard showing metrics to measure social media recruitment status which covers sourcing status, bounce rate, filled positions, recruitment expenses, cost per hire, top referrers, etc. Deliver and pitch your topic in the best possible manner with this Tactical Process For Social Dashboard Depicting Social Media Recruitment Metrics Themes PDF. Use them to share invaluable insights on Recruitment Expenses, Bounce Rate, Positions Filled and impress your audience. This template can be altered and modified as per your expectations. So, grab it now.
Precooked Food Industry Analysis KPI Dashboard For Tracking Supply Chain Costs Diagrams PDF
This slide represents the KPI dashboard to track the multiple cost associated with supply chain in food manufacturing industry. It includes information regarding cash to cash cycle in days, carry cost of inventory along with details of net sales.Deliver an awe inspiring pitch with this creative Precooked Food Industry Analysis KPI Dashboard For Tracking Supply Chain Costs Diagrams PDF bundle. Topics like Processing Industry, Food Processing, Manufacturing Industry can be discussed with this completely editable template. It is available for immediate download depending on the needs and requirements of the user.
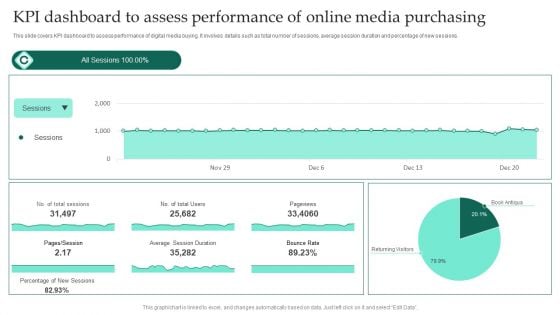
KPI Dashboard To Assess Performance Of Online Media Purchasing Ppt Professional Grid PDF
This slide covers KPI dashboard to assess performance of digital media buying. It involves details such as total number of sessions, average session duration and percentage of new sessions. Showcasing this set of slides titled KPI Dashboard To Assess Performance Of Online Media Purchasing Ppt Professional Grid PDF. The topics addressed in these templates are Average Session Duration, Bounce Rate, Pageviews. All the content presented in this PPT design is completely editable. Download it and make adjustments in color, background, font etc. as per your unique business setting.
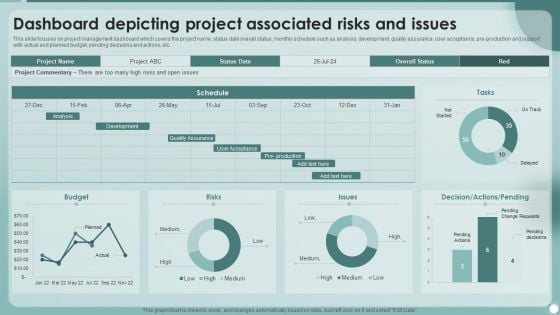
Strategies To Enhance Project Management Process Dashboard Depicting Project Associated Risks And Issues Background PDF
This slide focuses on project management dashboard which covers the project name, status date overall status, monthly schedule such as analysis, development, quality assurance, user acceptance, pre production and support with actual and planned budget, pending decisions and actions, etc. Deliver and pitch your topic in the best possible manner with this Strategies To Enhance Project Management Process Dashboard Depicting Project Associated Risks And Issues Background PDF. Use them to share invaluable insights on Quality Assurance, Development, Analysis and impress your audience. This template can be altered and modified as per your expectations. So, grab it now.
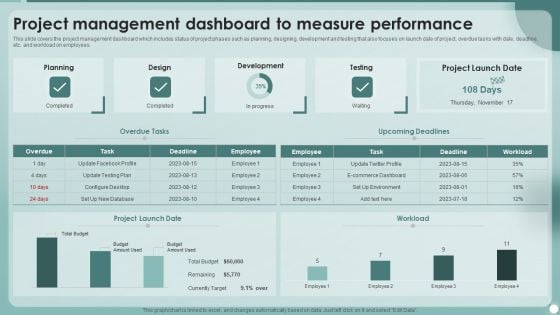
Strategies To Enhance Project Management Process Project Management Dashboard To Measure Performance Ideas PDF
This slide covers the project management dashboard which includes status of project phases such as planning, designing, development and testing that also focuses on launch date of project, overdue tasks with date, deadline, etc. and workload on employees. Deliver and pitch your topic in the best possible manner with this Strategies To Enhance Project Management Process Project Management Dashboard To Measure Performance Ideas PDF. Use them to share invaluable insights on Employee, Project Launch, Development, Design and impress your audience. This template can be altered and modified as per your expectations. So, grab it now.
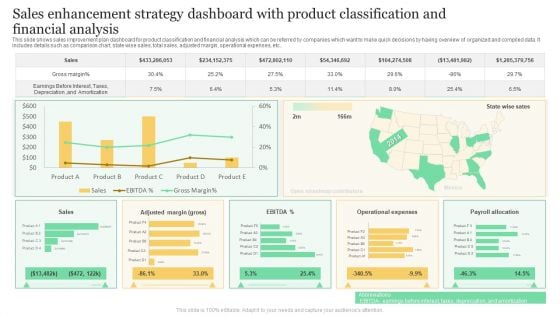
Sales Enhancement Strategy Dashboard With Product Classification And Financial Analysis Formats PDF
This slide shows sales improvement plan dashboard for product classification and financial analysis which can be referred by companies which want to make quick decisions by having overview of organized and compiled data. It includes details such as comparison chart, state wise sales, total sales, adjusted margin, operational expenses, etc. Showcasing this set of slides titled Sales Enhancement Strategy Dashboard With Product Classification And Financial Analysis Formats PDF. The topics addressed in these templates are Gross Margin, Sales, Operational Expenses. All the content presented in this PPT design is completely editable. Download it and make adjustments in color, background, font etc. as per your unique business setting.
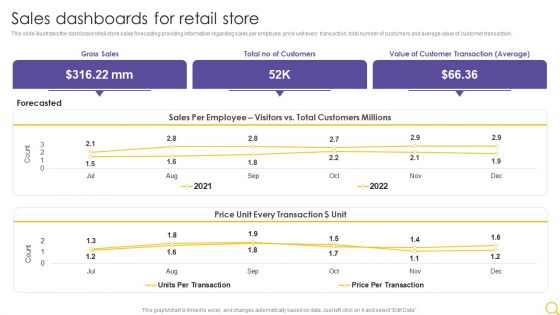
Retail Outlet Operational Efficiency Analytics Sales Dashboards For Retail Store Inspiration PDF
This slide illustrates the dashboard retail store sales forecasting providing information regarding sales per employee, price unit every transaction, total number of customers and average value of customer transaction. Deliver and pitch your topic in the best possible manner with this Retail Outlet Operational Efficiency Analytics Sales Dashboards For Retail Store Inspiration PDF. Use them to share invaluable insights on Gross Sales, Total No Customers, Value Customer and impress your audience. This template can be altered and modified as per your expectations. So, grab it now.
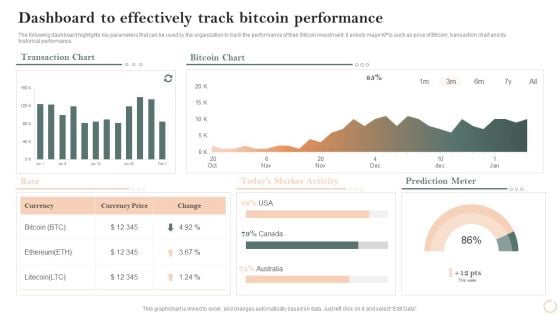
Virtual Assets Investment Guide Dashboard To Effectively Track Bitcoin Performance Rules PDF
The following dashboard highlights key parameters that can be used by the organization to track the performance of their Bitcoin investment, it enlists major KPIs such as price of Bitcoin, transaction chart and its historical performance. Deliver an awe inspiring pitch with this creative Virtual Assets Investment Guide Dashboard To Effectively Track Bitcoin Performance Rules PDF bundle. Topics like Bitcoin Chart, Transaction Chart, Prediction Meter can be discussed with this completely editable template. It is available for immediate download depending on the needs and requirements of the user.
Dashboard For Domestic Budget Planning And Management Ppt PowerPoint Presentation Icon Maker PDF
This slide showcases a dashboard for domestic planning and efficient spending. Its key elements are total receipts, total payments, receipts classification, expenses classification, cash transactions, current cash balance and cash transactions. Showcasing this set of slides titled Dashboard For Domestic Budget Planning And Management Ppt PowerPoint Presentation Icon Maker PDF. The topics addressed in these templates are Total Receipts, Total Payments, Cash Transactions. All the content presented in this PPT design is completely editable. Download it and make adjustments in color, background, font etc. as per your unique business setting.

Domestic Budget Plan Income And Expenditure Analysis Dashboard Ppt PowerPoint Presentation Layouts Clipart Images PDF
The slide presents a dashboard to analyze and monitor income and expenses for formulating savings plan. It includes income, expenses, savings, top five expenses and unplanned expenses.Pitch your topic with ease and precision using this Domestic Budget Plan Income And Expenditure Analysis Dashboard Ppt PowerPoint Presentation Layouts Clipart Images PDF. This layout presents information on Unplanned Expenses, Expenses, Key Metrics. It is also available for immediate download and adjustment. So, changes can be made in the color, design, graphics or any other component to create a unique layout.
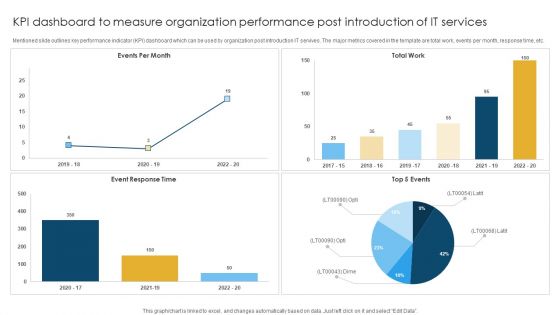
KPI Dashboard To Measure Organization Performance Post Introduction Of IT Services Rules PDF
Mentioned slide outlines key performance indicator KPI dashboard which can be used by organization post introduction IT servives. The major metrics covered in the template are total work, events per month, response time, etc. Showcasing this set of slides titled KPI Dashboard To Measure Organization Performance Post Introduction Of IT Services Rules PDF. The topics addressed in these templates are Event Response, Total Work, Events Per. All the content presented in this PPT design is completely editable. Download it and make adjustments in color, background, font etc. as per your unique business setting.
Half Yearly Content Project Plan Analysis Dashboard Ppt Icon Background Designs PDF
This slide defines the dashboard for 6 month content project plan analysis . it includes information related to the progress, risk , project summary, tasks, etc. Pitch your topic with ease and precision using this Half Yearly Content Project Plan Analysis Dashboard Ppt Icon Background Designs PDF. This layout presents information on Overall Progress, Planning, Risks. It is also available for immediate download and adjustment. So, changes can be made in the color, design, graphics or any other component to create a unique layout.
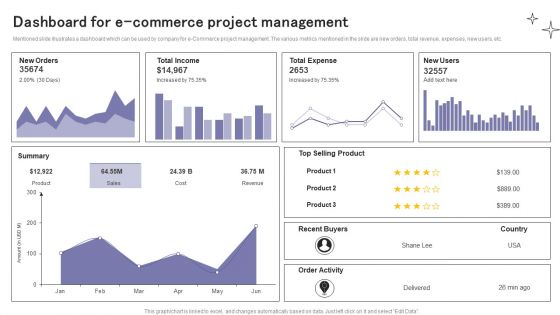
Dashboard For E Commerce Project Management Ppt Ideas Design Inspiration PDF
Mentioned slide illustrates a dashboard which can be used by company for e-Commerce project management. The various metrics mentioned in the slide are new orders, total revenue, expenses, new users, etc. Showcasing this set of slides titled Dashboard For E Commerce Project Management Ppt Ideas Design Inspiration PDF. The topics addressed in these templates are New Orders, Total Income, Total Expense. All the content presented in this PPT design is completely editable. Download it and make adjustments in color, background, font etc. as per your unique business setting.
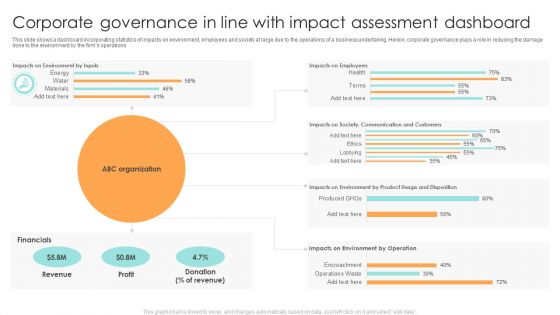
Corporate Governance In Line With Impact Assessment Dashboard Ppt File Backgrounds PDF
This slide shows a dashboard incorporating statistics of impacts on environment, employees and society at large due to the operations of a business undertaking. Herein, corporate governance plays a role in reducing the damage done to the environment by the firms operations. Pitch your topic with ease and precision using this Corporate Governance In Line With Impact Assessment Dashboard Ppt File Backgrounds PDF. This layout presents information on Financials, Profit, ABC Organization. It is also available for immediate download and adjustment. So, changes can be made in the color, design, graphics or any other component to create a unique layout.
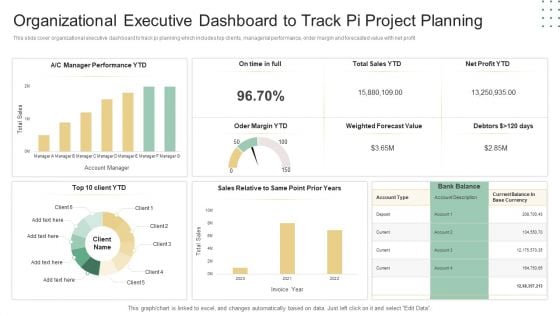
Organizational Executive Dashboard To Track Pi Project Planning Ppt Professional Background PDF
This slide cover organizational executive dashboard to track pi planning which includes top clients, managerial performance, order margin and forecasted value with net profit. Pitch your topic with ease and precision using this Organizational Executive Dashboard To Track Pi Project Planning Ppt Professional Background PDF. This layout presents information on Weighted Forecast Value, Top 10, Client YTD. It is also available for immediate download and adjustment. So, changes can be made in the color, design, graphics or any other component to create a unique layout.

Product Procurement Management Dashboard With Defect Rate Supplier Availability And Lead Time Pictures PDF
This slide shows a dashboard of procurement to provide real time information about various components. It includes defect rate, on time supplies , supplier availability and lead time. Showcasing this set of slides titled Product Procurement Management Dashboard With Defect Rate Supplier Availability And Lead Time Pictures PDF. The topics addressed in these templates are Supplier Defect Rate, Supplier Availability, Lead Time. All the content presented in this PPT design is completely editable. Download it and make adjustments in color, background, font etc. as per your unique business setting.
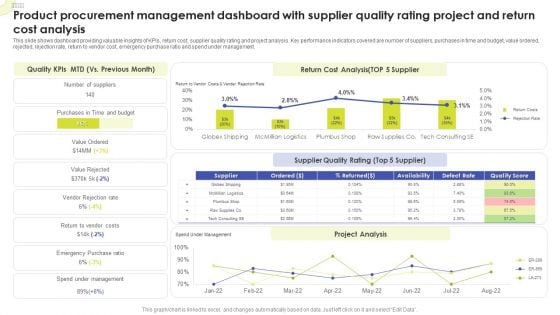
Product Procurement Management Dashboard With Supplier Quality Rating Project And Return Cost Analysis Sample PDF
This slide shows dashboard providing valuable insights of KPIs, return cost, supplier quality rating and project analysis. Key performance indicators covered are number of suppliers, purchases in time and budget, value ordered, rejected, rejection rate, return to vendor cost, emergency purchase ratio and spend under management. Pitch your topic with ease and precision using this Product Procurement Management Dashboard With Supplier Quality Rating Project And Return Cost Analysis Sample PDF. This layout presents information on Quality KPIs, Return Cost Analysis, Supplier Quality Rating. It is also available for immediate download and adjustment. So, changes can be made in the color, design, graphics or any other component to create a unique layout.
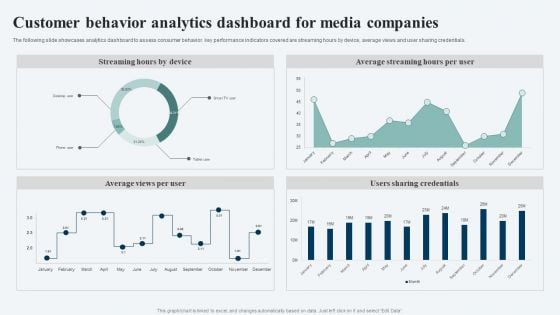
Customer Behavior Analytics Dashboard For Media Companies Ppt Ideas Visuals PDF
The following slide showcases analytics dashboard to assess consumer behavior. key performance indicators covered are streaming hours by device, average views and user sharing credentials. Showcasing this set of slides titled Customer Behavior Analytics Dashboard For Media Companies Ppt Ideas Visuals PDF. The topics addressed in these templates are Streaming Hours Device, Average Streaming Hours, Per User, Users Sharing Credentials. All the content presented in this PPT design is completely editable. Download it and make adjustments in color, background, font etc. as per your unique business setting.
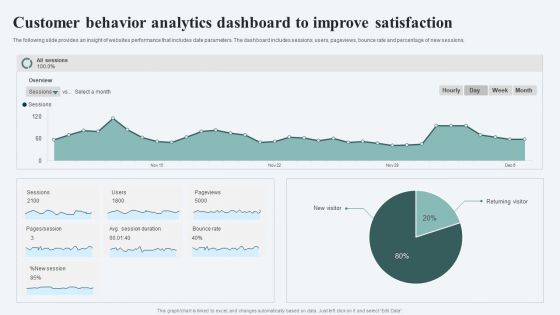
Customer Behavior Analytics Dashboard To Improve Satisfaction Ppt File Infographics PDF
The following slide provides an insight of websites performance that includes date parameters. The dashboard includes sessions, users, pageviews, bounce rate and percentage of new sessions. Pitch your topic with ease and precision using this Customer Behavior Analytics Dashboard To Improve Satisfaction Ppt File Infographics PDF. This layout presents information on Session, Avg Session Duration, Bounce Rate. It is also available for immediate download and adjustment. So, changes can be made in the color, design, graphics or any other component to create a unique layout.
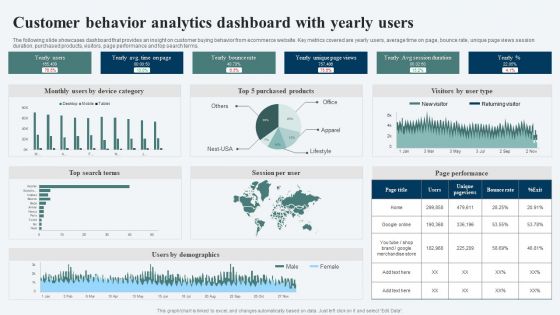
Customer Behavior Analytics Dashboard With Yearly Users Ppt Portfolio Ideas PDF
The following slide showcases dashboard that provides an insight on customer buying behavior from ecommerce website. Key metrics covered are yearly users, average time on page, bounce rate, unique page views session duration, purchased products, visitors, page performance and top search terms. Showcasing this set of slides titled Customer Behavior Analytics Dashboard With Yearly Users Ppt Portfolio Ideas PDF. The topics addressed in these templates are Yearly Users, Yearly Bounce Rate, Top Search Terms. All the content presented in this PPT design is completely editable. Download it and make adjustments in color, background, font etc. as per your unique business setting.
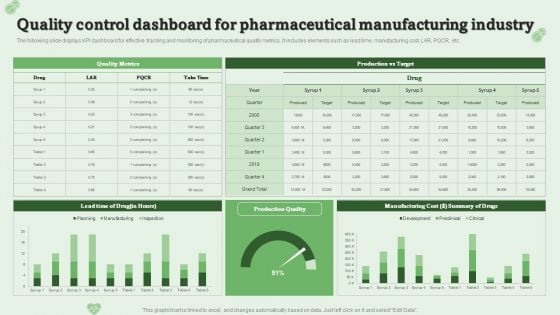
Quality Control Dashboard For Pharmaceutical Manufacturing Industry Ppt PowerPoint Presentation Model Layouts PDF
The following slide displays KPI dashboard for effective tracking and monitoring of pharmaceutical quality metrics. It includes elements such as lead time, manufacturing cost, LAR, PQCR, etc.Pitch your topic with ease and precision using this Quality Control Dashboard For Pharmaceutical Manufacturing Industry Ppt PowerPoint Presentation Model Layouts PDF. This layout presents information on Manufacturing Cost, Summary Drugs, Quality Metrics. It is also available for immediate download and adjustment. So, changes can be made in the color, design, graphics or any other component to create a unique layout.
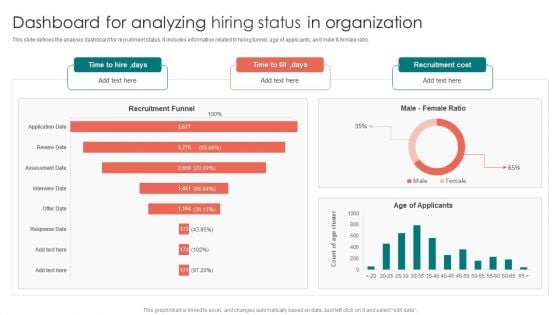
Dashboard For Analyzing Hiring Status In Organization Ppt PowerPoint Presentation Gallery Images PDF
This slide defines the analysis dashboard for recruitment status. It includes information related to hiring funnel, age of applicants, and male and female ratio. Pitch your topic with ease and precision using this Dashboard For Analyzing Hiring Status In Organization Ppt PowerPoint Presentation Gallery Images PDF. This layout presents information on Recruitment Funnel, Time To Hire, Age Applicants. It is also available for immediate download and adjustment. So, changes can be made in the color, design, graphics or any other component to create a unique layout.
Dashboard For Analyzing IT Hiring Status Ppt PowerPoint Presentation Icon Slides PDF
This slide defines the analysis dashboard for information technology IT recruitment status. It includes information related to technical and non- technical hiring, hiring pipeline, etc. Showcasing this set of slides titled Dashboard For Analyzing IT Hiring Status Ppt PowerPoint Presentation Icon Slides PDF. The topics addressed in these templates are Current Hiring Pipeline, Recruitment Costs YTD, Acceptance Rate. All the content presented in this PPT design is completely editable. Download it and make adjustments in color, background, font etc. as per your unique business setting.
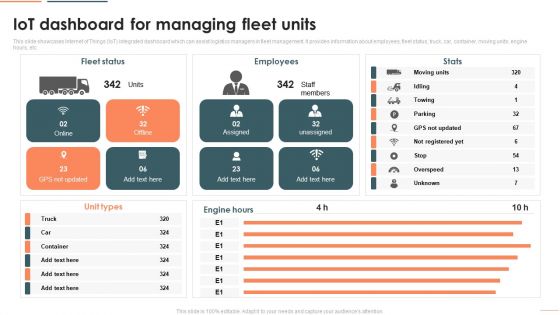
Deploying Iot In Logistics And Supply Chain Iot Dashboard For Managing Fleet Units Download PDF
This slide showcases Internet of Things IoT integrated dashboard which can assist logistics managers in fleet management. It provides information about employees, fleet status, truck, car, container, moving units, engine hours, etc. Deliver and pitch your topic in the best possible manner with this Deploying Iot In Logistics And Supply Chain Iot Dashboard For Managing Fleet Units Download PDF. Use them to share invaluable insights on Fleet Status, Employees, Unit Types and impress your audience. This template can be altered and modified as per your expectations. So, grab it now.
Warehouse Automation Deployment Dashboard For Tracking Impact Of Warehouse House Infographics PDF
This slide covers the dashboard with after automation warehouse overview. It include KPIs such as autonomous robots status, robotic arms status, battery level, performance, time to return, etc. Deliver and pitch your topic in the best possible manner with this Warehouse Automation Deployment Dashboard For Tracking Impact Of Warehouse House Infographics PDF. Use them to share invaluable insights on Autonomous Robot, Systems Engineer, Warehouse Manager and impress your audience. This template can be altered and modified as per your expectations. So, grab it now.
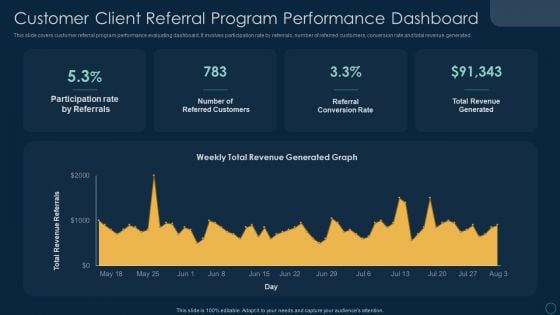
Customer Client Referral Program Performance Dashboard Ppt File Visual Aids PDF
This slide covers customer referral program performance evaluating dashboard. It involves participation rate by referrals, number of referred customers, conversion rate and total revenue generated. Pitch your topic with ease and precision using this Customer Client Referral Program Performance Dashboard Ppt File Visual Aids PDF. This layout presents information on Participation Rate Referrals, Number Referred Customers, Referral Conversion Rate. It is also available for immediate download and adjustment. So, changes can be made in the color, design, graphics or any other component to create a unique layout.

KPI Dashboard Highlighting Automation Results In Supply Achieving Operational Efficiency Graphics PDF
The following slide outlines a comprehensive dashboard depicting the business process automation BPA results in the supply chain. Information covered in the slide is related to average order processing days, average shipping days, etc.Deliver and pitch your topic in the best possible manner with this KPI Dashboard Highlighting Automation Results In Supply Achieving Operational Efficiency Graphics PDF. Use them to share invaluable insights on Orders Progress, Late Deliveries, Deliveries Warehouse and impress your audience. This template can be altered and modified as per your expectations. So, grab it now.
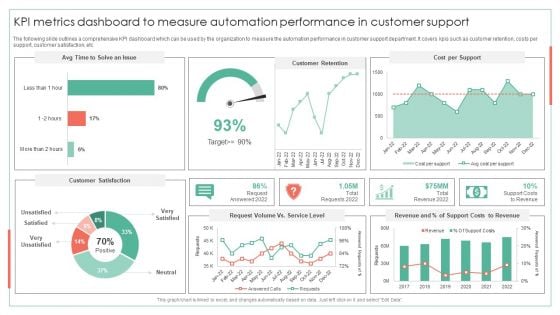
KPI Metrics Dashboard To Measure Automation Performance Achieving Operational Efficiency Guidelines PDF
The following slide outlines a comprehensive KPI dashboard which can be used by the organization to measure the automation performance in customer support department. It covers kpis such as customer retention, costs per support, customer satisfaction, etcDeliver and pitch your topic in the best possible manner with this KPI Metrics Dashboard To Measure Automation Performance Achieving Operational Efficiency Guidelines PDF. Use them to share invaluable insights on Customer Retention, Cost Per Support, Request Volume and impress your audience. This template can be altered and modified as per your expectations. So, grab it now.
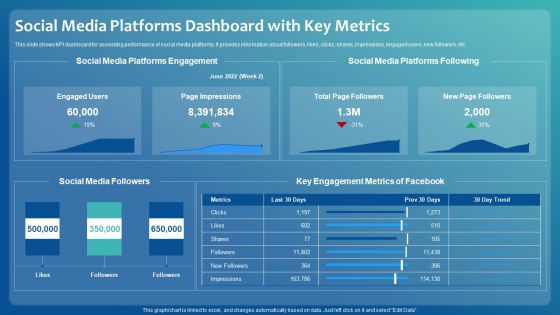
Improving Digital Community Engagement Strategy Social Media Platforms Dashboard With Key Metrics Professional PDF
This slide shows KPI dashboard for assessing performance of social media platforms. It provides information about followers, likes, clicks, shares, impressions, engaged users, new followers, etc. Deliver and pitch your topic in the best possible manner with this Improving Digital Community Engagement Strategy Social Media Platforms Dashboard With Key Metrics Professional PDF. Use them to share invaluable insights on Social Media Platforms Engagement, Key Engagement Metrics and impress your audience. This template can be altered and modified as per your expectations. So, grab it now.
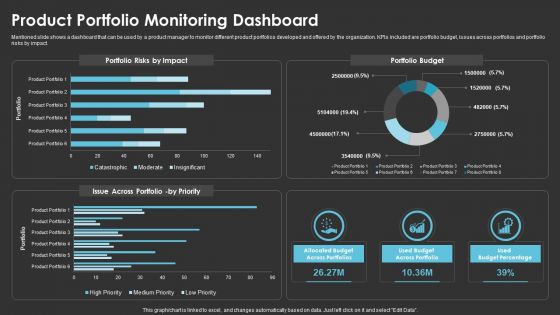
Method To Introduce New Product Offerings In The Industry Product Portfolio Monitoring Dashboard Template PDF
Mentioned slide shows a dashboard that can be used by a product manager to monitor different product portfolios developed and offered by the organization. KPIs included are portfolio budget, issues across portfolios and portfolio risks by impact. Deliver and pitch your topic in the best possible manner with this Method To Introduce New Product Offerings In The Industry Product Portfolio Monitoring Dashboard Template PDF. Use them to share invaluable insights on Portfolio Risks, Portfolio Budget and impress your audience. This template can be altered and modified as per your expectations. So, grab it now.
Strategies To Attract Customers And Lead Generation Dashboard For Tracking Facebook Retargeting Campaign Graphics PDF
This slide covers metrics for analysing the results of Facebook retargeting campaign. It includes KPIs such as ad spend, cost per click, click through rate, ad reach, post engagement, ad clicks, ad impressions, link clicks, etc. Deliver and pitch your topic in the best possible manner with this Strategies To Attract Customers And Lead Generation Dashboard For Tracking Facebook Retargeting Campaign Graphics PDF. Use them to share invaluable insights on Cost Per Click, Dashboard, Tracking Facebook Retargeting Campaign and impress your audience. This template can be altered and modified as per your expectations. So, grab it now.
Strategies To Attract Customers And Lead Generation Dashboard For Tracking Instagram Retargeting Campaign Elements PDF
This slide covers metrics for analyzing the results of the Instagram retargeting campaign. It includes KPIs such as amount spend, total reach, total impressions, website clicks, page likes, ad clicks, post reactions, etc. Deliver an awe inspiring pitch with this creative Strategies To Attract Customers And Lead Generation Dashboard For Tracking Instagram Retargeting Campaign Elements PDF bundle. Topics like Dashboard, Tracking Instagram Retargeting Campaign can be discussed with this completely editable template. It is available for immediate download depending on the needs and requirements of the user.
Strategies To Attract Customers And Lead Generation Dashboard For Tracking Twitter Retargeting Campaign Tracking Ideas PDF
This slide covers metrics for analysing the results of Twitter retargeting campaigns. It includes KPIs such as click through rate, impressions, conversion rate, cost, cost per click, etc. Deliver an awe inspiring pitch with this creative Strategies To Attract Customers And Lead Generation Dashboard For Tracking Twitter Retargeting Campaign Tracking Ideas PDF bundle. Topics like Dashboard, Tracking Twitter Retargeting, Campaign Tracking can be discussed with this completely editable template. It is available for immediate download depending on the needs and requirements of the user.
Risk Management Dashboard Of IT Department With Threat Frequency Icons PDF
This slide shows dashboard of risk management of IT department representing net critical risks, threat and vulnerability frequency in last 60 days, open audit findings, open and vendor risks etc. Showcasing this set of slides titled Risk Management Dashboard Of IT Department With Threat Frequency Icons PDF. The topics addressed in these templates are Net Critical Risk, Organization, Threat Frequency. All the content presented in this PPT design is completely editable. Download it and make adjustments in color, background, font etc. as per your unique business setting.
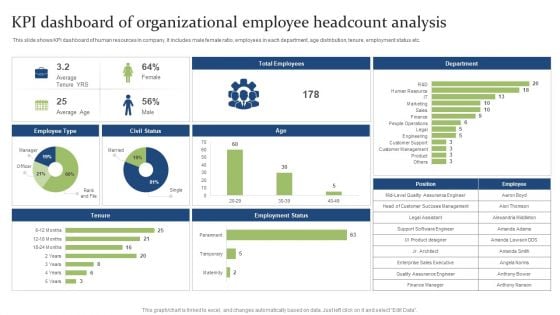
KPI Dashboard Of Organizational Employee Headcount Analysis Ppt PowerPoint Presentation Styles Show PDF
This slide shows KPI dashboard of human resources in company. It includes male female ratio, employees in each department, age distribution, tenure, employment status etc. Showcasing this set of slides titled KPI Dashboard Of Organizational Employee Headcount Analysis Ppt PowerPoint Presentation Styles Show PDF. The topics addressed in these templates are Support Software, Engineer Success, Sales Executive. All the content presented in this PPT design is completely editable. Download it and make adjustments in color, background, font etc. as per your unique business setting.
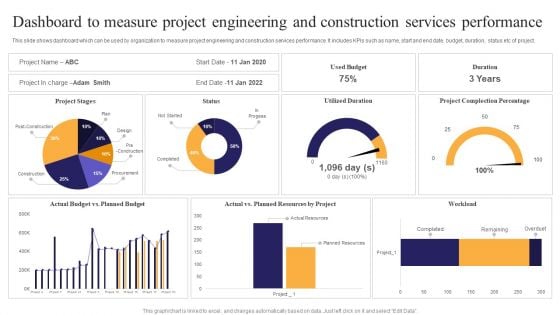
Dashboard To Measure Project Engineering And Construction Services Performance Ppt PowerPoint Presentation File Elements PDF
This slide shows dashboard which can be used by organization to measure project engineering and construction services performance. It includes KPIs such as name, start and end date, budget, duration, status etc of project. Showcasing this set of slides titled Dashboard To Measure Project Engineering And Construction Services Performance Ppt PowerPoint Presentation File Elements PDF. The topics addressed in these templates are Planned Resources, Utilized Duration, Project Complection. All the content presented in this PPT design is completely editable. Download it and make adjustments in color, background, font etc. as per your unique business setting.
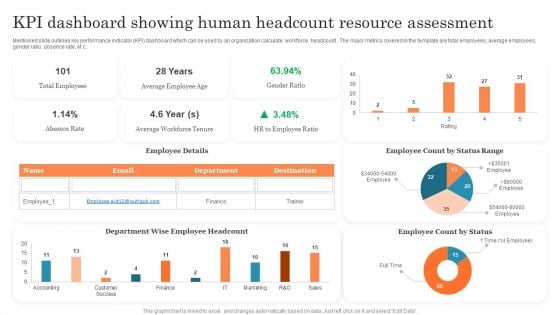
KPI Dashboard Showing Human Headcount Resource Assessment Ppt PowerPoint Presentation Outline PDF
Mentioned slide outlines key performance indicator KPI dashboard which can be used by an organization calculate workforce headcount . The major metrics covered in the template are total employees, average employees, gender ratio, absence rate, etc. Pitch your topic with ease and precision using this KPI Dashboard Showing Human Headcount Resource Assessment Ppt PowerPoint Presentation Outline PDF. This layout presents information on Total Employees, Average Employee, Employee Count. It is also available for immediate download and adjustment. So, changes can be made in the color, design, graphics or any other component to create a unique layout.
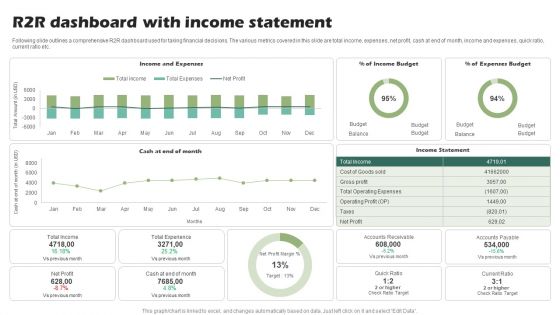
R2R Dashboard With Income Statement Ppt PowerPoint Presentation Show Slide Download PDF
Following slide outlines a comprehensive R2R dashboard used for taking financial decisions. The various metrics covered in this slide are total income, expenses, net profit, cash at end of month, income and expenses, quick ratio, current ratio etc.Showcasing this set of slides titled R2R Dashboard With Income Statement Ppt PowerPoint Presentation Show Slide Download PDF. The topics addressed in these templates are Operating Expenses, Total Experience, Accounts Receivable. All the content presented in this PPT design is completely editable. Download it and make adjustments in color, background, font etc. as per your unique business setting.

Employee Health And Risk Key Performance Indicator Dashboard Ppt Layouts Brochure PDF
The following slide highlights the employee health and safety key performance indicator dashboard illustrating narrow escapes, potential hazards, improvement opportunity, total incidents, health and safety learning, safety visit by management, ltir and trir, severe injuries and fatalities and safety goals. Showcasing this set of slides titled Employee Health And Risk Key Performance Indicator Dashboard Ppt Layouts Brochure PDF. The topics addressed in these templates are Narrow Escapes, Potential Hazards, Improvement Opportunity. All the content presented in this PPT design is completely editable. Download it and make adjustments in color, background, font etc. as per your unique business setting.
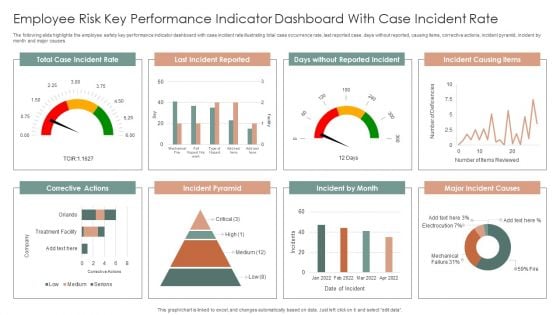
Employee Risk Key Performance Indicator Dashboard With Case Incident Rate Ppt Professional Information PDF
The following slide highlights the employee safety key performance indicator dashboard with case incident rate illustrating total case occurrence rate, last reported case, days without reported, causing items, corrective actions, incident pyramid, incident by month and major causes. Pitch your topic with ease and precision using this Employee Risk Key Performance Indicator Dashboard With Case Incident Rate Ppt Professional Information PDF. This layout presents information on Total Case, Incident Rate, Last Incident Reported, Incident Causing Items. It is also available for immediate download and adjustment. So, changes can be made in the color, design, graphics or any other component to create a unique layout.
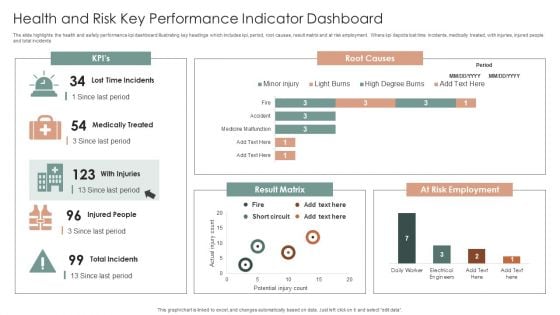
Health And Risk Key Performance Indicator Dashboard Ppt Layouts Graphics Design PDF
The slide highlights the health and safety performance kpi dashboard illustrating key headings which includes kpi, period, root causes, result matrix and at risk employment. Where kpi depicts lost time incidents, medically treated, with injuries, injured people and total incidents. Showcasing this set of slides titled Health And Risk Key Performance Indicator Dashboard Ppt Layouts Graphics Design PDF. The topics addressed in these templates are Root Causes, Result Matrix, At Risk Employment. All the content presented in this PPT design is completely editable. Download it and make adjustments in color, background, font etc. as per your unique business setting.
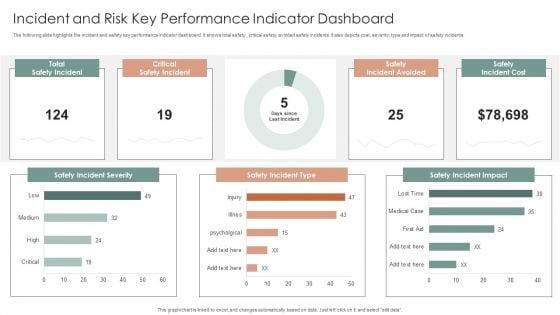
Incident And Risk Key Performance Indicator Dashboard Ppt Gallery Mockup PDF
The following slide highlights the incident and safety key performance indicator dashboard. It shows total safety, critical safety, avoided safety incidents. It also depicts cost, severity, type and impact of safety incidents. Showcasing this set of slides titled Incident And Risk Key Performance Indicator Dashboard Ppt Gallery Mockup PDF. The topics addressed in these templates are Safety Incident Severity, Safety Incident Type, Safety Incident Impact. All the content presented in this PPT design is completely editable. Download it and make adjustments in color, background, font etc. as per your unique business setting.

Patient Health And Risk Key Performance Indicator Dashboard Ppt Infographic Template Summary PDF
The following slide highlights the patient health and safety key performance indicator dashboard illustrating admission by department, admission by cost, patient satisfaction, total patients, operations cost, patient density, total staff, waiting time, treatment satisfaction and treatment confidence. Pitch your topic with ease and precision using this Patient Health And Risk Key Performance Indicator Dashboard Ppt Infographic Template Summary PDF. This layout presents information on Admission By Department, Admission Vs Cost, Patient Satisfaction. It is also available for immediate download and adjustment. So, changes can be made in the color, design, graphics or any other component to create a unique layout.
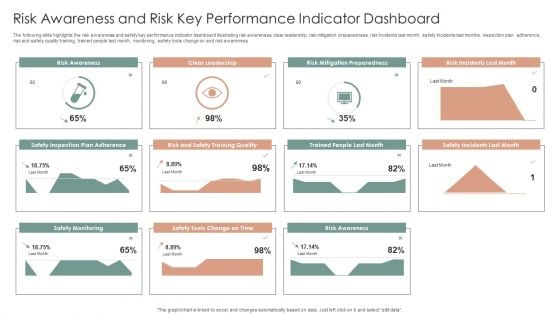
Risk Awareness And Risk Key Performance Indicator Dashboard Ppt Inspiration Ideas PDF
The following slide highlights the risk awareness and safety key performance indicator dashboard illustrating risk awareness, clear leadership, risk mitigation preparedness, risk incidents last month, safety incidents last months, inspection plan adherence, risk and safety quality training, trained people last month, monitoring, safety tools change on and risk awareness. Showcasing this set of slides titled Risk Awareness And Risk Key Performance Indicator Dashboard Ppt Inspiration Ideas PDF. The topics addressed in these templates are Safety Incident Avoided, Safety Incidents, Safety Incident, Accumulated Total. All the content presented in this PPT design is completely editable. Download it and make adjustments in color, background, font etc. as per your unique business setting.
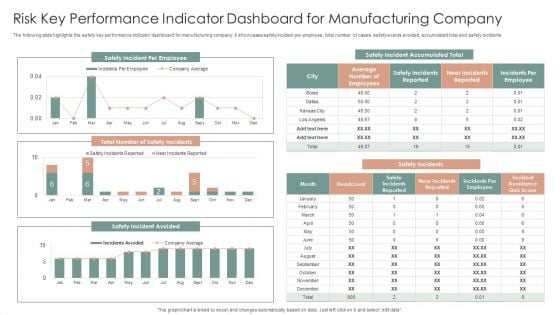
Risk Key Performance Indicator Dashboard For Manufacturing Company Ppt Gallery Graphics Design PDF
The following slide highlights the safety key performance indicator dashboard for manufacturing company. It showcases safety incident per employee, total number of cases, safety events avoided, accumulated total and safety incidents. Pitch your topic with ease and precision using this Risk Key Performance Indicator Dashboard For Manufacturing Company Ppt Gallery Graphics Design PDF. This layout presents information on Safety Incidents, Safety Incident Avoided, Safety Incident Accumulated. It is also available for immediate download and adjustment. So, changes can be made in the color, design, graphics or any other component to create a unique layout.
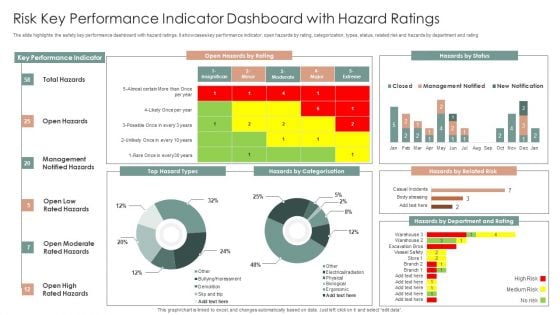
Risk Key Performance Indicator Dashboard With Hazard Ratings Ppt Layouts Slideshow PDF
The slide highlights the safety key performance dashboard with hazard ratings. It showcases key performance indicator, open hazards by rating, categorization, types, status, related risk and hazards by department and rating. Showcasing this set of slides titled Risk Key Performance Indicator Dashboard With Hazard Ratings Ppt Layouts Slideshow PDF. The topics addressed in these templates are Key Performance Indicator, Open Hazards, Hazards By Status. All the content presented in this PPT design is completely editable. Download it and make adjustments in color, background, font etc. as per your unique business setting.
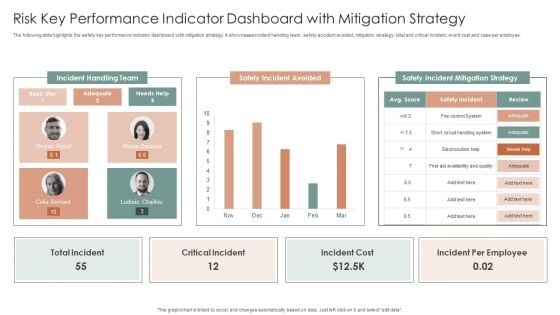
Risk Key Performance Indicator Dashboard With Mitigation Strategy Ppt Inspiration Design Templates PDF
The following slide highlights the safety key performance indicator dashboard with mitigation strategy. It showcases incident handling team, safety accident avoided, mitigation strategy, total and critical incident, event cost and case per employee. Showcasing this set of slides titled Risk Key Performance Indicator Dashboard With Mitigation Strategy Ppt Inspiration Design Templates PDF. The topics addressed in these templates are Incident Handling Team, Safety Incident Avoided, Safety Incident. All the content presented in this PPT design is completely editable. Download it and make adjustments in color, background, font etc. as per your unique business setting.
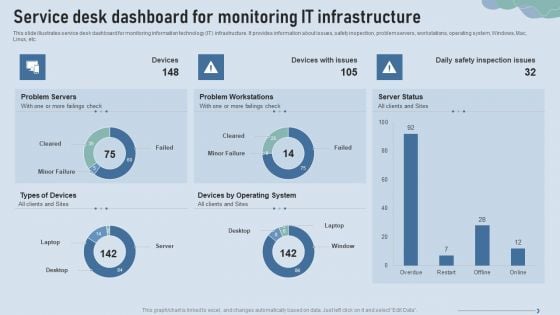
Improve IT Service Desk Service Desk Dashboard For Monitoring IT Infrastructure Introduction PDF
This slide illustrates service desk dashboard for monitoring information technology IT infrastructure. It provides information about issues, safety inspection, problem servers, workstations, operating system, Windows, Mac, Linux, etc.Deliver and pitch your topic in the best possible manner with this Improve IT Service Desk Service Desk Dashboard For Monitoring IT Infrastructure Introduction PDF. Use them to share invaluable insights on Problem Servers, Problem Workstations, Operating System and impress your audience. This template can be altered and modified as per your expectations. So, grab it now.
Customer Deal Tracking In Sales Pipeline Dashboard Improving Distribution Channel Ideas PDF
This slide covers information regarding dashboard for tracking various customer deals in sales pipeline. This is a Customer Deal Tracking In Sales Pipeline Dashboard Improving Distribution Channel Ideas PDF template with various stages. Focus and dispense information on three stages using this creative set, that comes with editable features. It contains large content boxes to add your information on topics like Proposal Sent, Terms Accepted, Customer Conversion. You can also showcase facts, figures, and other relevant content using this PPT layout. Grab it now.
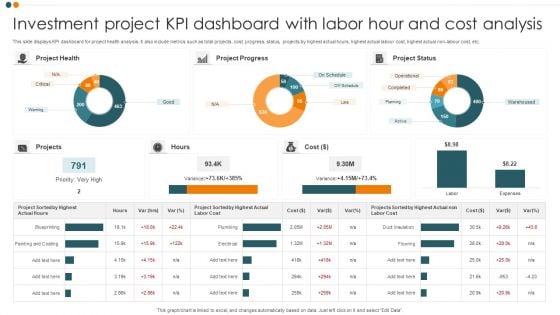
Investment Project KPI Dashboard With Labor Hour And Cost Analysis Portrait PDF
This slide displays KPI dashboard for project health analysis. It also include metrics such as total projects, cost, progress, status, projects by highest actual hours, highest actual labour cost, highest actual non-labour cost, etc. Pitch your topic with ease and precision using this Investment Project KPI Dashboard With Labor Hour And Cost Analysis Portrait PDF. This layout presents information on Project Health, Project Progress, Project Status. It is also available for immediate download and adjustment. So, changes can be made in the color, design, graphics or any other component to create a unique layout.


 Continue with Email

 Home
Home


