Market Trends
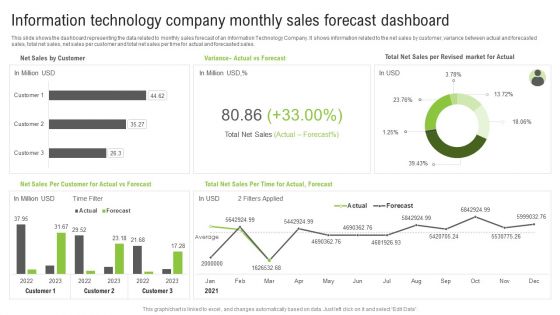
Information Technology Company Monthly Sales Forecast Dashboard Ppt Portfolio Images PDF
This slide shows the dashboard representing the data related to monthly sales forecast of an Information Technology Company. It shows information related to the net sales by customer, variance between actual and forecasted sales, total net sales, net sales per customer and total net sales per time for actual and forecasted sales. Pitch your topic with ease and precision using this Information Technology Company Monthly Sales Forecast Dashboard Ppt Portfolio Images PDF. This layout presents information on Total Net Sales, Actual vs Forecast, Net Sales Customer. It is also available for immediate download and adjustment. So, changes can be made in the color, design, graphics or any other component to create a unique layout.
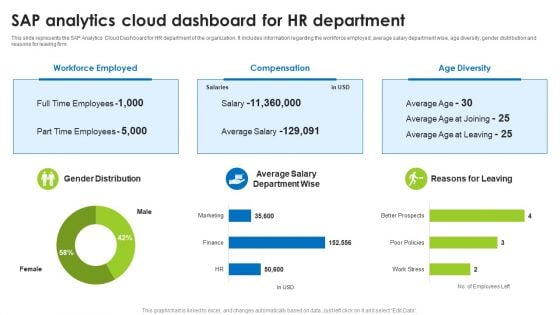
BI Technique For Data Informed Decisions Sap Analytics Cloud Dashboard For HR Department Background PDF
This slide represents the SAP Analytics Cloud Dashboard for HR department of the organization. It includes information regarding the workforce employed, average salary department wise, age diversity, gender distribution and reasons for leaving firm. This modern and well-arranged BI Technique For Data Informed Decisions Sap Analytics Cloud Dashboard For HR Department Background PDF provides lots of creative possibilities. It is very simple to customize and edit with the Powerpoint Software. Just drag and drop your pictures into the shapes. All facets of this template can be edited with Powerpoint no extra software is necessary. Add your own material, put your images in the places assigned for them, adjust the colors, and then you can show your slides to the world, with an animated slide included.
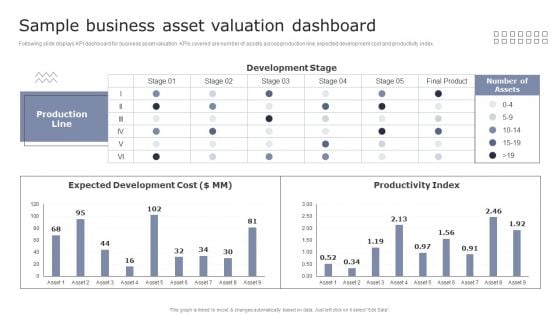
Sample Business Asset Valuation Dashboard Guide To Asset Cost Estimation Professional PDF
Following slide displays KPI dashboard for business asset valuation. KPIs covered are number of assets across production line, expected development cost and productivity index.Are you in need of a template that can accommodate all of your creative concepts This one is crafted professionally and can be altered to fit any style. Use it with Google Slides or PowerPoint. Include striking photographs, symbols, depictions, and other visuals. Fill, move around, or remove text boxes as desired. Test out color palettes and font mixtures. Edit and save your work, or work with colleagues. Download Sample Business Asset Valuation Dashboard Guide To Asset Cost Estimation Professional PDF and observe how to make your presentation outstanding. Give an impeccable presentation to your group and make your presentation unforgettable.
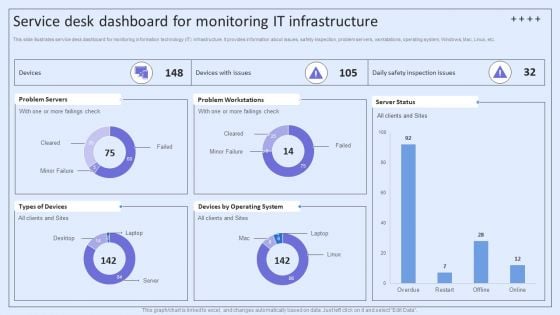
Integrating ITSM To Enhance Service Service Desk Dashboard For Monitoring It Infrastructure Infographics PDF
This slide illustrates service desk dashboard for monitoring information technology IT infrastructure. It provides information about issues, safety inspection, problem servers, workstations, operating system, Windows, Mac, Linux, etc. Do you know about Slidesgeeks Integrating ITSM To Enhance Service Service Desk Dashboard For Monitoring It Infrastructure Infographics PDF These are perfect for delivering any kind od presentation. Using it, create PowerPoint presentations that communicate your ideas and engage audiences. Save time and effort by using our pre-designed presentation templates that are perfect for a wide range of topic. Our vast selection of designs covers a range of styles, from creative to business, and are all highly customizable and easy to edit. Download as a PowerPoint template or use them as Google Slides themes.
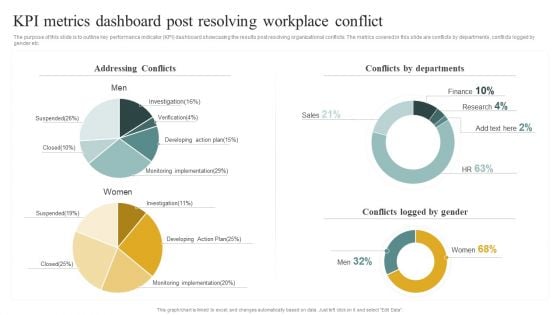
Kpi Metrics Dashboard Post Resolving Workplace Conflict Managing Organizational Conflicts To Boost Pictures PDF
The purpose of this slide is to outline key performance indicator KPI dashboard showcasing the results post resolving organizational conflicts. The metrics covered in this slide are conflicts by departments, conflicts logged by gender etc. Are you in need of a template that can accommodate all of your creative concepts This one is crafted professionally and can be altered to fit any style. Use it with Google Slides or PowerPoint. Include striking photographs, symbols, depictions, and other visuals. Fill, move around, or remove text boxes as desired. Test out color palettes and font mixtures. Edit and save your work, or work with colleagues. Download Kpi Metrics Dashboard Post Resolving Workplace Conflict Managing Organizational Conflicts To Boost Pictures PDF and observe how to make your presentation outstanding. Give an impeccable presentation to your group and make your presentation unforgettable.
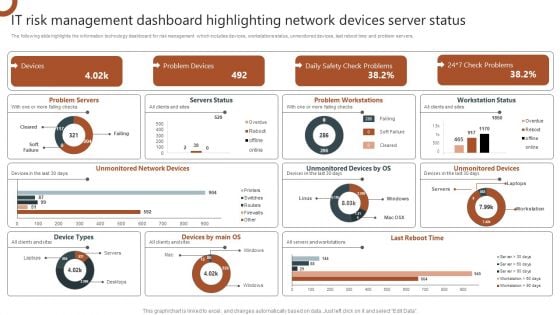
IT Risk Management Dashboard Highlighting Network Devices Server Status Pictures PDF
The following slide highlights the information technology dashboard for risk management which includes devices, workstations status, unmonitored devices, last reboot time and problem servers. Are you in need of a template that can accommodate all of your creative concepts This one is crafted professionally and can be altered to fit any style. Use it with Google Slides or PowerPoint. Include striking photographs, symbols, depictions, and other visuals. Fill, move around, or remove text boxes as desired. Test out color palettes and font mixtures. Edit and save your work, or work with colleagues. Download IT Risk Management Dashboard Highlighting Network Devices Server Status Pictures PDF and observe how to make your presentation outstanding. Give an impeccable presentation to your group and make your presentation unforgettable.
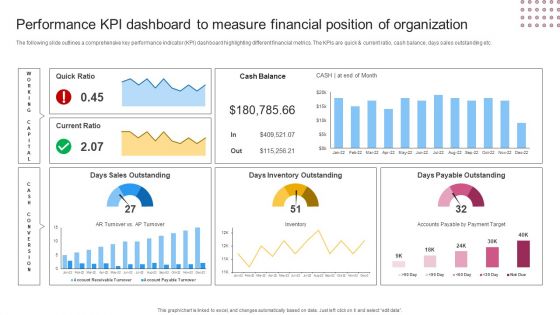
Performance KPI Dashboard To Measure Financial Position Of Organization Pictures PDF
The following slide outlines a comprehensive key performance indicator KPI dashboard highlighting different financial metrics. The KPIs are quick and current ratio, cash balance, days sales outstanding etc. Slidegeeks is here to make your presentations a breeze with Performance KPI Dashboard To Measure Financial Position Of Organization Pictures PDF With our easy to use and customizable templates, you can focus on delivering your ideas rather than worrying about formatting. With a variety of designs to choose from, you are sure to find one that suits your needs. And with animations and unique photos, illustrations, and fonts, you can make your presentation pop. So whether you are giving a sales pitch or presenting to the board, make sure to check out Slidegeeks first.
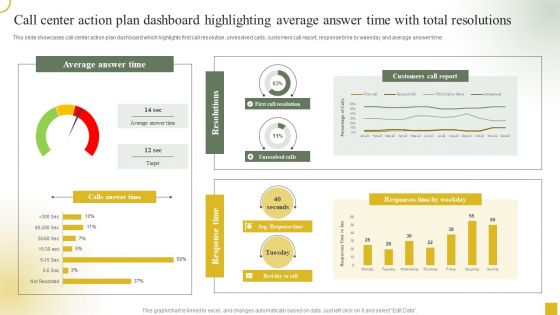
Call Center Action Plan Dashboard Highlighting Average Answer Time With Total Resolutions Template PDF
This slide showcases call center action plan dashboard which highlights first call resolution, unresolved calls, customers call report, response time by weekday and average answer time. Are you in need of a template that can accommodate all of your creative concepts This one is crafted professionally and can be altered to fit any style. Use it with Google Slides or PowerPoint. Include striking photographs, symbols, depictions, and other visuals. Fill, move around, or remove text boxes as desired. Test out color palettes and font mixtures. Edit and save your work, or work with colleagues. Download Call Center Action Plan Dashboard Highlighting Average Answer Time With Total Resolutions Template PDF and observe how to make your presentation outstanding. Give an impeccable presentation to your group and make your presentation unforgettable.
KPI Metrics Dashboard To Evaluate Facebook Video Campaign Performance Icons PDF
The following slide outlines a comprehensive KPI dashboard which can be used to analyze the performance of facebook video campaign. It provides information about page video views, page video views organic etc. Retrieve professionally designed KPI Metrics Dashboard To Evaluate Facebook Video Campaign Performance Icons PDF to effectively convey your message and captivate your listeners. Save time by selecting pre-made slideshows that are appropriate for various topics, from business to educational purposes. These themes come in many different styles, from creative to corporate, and all of them are easily adjustable and can be edited quickly. Access them as PowerPoint templates or as Google Slides themes. You do not have to go on a hunt for the perfect presentation because Slidegeeks got you covered from everywhere.
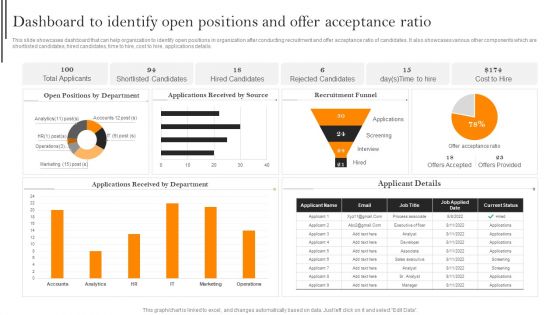
Dashboard To Identify Open Positions And Offer Acceptance Ratio Slides PDF
This slide showcases dashboard that can help organization to identify open positions in organization after conducting recruitment and offer acceptance ratio of candidates. It also showcases various other components which are shortlisted candidates, hired candidates, time to hire, cost to hire, applications details. Boost your pitch with our creative Dashboard To Identify Open Positions And Offer Acceptance Ratio Slides PDF. Deliver an awe inspiring pitch that will mesmerize everyone. Using these presentation templates you will surely catch everyones attention. You can browse the ppts collection on our website. We have researchers who are experts at creating the right content for the templates. So you do not have to invest time in any additional work. Just grab the template now and use them.
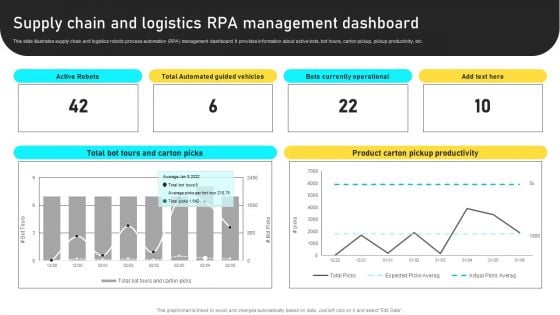
Manufacturing Process Automation For Enhancing Productivity Supply Chain And Logistics RPA Management Dashboard Diagrams PDF
This slide illustrates supply chain and logistics robotic process automation RPA management dashboard. It provides information about active bots, bot hours, carton pickup, pickup productivity, etc. Present like a pro with Manufacturing Process Automation For Enhancing Productivity Supply Chain And Logistics RPA Management Dashboard Diagrams PDF Create beautiful presentations together with your team, using our easy to use presentation slides. Share your ideas in real time and make changes on the fly by downloading our templates. So whether you are in the office, on the go, or in a remote location, you can stay in sync with your team and present your ideas with confidence. With Slidegeeks presentation got a whole lot easier. Grab these presentations today.
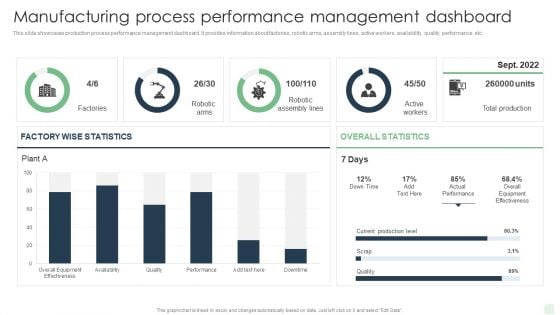
Manufacturing Process Performance Management Dashboard Automated Manufacturing Process Deployment Pictures PDF
This slide showcases production process performance management dashboard. It provides information about factories, robotic arms, assembly lines, active workers, availability, quality, performance, etc.Retrieve professionally designed Manufacturing Process Performance Management Dashboard Automated Manufacturing Process Deployment Pictures PDF to effectively convey your message and captivate your listeners. Save time by selecting pre-made slideshows that are appropriate for various topics, from business to educational purposes. These themes come in many different styles, from creative to corporate, and all of them are easily adjustable and can be edited quickly. Access them as PowerPoint templates or as Google Slides themes. You do not have to go on a hunt for the perfect presentation because Slidegeeks got you covered from everywhere.
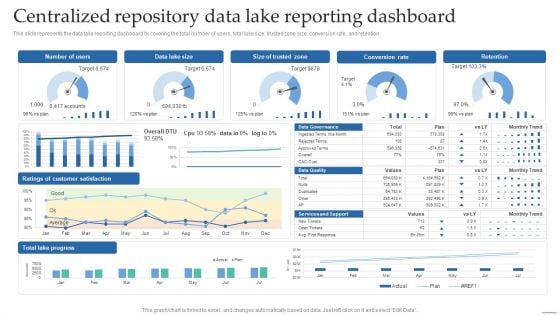
Centralized Repository Data Lake Reporting Dashboard Data Lake Creation With Hadoop Cluster Download PDF
This slide represents the data lake reporting dashboard by covering the total number of users, total lake size, trusted zone size, conversion rate, and retention.This Centralized Repository Data Lake Reporting Dashboard Data Lake Creation With Hadoop Cluster Download PDF from Slidegeeks makes it easy to present information on your topic with precision. It provides customization options, so you can make changes to the colors, design, graphics, or any other component to create a unique layout. It is also available for immediate download, so you can begin using it right away. Slidegeeks has done good research to ensure that you have everything you need to make your presentation stand out. Make a name out there for a brilliant performance.
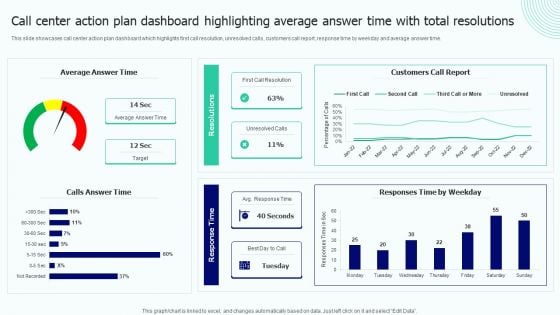
Call Center Action Plan Dashboard Highlighting Average Answer Time With Total Resolutions Designs PDF
This slide showcases call center action plan dashboard which highlights first call resolution, unresolved calls, customers call report, response time by weekday and average answer time. This Call Center Action Plan Dashboard Highlighting Average Answer Time With Total Resolutions Designs PDF from Slidegeeks makes it easy to present information on your topic with precision. It provides customization options, so you can make changes to the colors, design, graphics, or any other component to create a unique layout. It is also available for immediate download, so you can begin using it right away. Slidegeeks has done good research to ensure that you have everything you need to make your presentation stand out. Make a name out there for a brilliant performance.
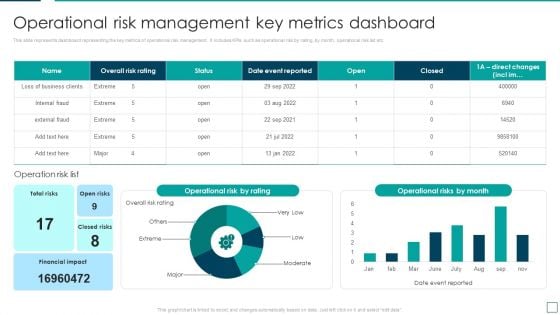
Strategic Risk Management And Mitigation Plan Operational Risk Management Key Metrics Dashboard Sample PDF
This slide represents dashboard representing the key metrics of operational risk management. It includes KPIs such as operational risk by rating, by month, operational risk list etc. Present like a pro with Strategic Risk Management And Mitigation Plan Operational Risk Management Key Metrics Dashboard Sample PDF Create beautiful presentations together with your team, using our easy to use presentation slides. Share your ideas in real time and make changes on the fly by downloading our templates. So whether you are in the office, on the go, or in a remote location, you can stay in sync with your team and present your ideas with confidence. With Slidegeeks presentation got a whole lot easier. Grab these presentations today.
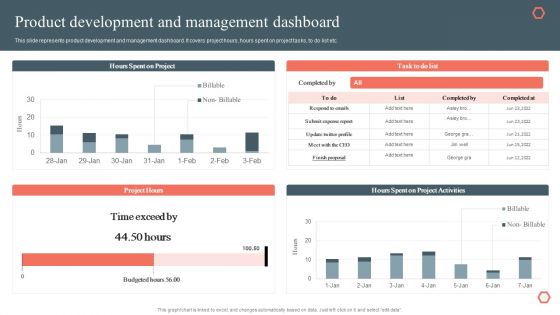
Product Development And Management Dashboard Product Development And Management Plan Brochure PDF
This slide represents product development and management dashboard. It covers project hours, hours spent on project tasks, to do list etc.Coming up with a presentation necessitates that the majority of the effort goes into the content and the message you intend to convey. The visuals of a PowerPoint presentation can only be effective if it supplements and supports the story that is being told. Keeping this in mind our experts created Product Development And Management Dashboard Product Development And Management Plan Brochure PDF to reduce the time that goes into designing the presentation. This way, you can concentrate on the message while our designers take care of providing you with the right template for the situation.
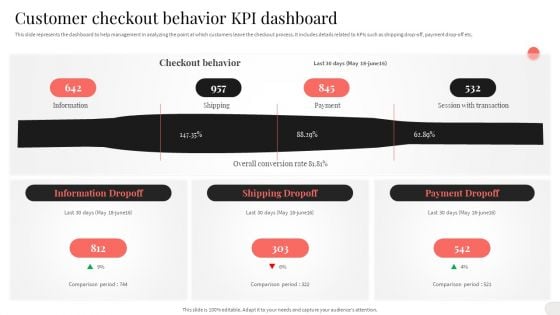
Analyzing And Implementing Effective CMS Customer Checkout Behavior KPI Dashboard Inspiration PDF
This slide represents the dashboard to help management in analyzing the point at which customers leave the checkout process. It includes details related to KPIs such as shipping drop off, payment drop off etc. Coming up with a presentation necessitates that the majority of the effort goes into the content and the message you intend to convey. The visuals of a PowerPoint presentation can only be effective if it supplements and supports the story that is being told. Keeping this in mind our experts created Analyzing And Implementing Effective CMS Customer Checkout Behavior KPI Dashboard Inspiration PDF to reduce the time that goes into designing the presentation. This way, you can concentrate on the message while our designers take care of providing you with the right template for the situation.

Organizing Security Awareness KPI Dashboard To Monitor Cyber Security Performance Ideas PDF
The purpose of this slide is to highlight key performance indicator KPI dashboard which can be used to track the performance of organization cyber security. The KPI metrics covered in the slide are asset type control, control issues by standard and regulation etc. This modern and well-arranged Organizing Security Awareness KPI Dashboard To Monitor Cyber Security Performance Ideas PDF provides lots of creative possibilities. It is very simple to customize and edit with the Powerpoint Software. Just drag and drop your pictures into the shapes. All facets of this template can be edited with Powerpoint, no extra software is necessary. Add your own material, put your images in the places assigned for them, adjust the colors, and then you can show your slides to the world, with an animated slide included.
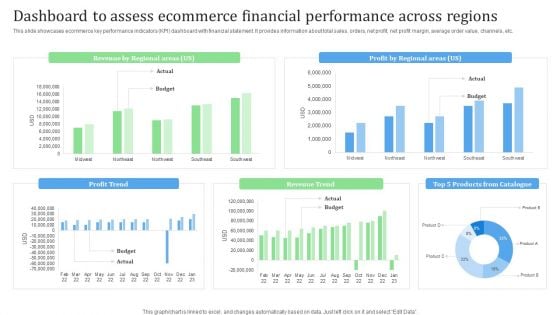
Dashboard To Assess Ecommerce Financial Performance Across Regions Financial Management Strategies Clipart PDF
This slide showcases ecommerce key performance indicators KPI dashboard with financial statement. It provides information about total sales, orders, net profit, net profit margin, average order value, channels, etc.Present like a pro with Dashboard To Assess Ecommerce Financial Performance Across Regions Financial Management Strategies Clipart PDF Create beautiful presentations together with your team, using our easy-to-use presentation slides. Share your ideas in real-time and make changes on the fly by downloading our templates. So whether you are in the office, on the go, or in a remote location, you can stay in sync with your team and present your ideas with confidence. With Slidegeeks presentation got a whole lot easier. Grab these presentations today.

Data Quality Dashboard For Linked Data Integrating Linked Data To Enhance Operational Template PDF
This slide describes the data quality dashboard for linked data by covering details of account information quality, contact details quality, financial data quality, and missing account information.This Data Quality Dashboard For Linked Data Integrating Linked Data To Enhance Operational Template PDF from Slidegeeks makes it easy to present information on your topic with precision. It provides customization options, so you can make changes to the colors, design, graphics, or any other component to create a unique layout. It is also available for immediate download, so you can begin using it right away. Slidegeeks has done good research to ensure that you have everything you need to make your presentation stand out. Make a name out there for a brilliant performance.

Integrating AML And Transaction Dashboard For Monitoring Fraud And Money Guidelines PDF
This slide showcases dashboard for monitoring fraudulent and money laundering transactions. It provides information about legitimacy, total transaction, unusual transactions, bank, client, investigation, in peer review, etc. Slidegeeks is here to make your presentations a breeze with Integrating AML And Transaction Dashboard For Monitoring Fraud And Money Guidelines PDF With our easy-to-use and customizable templates, you can focus on delivering your ideas rather than worrying about formatting. With a variety of designs to choose from, youre sure to find one that suits your needs. And with animations and unique photos, illustrations, and fonts, you can make your presentation pop. So whether youre giving a sales pitch or presenting to the board, make sure to check out Slidegeeks first.
Agile Product Development Agile Project Management Activities Tracking Dashboard Icons PDF
This slide provides information regarding the dashboard which will help team in managing different activities associated to agile projects and keep track on the time, task summary, etc. Are you in need of a template that can accommodate all of your creative concepts This one is crafted professionally and can be altered to fit any style. Use it with Google Slides or PowerPoint. Include striking photographs, symbols, depictions, and other visuals. Fill, move around, or remove text boxes as desired. Test out color palettes and font mixtures. Edit and save your work, or work with colleagues. Download Agile Product Development Agile Project Management Activities Tracking Dashboard Icons PDF and observe how to make your presentation outstanding. Give an impeccable presentation to your group and make your presentation unforgettable.
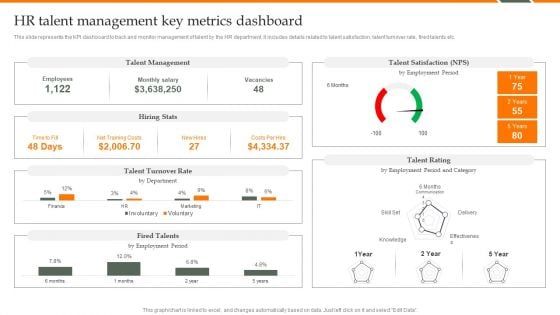
Human Resource Analytics HR Talent Management Key Metrics Dashboard Brochure PDF
This slide represents the KPI dashboard to track and monitor management of talent by the HR department. It includes details related to talent satisfaction, talent turnover rate, fired talents etc. Coming up with a presentation necessitates that the majority of the effort goes into the content and the message you intend to convey. The visuals of a PowerPoint presentation can only be effective if it supplements and supports the story that is being told. Keeping this in mind our experts created Human Resource Analytics HR Talent Management Key Metrics Dashboard Brochure PDF to reduce the time that goes into designing the presentation. This way, you can concentrate on the message while our designers take care of providing you with the right template for the situation.
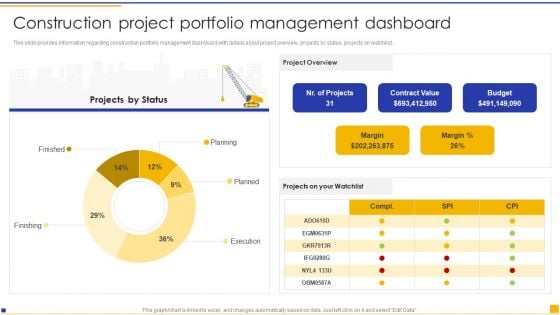
Construction Project Instructions Playbook Construction Project Portfolio Management Dashboard Structure PDF
This slide provides information regarding construction portfolio management dashboard with details about project overview, projects by status, projects on watchlist. Are you in need of a template that can accommodate all of your creative concepts This one is crafted professionally and can be altered to fit any style. Use it with Google Slides or PowerPoint. Include striking photographs, symbols, depictions, and other visuals. Fill, move around, or remove text boxes as desired. Test out color palettes and font mixtures. Edit and save your work, or work with colleagues. Download Construction Project Instructions Playbook Construction Project Portfolio Management Dashboard Structure PDF and observe how to make your presentation outstanding. Give an impeccable presentation to your group and make your presentation unforgettable.
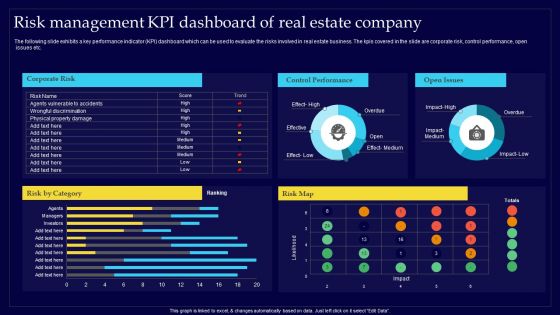
Executing Risk Mitigation Risk Management KPI Dashboard Of Real Estate Company Portrait PDF
The following slide exhibits a key performance indicator KPI dashboard which can be used to evaluate the risks involved in real estate business. The kpis covered in the slide are corporate risk, control performance, open issues etc. This modern and well-arranged Executing Risk Mitigation Risk Management KPI Dashboard Of Real Estate Company Portrait PDF provides lots of creative possibilities. It is very simple to customize and edit with the Powerpoint Software. Just drag and drop your pictures into the shapes. All facets of this template can be edited with Powerpoint, no extra software is necessary. Add your own material, put your images in the places assigned for them, adjust the colors, and then you can show your slides to the world, with an animated slide included.
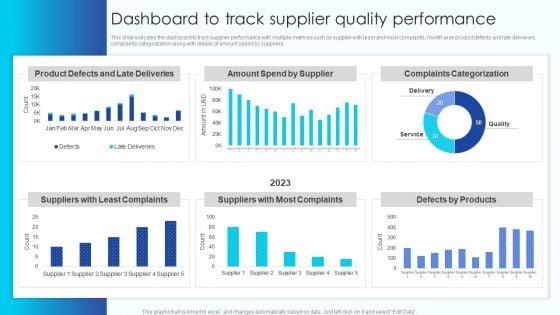
Dashboard To Track Supplier Quality Performance Vendor Management Program For Supplier Infographics PDF
This slide indicates the dashboard to track supplier performance with multiple metrices such as supplier with least and most complaints, month wise product defects and late deliveries, complaints categorization along with details of amount spend by suppliers.Boost your pitch with our creative Dashboard To Track Supplier Quality Performance Vendor Management Program For Supplier Infographics PDF. Deliver an awe-inspiring pitch that will mesmerize everyone. Using these presentation templates you will surely catch everyones attention. You can browse the ppts collection on our website. We have researchers who are experts at creating the right content for the templates. So you do not have to invest time in any additional work. Just grab the template now and use them.
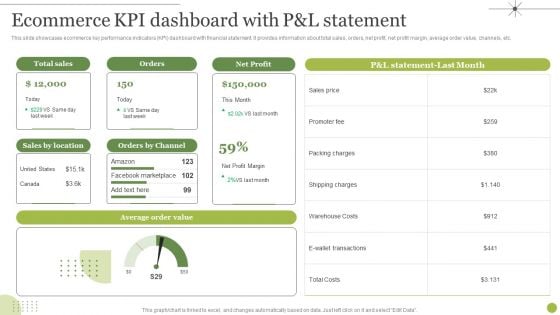
Managing E Commerce Business Accounting Ecommerce KPI Dashboard With P And L Statement Diagrams PDF
This slide showcases ecommerce key performance indicators KPI dashboard with financial statement. It provides information about total sales, orders, net profit, net profit margin, average order value, channels, etc. Present like a pro with Managing E Commerce Business Accounting Ecommerce KPI Dashboard With P And L Statement Diagrams PDF Create beautiful presentations together with your team, using our easy to use presentation slides. Share your ideas in real time and make changes on the fly by downloading our templates. So whether you are in the office, on the go, or in a remote location, you can stay in sync with your team and present your ideas with confidence. With Slidegeeks presentation got a whole lot easier. Grab these presentations today.
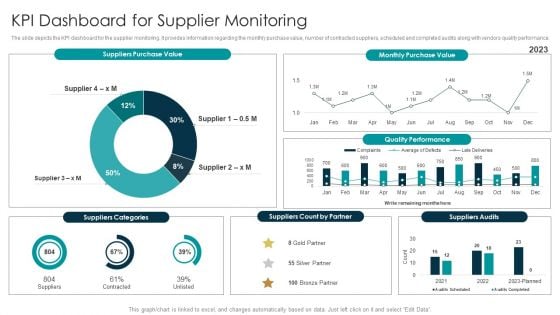
Tactical Approach For Vendor Reskilling KPI Dashboard For Supplier Monitoring Slides PDF
The slide depicts the KPI dashboard for the supplier monitoring. It provides information regarding the monthly purchase value, number of contracted suppliers, scheduled and completed audits along with vendors quality performance. Coming up with a presentation necessitates that the majority of the effort goes into the content and the message you intend to convey. The visuals of a PowerPoint presentation can only be effective if it supplements and supports the story that is being told. Keeping this in mind our experts created Tactical Approach For Vendor Reskilling KPI Dashboard For Supplier Monitoring Slides PDF to reduce the time that goes into designing the presentation. This way, you can concentrate on the message while our designers take care of providing you with the right template for the situation.
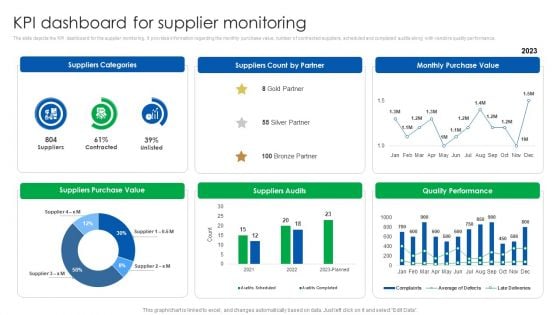
Vendor Relationship Management Strategic Plan KPI Dashboard For Supplier Monitoring Infographics PDF
The slide depicts the KPI dashboard for the supplier monitoring. It provides information regarding the monthly purchase value, number of contracted suppliers, scheduled and completed audits along with vendors quality performance. Coming up with a presentation necessitates that the majority of the effort goes into the content and the message you intend to convey. The visuals of a PowerPoint presentation can only be effective if it supplements and supports the story that is being told. Keeping this in mind our experts created Vendor Relationship Management Strategic Plan KPI Dashboard For Supplier Monitoring Infographics PDF to reduce the time that goes into designing the presentation. This way, you can concentrate on the message while our designers take care of providing you with the right template for the situation.
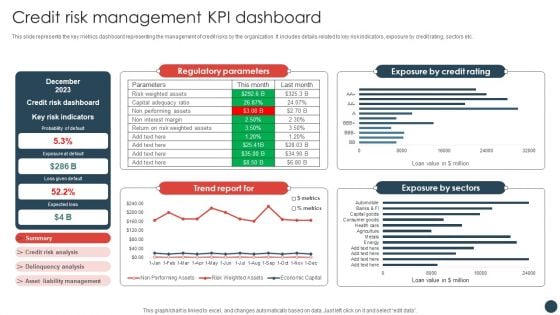
Strategic Risk Management Plan Credit Risk Management KPI Dashboard Information PDF
This slide represents the key metrics dashboard representing the management of credit risks by the organization. It includes details related to key risk indicators, exposure by credit rating, sectors etc.Coming up with a presentation necessitates that the majority of the effort goes into the content and the message you intend to convey. The visuals of a PowerPoint presentation can only be effective if it supplements and supports the story that is being told. Keeping this in mind our experts created Strategic Risk Management Plan Credit Risk Management KPI Dashboard Information PDF to reduce the time that goes into designing the presentation. This way, you can concentrate on the message while our designers take care of providing you with the right template for the situation.
IT Business Alignment Framework Dashboard For Tracking Business And IT Alignment Diagrams PDF
This slide depicts the dashboard for business and IT alignment by covering details of total sales, customer support service, percentage of business operations aligned IT, usage of communication channels, and top performer associates.This IT Business Alignment Framework Dashboard For Tracking Business And IT Alignment Diagrams PDF from Slidegeeks makes it easy to present information on your topic with precision. It provides customization options, so you can make changes to the colors, design, graphics, or any other component to create a unique layout. It is also available for immediate download, so you can begin using it right away. Slidegeeks has done good research to ensure that you have everything you need to make your presentation stand out. Make a name out there for a brilliant performance.
Digital Resilience Biomarker Technologies IT Dashboard For Digital Biomarkers Tracking Elements PDF
This slide represents the dashboard for digital biomarkers tracking, and it covers details about coughing, talking, physical activity, respiration, cardiac activity, body orientation, and snoring, including the date and time of these activities. Present like a pro with Digital Resilience Biomarker Technologies IT Dashboard For Digital Biomarkers Tracking Elements PDF Create beautiful presentations together with your team, using our easy to use presentation slides. Share your ideas in real time and make changes on the fly by downloading our templates. So whether you are in the office, on the go, or in a remote location, you can stay in sync with your team and present your ideas with confidence. With Slidegeeks presentation got a whole lot easier. Grab these presentations today.
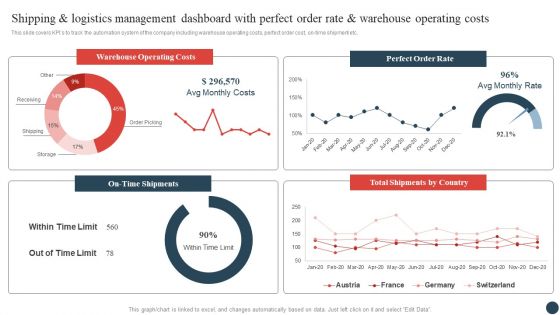
Shipping And Logistics Management Dashboard With Perfect Order Rate And Warehouse Operating Costs Topics PDF
This slide covers KPIs to track the automation system of the company including warehouse operating costs, perfect order cost, on-time shipment etc. Do you have to make sure that everyone on your team knows about any specific topic I yes, then you should give Shipping And Logistics Management Dashboard With Perfect Order Rate And Warehouse Operating Costs Topics PDF a try. Our experts have put a lot of knowledge and effort into creating this impeccable Shipping And Logistics Management Dashboard With Perfect Order Rate And Warehouse Operating Costs Topics PDF. You can use this template for your upcoming presentations, as the slides are perfect to represent even the tiniest detail. You can download these templates from the Slidegeeks website and these are easy to edit. So grab these today.
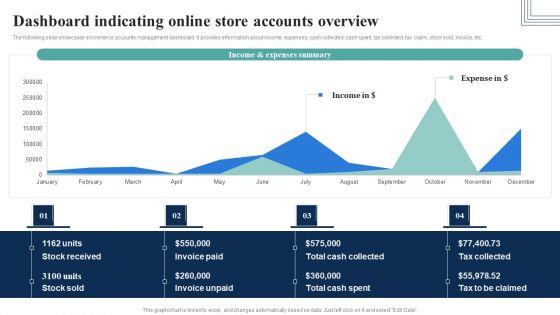
How Electronic Commerce Financial Procedure Can Be Enhanced Dashboard Indicating Online Store Pictures PDF
The following slide showcases ecommerce accounts management dashboard. It provides information about income, expenses, cash collected, cash spent, tax collected, tax claim, stock sold, invoice, etc.Do you know about Slidesgeeks How Electronic Commerce Financial Procedure Can Be Enhanced Dashboard Indicating Online Store Pictures PDF These are perfect for delivering any kind od presentation. Using it, create PowerPoint presentations that communicate your ideas and engage audiences. Save time and effort by using our pre-designed presentation templates that are perfect for a wide range of topic. Our vast selection of designs covers a range of styles, from creative to business, and are all highly customizable and easy to edit. Download as a PowerPoint template or use them as Google Slides themes.
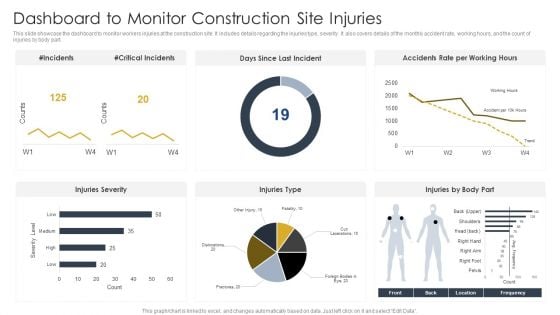
Dashboard To Monitor Construction Site Injuries Construction Site Safety Plan Elements PDF
This slide showcase the dashboard to monitor workers injuries at the construction site. It includes details regarding the injuries type, severity. It also covers details of the monthly accident rate, working hours, and the count of injuries by body part. Coming up with a presentation necessitates that the majority of the effort goes into the content and the message you intend to convey. The visuals of a PowerPoint presentation can only be effective if it supplements and supports the story that is being told. Keeping this in mind our experts created Dashboard To Monitor Construction Site Injuries Construction Site Safety Plan Elements PDF to reduce the time that goes into designing the presentation. This way, you can concentrate on the message while our designers take care of providing you with the right template for the situation.
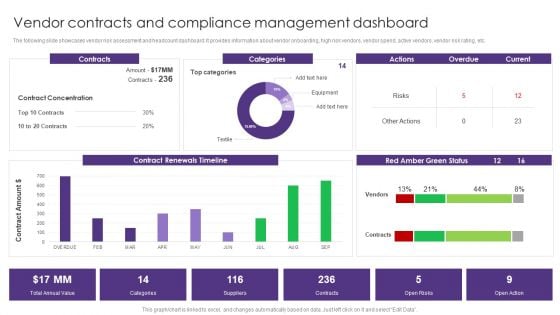
Vendor Contracts And Compliance Management Dashboard Vendor Management System Deployment Portrait PDF
The following slide showcases vendor risk assessment and headcount dashboard. It provides information about vendor onboarding, high risk vendors, vendor spend, active vendors, vendor risk rating, etc. Retrieve professionally designed Vendor Contracts And Compliance Management Dashboard Vendor Management System Deployment Portrait PDF to effectively convey your message and captivate your listeners. Save time by selecting pre-made slideshows that are appropriate for various topics, from business to educational purposes. These themes come in many different styles, from creative to corporate, and all of them are easily adjustable and can be edited quickly. Access them as PowerPoint templates or as Google Slides themes. You do not have to go on a hunt for the perfect presentation because Slidegeeks got you covered from everywhere.
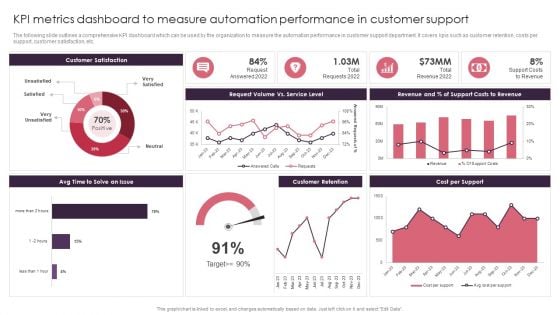
KPI Metrics Dashboard To Measure Automation Performance In Customer Support Themes PDF
The following slide outlines a comprehensive KPI dashboard which can be used by the organization to measure the automation performance in customer support department. It covers kpis such as customer retention, costs per support, customer satisfaction, etc. Present like a pro with KPI Metrics Dashboard To Measure Automation Performance In Customer Support Themes PDF Create beautiful presentations together with your team, using our easy to use presentation slides. Share your ideas in real time and make changes on the fly by downloading our templates. So whether you are in the office, on the go, or in a remote location, you can stay in sync with your team and present your ideas with confidence. With Slidegeeks presentation got a whole lot easier. Grab these presentations today.
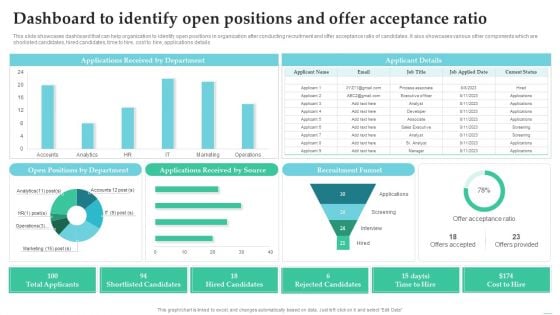
Employing Candidate Using Internal And External Mediums Of Recruitment Dashboard To Identify Open Positions Microsoft PDF
This slide showcases dashboard that can help organization to identify open positions in organization after conducting recruitment and offer acceptance ratio of candidates. It also showcases various other components which are shorlisted candidates, hired candidates, time to hire, cost to hire, applications details. Present like a pro with Employing Candidate Using Internal And External Mediums Of Recruitment Dashboard To Identify Open Positions Microsoft PDF Create beautiful presentations together with your team, using our easy to use presentation slides. Share your ideas in real time and make changes on the fly by downloading our templates. So whether you are in the office, on the go, or in a remote location, you can stay in sync with your team and present your ideas with confidence. With Slidegeeks presentation got a whole lot easier. Grab these presentations today.
Dashboard For Tracking Social Media Platforms Consumer Contact Point Guide Graphics PDF
This slide covers the KPI dashboard for analyzing social media channels. It includes metrics such as social media followers, Facebook daily reach, Facebook engaged users and page impressions, etc. Retrieve professionally designed Dashboard For Tracking Social Media Platforms Consumer Contact Point Guide Graphics PDF to effectively convey your message and captivate your listeners. Save time by selecting pre-made slideshows that are appropriate for various topics, from business to educational purposes. These themes come in many different styles, from creative to corporate, and all of them are easily adjustable and can be edited quickly. Access them as PowerPoint templates or as Google Slides themes. You do not have to go on a hunt for the perfect presentation because Slidegeeks got you covered from everywhere.
Referral Program Performance Tracking Dashboard Consumer Contact Point Guide Icons PDF
This slide covers the KPI dashboard for analyzing referral campaign results. It includes metrics such as total revenue generated, monthly recurring revenue, new customers, clicks, cancelled customers, paying customers, etc. Are you in need of a template that can accommodate all of your creative concepts This one is crafted professionally and can be altered to fit any style. Use it with Google Slides or PowerPoint. Include striking photographs, symbols, depictions, and other visuals. Fill, move around, or remove text boxes as desired. Test out color palettes and font mixtures. Edit and save your work, or work with colleagues. Download Referral Program Performance Tracking Dashboard Consumer Contact Point Guide Icons PDF and observe how to make your presentation outstanding. Give an impeccable presentation to your group and make your presentation unforgettable.
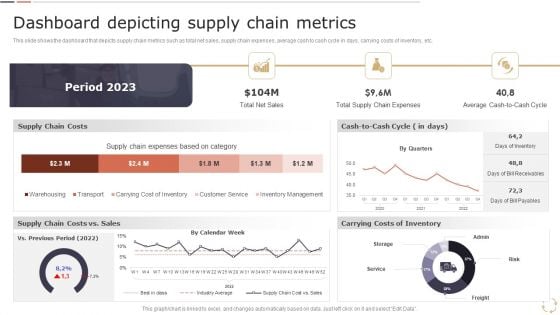
Optimizing Logistics Models To Enhance Supply Chain Management Dashboard Depicting Supply Chain Metrics Download PDF
This slide shows the dashboard that depicts supply chain metrics such as total net sales, supply chain expenses, average cash to cash cycle in days, carrying costs of inventory, etc. Coming up with a presentation necessitates that the majority of the effort goes into the content and the message you intend to convey. The visuals of a PowerPoint presentation can only be effective if it supplements and supports the story that is being told. Keeping this in mind our experts created Optimizing Logistics Models To Enhance Supply Chain Management Dashboard Depicting Supply Chain Metrics Download PDF to reduce the time that goes into designing the presentation. This way, you can concentrate on the message while our designers take care of providing you with the right template for the situation.
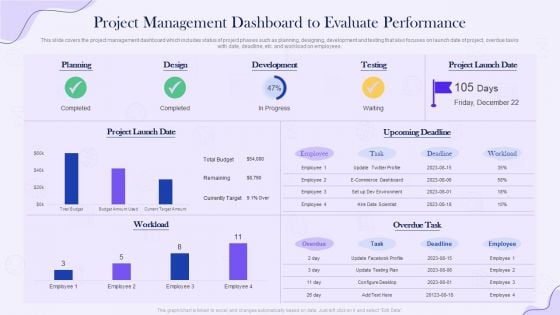
Project Time Management Execution Strategies Project Management Dashboard To Evaluate Performance Template PDF
This slide covers the project management dashboard which includes status of project phases such as planning, designing, development and testing that also focuses on launch date of project, overdue tasks with date, deadline, etc. and workload on employees. Coming up with a presentation necessitates that the majority of the effort goes into the content and the message you intend to convey. The visuals of a PowerPoint presentation can only be effective if it supplements and supports the story that is being told. Keeping this in mind our experts created Project Time Management Execution Strategies Project Management Dashboard To Evaluate Performance Template PDF to reduce the time that goes into designing the presentation. This way, you can concentrate on the message while our designers take care of providing you with the right template for the situation.
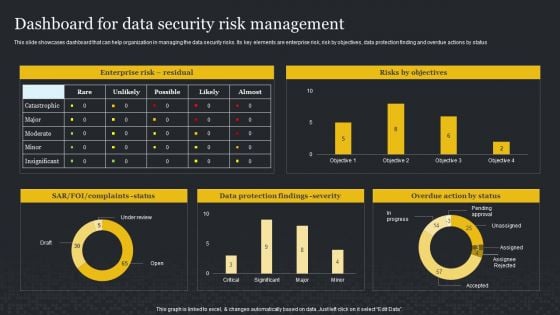
Dashboard For Data Security Risk Management Cybersecurity Risk Assessment Template PDF
This slide showcases dashboard that can help organization in managing the data security risks. Its key elements are enterprise risk, risk by objectives, data protection finding and overdue actions by status. Welcome to our selection of the Dashboard For Data Security Risk Management Cybersecurity Risk Assessment Template PDF. These are designed to help you showcase your creativity and bring your sphere to life. Planning and Innovation are essential for any business that is just starting out. This collection contains the designs that you need for your everyday presentations. All of our PowerPoints are 100 parcent editable, so you can customize them to suit your needs. This multi-purpose template can be used in various situations. Grab these presentation templates today.
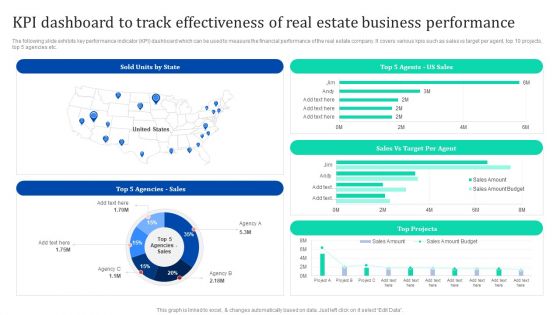
KPI Dashboard To Track Effectiveness Of Real Estate Business Enhancing Process Improvement By Regularly Themes PDF
The following slide exhibits key performance indicator KPI dashboard which can be used to measure the financial performance of the real estate company. It covers various kpis such as sales vs target per agent, top 10 projects, top 5 agencies etc. Welcome to our selection of the KPI Dashboard To Track Effectiveness Of Real Estate Business Enhancing Process Improvement By Regularly Themes PDF. These are designed to help you showcase your creativity and bring your sphere to life. Planning and Innovation are essential for any business that is just starting out. This collection contains the designs that you need for your everyday presentations. All of our PowerPoints are 100 parcent editable, so you can customize them to suit your needs. This multi-purpose template can be used in various situations. Grab these presentation templates today.
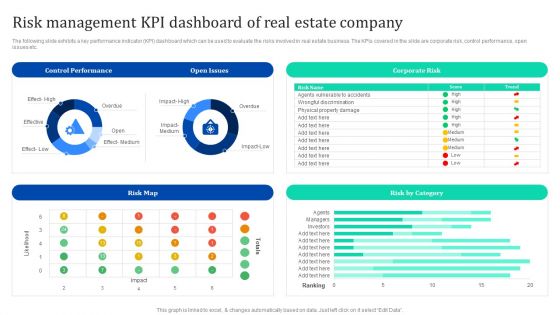
Risk Management Kpi Dashboard Of Real Estate Company Enhancing Process Improvement By Regularly Inspiration PDF
The following slide exhibits a key performance indicator KPI dashboard which can be used to evaluate the risks involved in real estate business. The KPIs covered in the slide are corporate risk, control performance, open issues etc. This Risk Management Kpi Dashboard Of Real Estate Company Enhancing Process Improvement By Regularly Inspiration PDF from Slidegeeks makes it easy to present information on your topic with precision. It provides customization options, so you can make changes to the colors, design, graphics, or any other component to create a unique layout. It is also available for immediate download, so you can begin using it right away. Slidegeeks has done good research to ensure that you have everything you need to make your presentation stand out. Make a name out there for a brilliant performance.
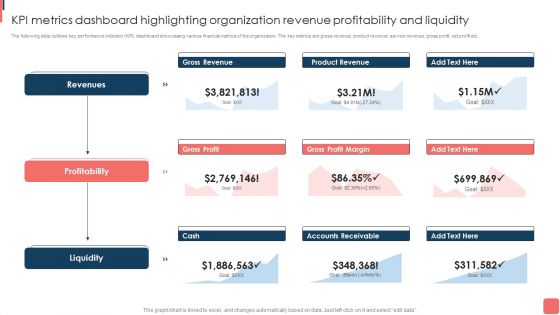
KPI Metrics Dashboard Highlighting Organization Revenue Profitability And Liquidity Template PDF
The following slide outlines key performance indicator KPI dashboard showcasing various financial metrics of the organization. The key metrics are gross revenue, product revenue, service revenue, gross profit, net profit etc. This KPI Metrics Dashboard Highlighting Organization Revenue Profitability And Liquidity Template PDF from Slidegeeks makes it easy to present information on your topic with precision. It provides customization options, so you can make changes to the colors, design, graphics, or any other component to create a unique layout. It is also available for immediate download, so you can begin using it right away. Slidegeeks has done good research to ensure that you have everything you need to make your presentation stand out. Make a name out there for a brilliant performance.
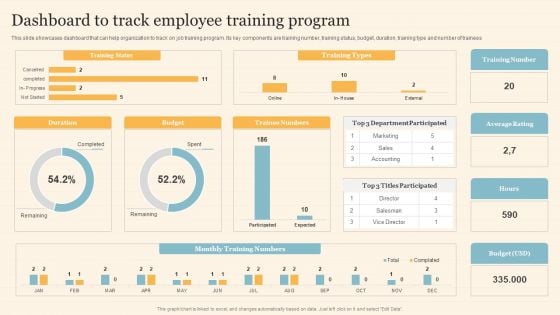
Staff On Job Coaching Program For Skills Enhancement Dashboard To Track Employee Training Program Professional PDF
This slide showcases dashboard that can help organization to track on job training program. Its key components are training number, training status, budget, duration, training type and number of trainees. This Staff On Job Coaching Program For Skills Enhancement Dashboard To Track Employee Training Program Professional PDF from Slidegeeks makes it easy to present information on your topic with precision. It provides customization options, so you can make changes to the colors, design, graphics, or any other component to create a unique layout. It is also available for immediate download, so you can begin using it right away. Slidegeeks has done good research to ensure that you have everything you need to make your presentation stand out. Make a name out there for a brilliant performance.

Workplace Training Techniques For Departments And Individual Staff Dashboard For Training Program Evaluation Ideas PDF
This slide showcases dashboard that can help organization to evaluate the training program implemented in organization. Its key components are training cost, number of participants, hours of training, cost per participant and occupancy rate. This Workplace Training Techniques For Departments And Individual Staff Dashboard For Training Program Evaluation Ideas PDF from Slidegeeks makes it easy to present information on your topic with precision. It provides customization options, so you can make changes to the colors, design, graphics, or any other component to create a unique layout. It is also available for immediate download, so you can begin using it right away. Slidegeeks has done good research to ensure that you have everything you need to make your presentation stand out. Make a name out there for a brilliant performance.
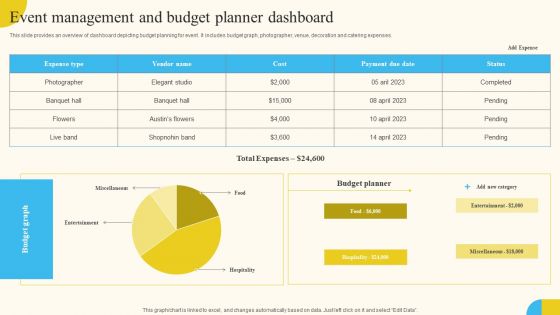
Event Management And Budget Planner Dashboard Activities For Successful Launch Event Sample PDF
This slide provides an overview of dashboard depicting budget planning for event. It includes budget graph, photographer, venue, decoration and catering expenses. Do you know about Slidesgeeks Event Management And Budget Planner Dashboard Activities For Successful Launch Event Sample PDF These are perfect for delivering any kind od presentation. Using it, create PowerPoint presentations that communicate your ideas and engage audiences. Save time and effort by using our pre-designed presentation templates that are perfect for a wide range of topic. Our vast selection of designs covers a range of styles, from creative to business, and are all highly customizable and easy to edit. Download as a PowerPoint template or use them as Google Slides themes.
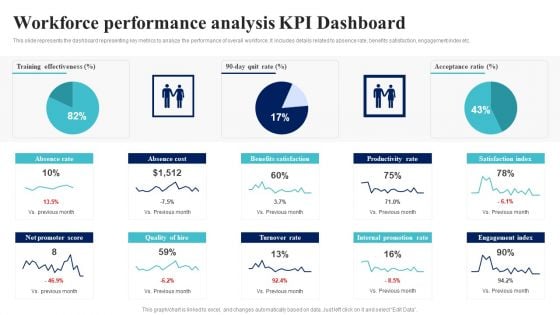
BI Implementation To Enhance Hiring Process Workforce Performance Analysis Kpi Dashboard Formats PDF
This slide represents the dashboard representing key metrics to analyze the performance of overall workforce. It includes details related to absence rate, benefits satisfaction, engagement index etc.Are you in need of a template that can accommodate all of your creative concepts This one is crafted professionally and can be altered to fit any style. Use it with Google Slides or PowerPoint. Include striking photographs, symbols, depictions, and other visuals. Fill, move around, or remove text boxes as desired. Test out color palettes and font mixtures. Edit and save your work, or work with colleagues. Download BI Implementation To Enhance Hiring Process Workforce Performance Analysis Kpi Dashboard Formats PDF and observe how to make your presentation outstanding. Give an impeccable presentation to your group and make your presentation unforgettable.
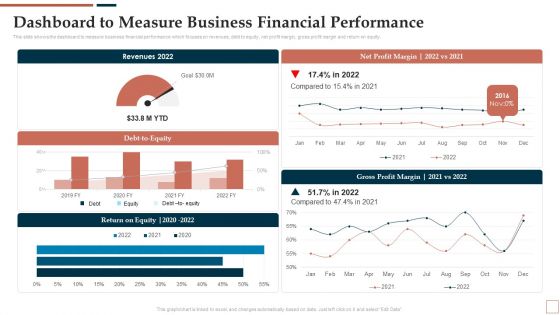
BPR To Develop Operational Effectiveness Dashboard To Measure Business Financial Performance Elements PDF
This slide shows the dashboard to measure business financial performance which focuses on revenues, debt to equity, net profit margin, gross profit margin and return on equity. Coming up with a presentation necessitates that the majority of the effort goes into the content and the message you intend to convey. The visuals of a PowerPoint presentation can only be effective if it supplements and supports the story that is being told. Keeping this in mind our experts created BPR To Develop Operational Effectiveness Dashboard To Measure Business Financial Performance Elements PDF to reduce the time that goes into designing the presentation. This way, you can concentrate on the message while our designers take care of providing you with the right template for the situation.

Employee Training And Development Strategy Dashboard For Training Program Evaluation Mockup PDF
This slide showcases dashboard that can help organization to evaluate the training program implemented in organization. Its key components are training cost, number of participants, hours of training, cost per participant and occupancy rate. This Employee Training And Development Strategy Dashboard For Training Program Evaluation Mockup PDF from Slidegeeks makes it easy to present information on your topic with precision. It provides customization options, so you can make changes to the colors, design, graphics, or any other component to create a unique layout. It is also available for immediate download, so you can begin using it right away. Slidegeeks has done good research to ensure that you have everything you need to make your presentation stand out. Make a name out there for a brilliant performance.
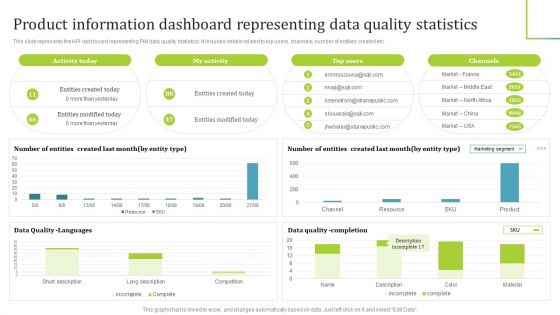
PIM Software Deployment To Enhance Conversion Rates Product Information Dashboard Representing Data Quality Statistics Download PDF
This slide represents the KPI dashboard representing PIM data quality statistics. It includes details related to top users, channels, number of entities created etc. Coming up with a presentation necessitates that the majority of the effort goes into the content and the message you intend to convey. The visuals of a PowerPoint presentation can only be effective if it supplements and supports the story that is being told. Keeping this in mind our experts created PIM Software Deployment To Enhance Conversion Rates Product Information Dashboard Representing Data Quality Statistics Download PDF to reduce the time that goes into designing the presentation. This way, you can concentrate on the message while our designers take care of providing you with the right template for the situation.
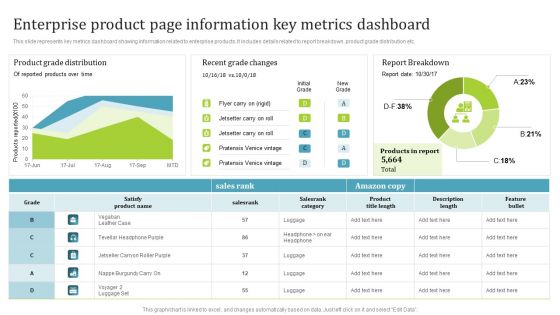
PIM Software Deployment To Enhance Conversion Rates Enterprise Product Page Information Key Metrics Dashboard Mockup PDF
This slide represents key metrics dashboard showing information related to enterprise products. It includes details related to report breakdown, product grade distribution etc. This PIM Software Deployment To Enhance Conversion Rates Enterprise Product Page Information Key Metrics Dashboard Mockup PDF from Slidegeeks makes it easy to present information on your topic with precision. It provides customization options, so you can make changes to the colors, design, graphics, or any other component to create a unique layout. It is also available for immediate download, so you can begin using it right away. Slidegeeks has done good research to ensure that you have everything you need to make your presentation stand out. Make a name out there for a brilliant performance.
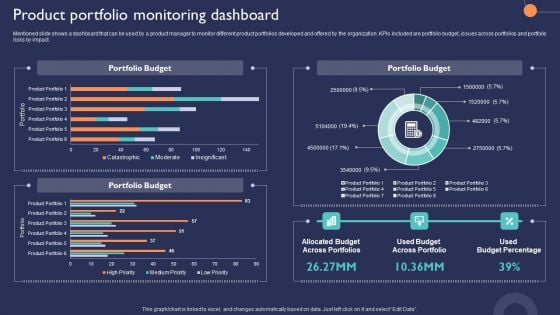
Introduction To New Product Portfolio Product Portfolio Monitoring Dashboard Ppt Portfolio Background PDF
Mentioned slide shows a dashboard that can be used by a product manager to monitor different product portfolios developed and offered by the organization. KPIs included are portfolio budget, issues across portfolios and portfolio risks by impact. Welcome to our selection of the Introduction To New Product Portfolio Product Portfolio Monitoring Dashboard Ppt Portfolio Background PDF. These are designed to help you showcase your creativity and bring your sphere to life. Planning and Innovation are essential for any business that is just starting out. This collection contains the designs that you need for your everyday presentations. All of our PowerPoints are 100 percent editable, so you can customize them to suit your needs. This multi-purpose template can be used in various situations. Grab these presentation templates today.
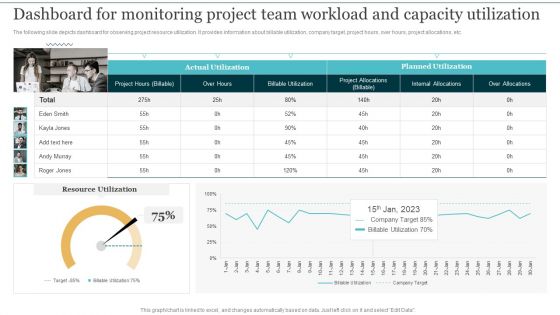
Dashboard For Monitoring Project Team Workload Integrating Cloud Computing To Enhance Projects Effectiveness Summary PDF
The following slide depicts dashboard for observing project resource utilization. It provides information about billable utilization, company target, project hours, over hours, project allocations, etc. Present like a pro with Dashboard For Monitoring Project Team Workload Integrating Cloud Computing To Enhance Projects Effectiveness Summary PDF Create beautiful presentations together with your team, using our easy to use presentation slides. Share your ideas in real time and make changes on the fly by downloading our templates. So whether you are in the office, on the go, or in a remote location, you can stay in sync with your team and present your ideas with confidence. With Slidegeeks presentation got a whole lot easier. Grab these presentations today.
Software Implementation Project Progress Tracking Dashboard Application Deployment Project Plan Graphics PDF
This slide represents the dashboard to track the progress of software implementation project. It includes details related to health, tasks, project, time, cost and workload of software implementation project. Retrieve professionally designed Software Implementation Project Progress Tracking Dashboard Application Deployment Project Plan Graphics PDF to effectively convey your message and captivate your listeners. Save time by selecting pre made slideshows that are appropriate for various topics, from business to educational purposes. These themes come in many different styles, from creative to corporate, and all of them are easily adjustable and can be edited quickly. Access them as PowerPoint templates or as Google Slides themes. You do not have to go on a hunt for the perfect presentation because Slidegeeks got you covered from everywhere.

Internal Employee Succession Dashboard To Measure Employee Turnover Rate Rules PDF
This slide shows a dashboard that can be used by a firm to measure its employee turnover rate at different locations. It also portraits details about annual fluctuation rate along with number of leavers. This Internal Employee Succession Dashboard To Measure Employee Turnover Rate Rules PDF from Slidegeeks makes it easy to present information on your topic with precision. It provides customization options, so you can make changes to the colors, design, graphics, or any other component to create a unique layout. It is also available for immediate download, so you can begin using it right away. Slidegeeks has done good research to ensure that you have everything you need to make your presentation stand out. Make a name out there for a brilliant performance.
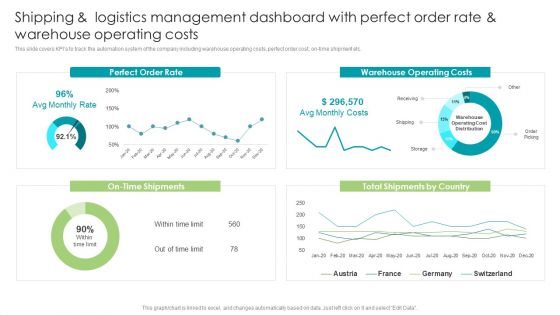
Robotic Process Automation Shipping And Logistics Management Dashboard With Perfect Brochure PDF
This slide covers KPIs to track the automation system of the company including warehouse operating costs, perfect order cost, on-time shipment etc. Find highly impressive Robotic Process Automation Shipping And Logistics Management Dashboard With Perfect Brochure PDF on Slidegeeks to deliver a meaningful presentation. You can save an ample amount of time using these presentation templates. No need to worry to prepare everything from scratch because Slidegeeks experts have already done a huge research and work for you. You need to download Robotic Process Automation Shipping And Logistics Management Dashboard With Perfect Brochure PDF for your upcoming presentation. All the presentation templates are 100 percent editable and you can change the color and personalize the content accordingly. Download now
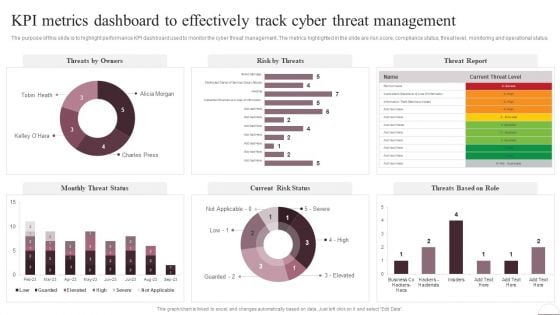
Prevention Of Information KPI Metrics Dashboard To Effectively Track Cyber Guidelines PDF
The purpose of this slide is to highlight performance KPI dashboard used to monitor the cyber threat management. The metrics highlighted in the slide are risk score, compliance status, threat level, monitoring and operational status. Welcome to our selection of the Prevention Of Information KPI Metrics Dashboard To Effectively Track Cyber Guidelines PDF. These are designed to help you showcase your creativity and bring your sphere to life. Planning and Innovation are essential for any business that is just starting out. This collection contains the designs that you need for your everyday presentations. All of our PowerPoints are 100 percent editable, so you can customize them to suit your needs. This multi-purpose template can be used in various situations. Grab these presentation templates today


 Continue with Email

 Home
Home


