Market Trends

Firm KPI Dashboard With Schedule Performance Index Ppt Visual Aids PDF
This graph or chart is linked to excel, and changes automatically based on data. Just left click on it and select Edit Data. Pitch your topic with ease and precision using this Firm KPI Dashboard With Schedule Performance Index Ppt Visual Aids PDF. This layout presents information on Project Cost Performance, Project Planning Stage, Monitor And Control. It is also available for immediate download and adjustment. So, changes can be made in the color, design, graphics or any other component to create a unique layout.
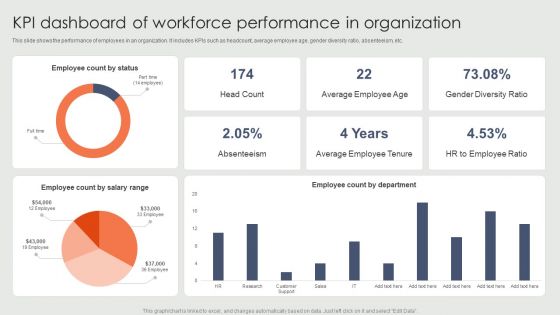
KPI Dashboard Of Workforce Performance In Organization Ppt Gallery Portfolio PDF
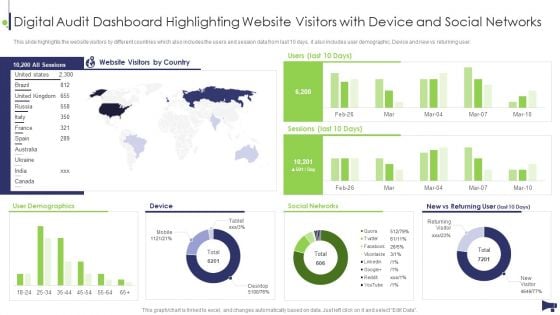
Website And Social Media Digital Audit Dashboard Highlighting Website Visitors With Device Rules PDF
This slide highlights the website visitors by different countries which also includes the users and session data from last 10 days, it also includes user demographic. Device and new vs returning user. Deliver an awe inspiring pitch with this creative Website And Social Media Digital Audit Dashboard Highlighting Website Visitors With Device Rules PDF bundle. Topics like Website Visitors Country, User Demographics, Social Networks can be discussed with this completely editable template. It is available for immediate download depending on the needs and requirements of the user.
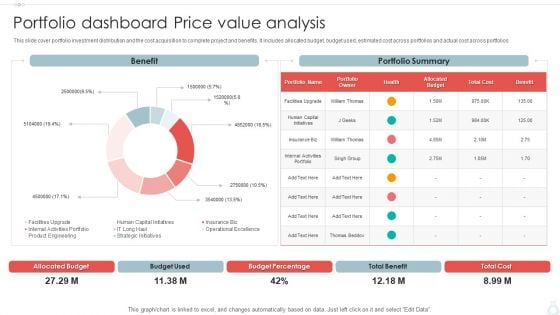
Portfolio Dashboard Price Value Analysis Ppt PowerPoint Presentation Gallery Model PDF
This slide cover portfolio investment distribution and the cost acquisition to complete project and benefits. It includes allocated budget, budget used, estimated cost across portfolios and actual cost across portfolios. Showcasing this set of slides titled Portfolio Dashboard Price Value Analysis Ppt PowerPoint Presentation Gallery Model PDF. The topics addressed in these templates are Portfolio Summary, Budget Percentage, Total Benefit, Total Cost. All the content presented in this PPT design is completely editable. Download it and make adjustments in color, background, font etc. as per your unique business setting.
Effective Company Event Communication Tactics Dashboard For Tracking Active Number Of Attendances Demonstration PDF
This slide covers metrics for analyzing the number of most active event participants. It includes KPIs such as check-in status, contract roles, top industries, contract by country, top 5 job functions, etc. Deliver and pitch your topic in the best possible manner with this Effective Company Event Communication Tactics Dashboard For Tracking Active Number Of Attendances Demonstration PDF. Use them to share invaluable insights on Attendance, Exhibitors, Management and impress your audience. This template can be altered and modified as per your expectations. So, grab it now.
Effective Company Event Communication Tactics Dashboard For Tracking Event Revenue And Registrations Graphics PDF
This slide covers metrics for analyzing the event revenue and registrations. It includes KPIs such as gross revenue, gross revenue from promos, total refund, total registration, visits to purchase conversion, check-in- status, etc. Deliver and pitch your topic in the best possible manner with this Effective Company Event Communication Tactics Dashboard For Tracking Event Revenue And Registrations Graphics PDF. Use them to share invaluable insights on Gross Revenue, Registration Analysis, Purchase Conversion and impress your audience. This template can be altered and modified as per your expectations. So, grab it now.
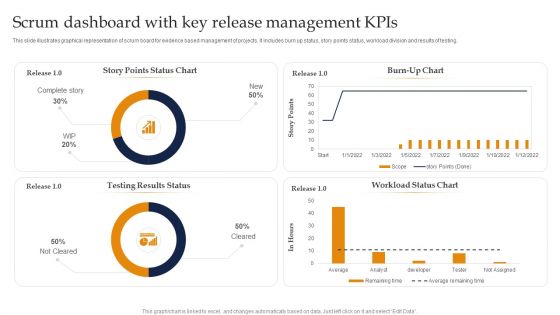
Scrum Dashboard With Key Release Management Kpis Ppt Summary Vector PDF
This slide illustrates graphical representation of scrum board for evidence based management of projects. It includes burn up status, story points status, workload division and results of testing. Showcasing this set of slides titled Scrum Dashboard With Key Release Management Kpis Ppt Summary Vector PDF. The topics addressed in these templates are Burn Up Chart, Workload Status Chart, Testing Results Status. All the content presented in this PPT design is completely editable. Download it and make adjustments in color, background, font etc. as per your unique business setting.
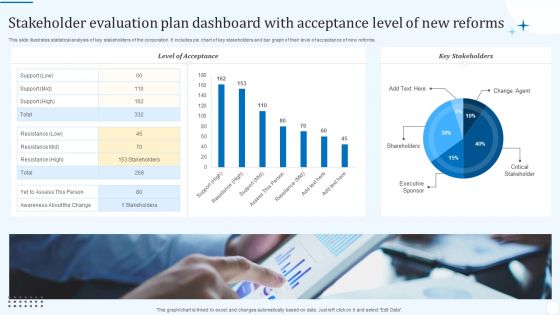
Stakeholder Evaluation Plan Dashboard With Acceptance Level Of New Reforms Background PDF
This slide illustrates statistical analysis of key stakeholders of the corporation. It includes pie chart of key stakeholders and bar graph of their level of acceptance of new reforms. Showcasing this set of slides titled Stakeholder Evaluation Plan Dashboard With Acceptance Level Of New Reforms Background PDF. The topics addressed in these templates are Level Acceptance, Key Stakeholders, Critical Stakeholder. All the content presented in this PPT design is completely editable. Download it and make adjustments in color, background, font etc. as per your unique business setting.
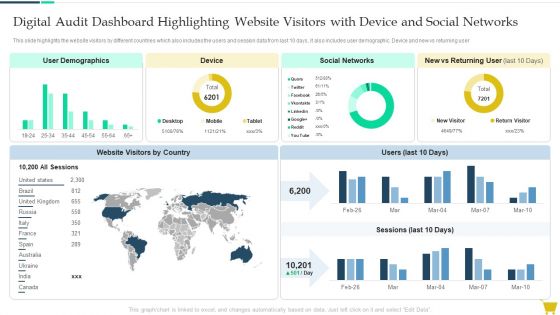
Digital Audit Dashboard Highlighting Website Visitors With Device And Social Networks Guidelines PDF
This slide highlights the website visitors by different countries which also includes the users and session data from last 10 days, it also includes user demographic. Device and new vs returning user. Deliver and pitch your topic in the best possible manner with this Digital Audit Dashboard Highlighting Website Visitors With Device And Social Networks Guidelines PDF. Use them to share invaluable insights on Device, Social Networks, User Demographics and impress your audience. This template can be altered and modified as per your expectations. So, grab it now.
Education Metrics Dashboard For Tracking Student Ethnicity And Specially Abled Characteristics Brochure PDF
This slide covers the education key performance indicator tracker. It include metrics such as total applications, conversion rate, offers year to date, applications by ethnicity and disabilities, etc. Showcasing this set of slides titled Education Metrics Dashboard For Tracking Student Ethnicity And Specially Abled Characteristics Brochure PDF. The topics addressed in these templates are Total Applications, Conversion Rate 2022, Ethnicity. All the content presented in this PPT design is completely editable. Download it and make adjustments in color, background, font etc. as per your unique business setting.
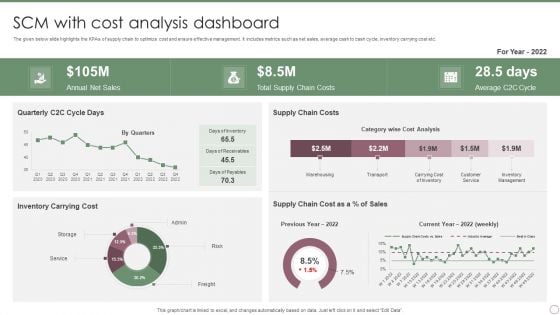
SCM With Cost Analysis Dashboard Ppt PowerPoint Presentation File Slides PDF
The given below slide highlights the KPAs of supply chain to optimize cost and ensure effective management. It includes metrics such as net sales, average cash to cash cycle, inventory carrying cost etc. Showcasing this set of slides titled SCM With Cost Analysis Dashboard Ppt PowerPoint Presentation File Slides PDF. The topics addressed in these templates are Annual Net Sales, Total Supply Chain, Costs, Average C2C Cycle. All the content presented in this PPT design is completely editable. Download it and make adjustments in color, background, font etc. as per your unique business setting.
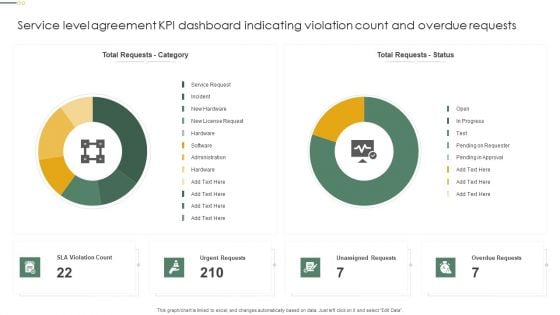
Service Level Agreement KPI Dashboard Indicating Violation Count And Overdue Requests Diagrams PDF
This graph or chart is linked to excel, and changes automatically based on data. Just left click on it and select Edit Data. Showcasing this set of slides titled Service Level Agreement KPI Dashboard Indicating Violation Count And Overdue Requests Diagrams PDF. The topics addressed in these templates are Total Requests Category, Total Requests Status, Urgent Requests. All the content presented in this PPT design is completely editable. Download it and make adjustments in color, background, font etc. as per your unique business setting.
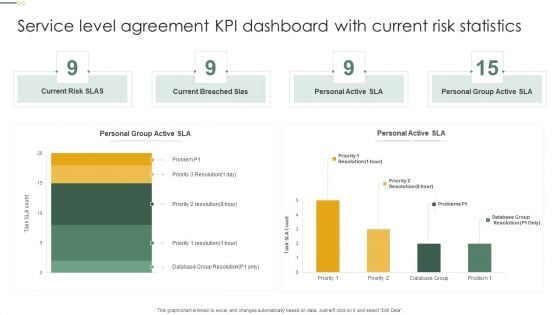
Service Level Agreement KPI Dashboard With Current Risk Statistics Topics PDF
This graph or chart is linked to excel, and changes automatically based on data. Just left click on it and select Edit Data. Pitch your topic with ease and precision using this Service Level Agreement KPI Dashboard With Current Risk Statistics Topics PDF. This layout presents information on Current Risk SLAS, Current Breached Slas, Personal Active SLA It is also available for immediate download and adjustment. So, changes can be made in the color, design, graphics or any other component to create a unique layout.
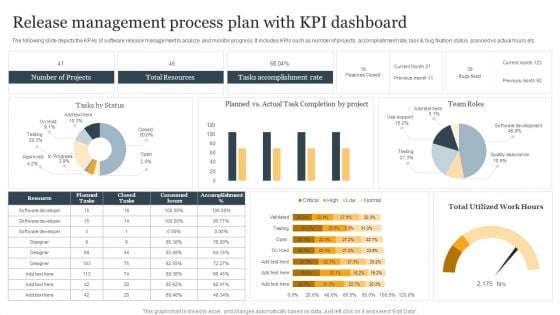
Release Management Process Plan With KPI Dashboard Ppt Infographic Template Structure PDF
The following slide depicts the KPAs of software release management to analyze and monitor progress. It includes KPIs such as number of projects, accomplishment rate, task and bug fixation status, planned vs actual hours etc. Showcasing this set of slides titled Release Management Process Plan With KPI Dashboard Ppt Infographic Template Structure PDF. The topics addressed in these templates are Number Of Projects, Total Resources, Tasks Accomplishment Rate. All the content presented in this PPT design is completely editable. Download it and make adjustments in color, background, font etc. as per your unique business setting.
Consumer Retargeting Techniques Dashboard For Tracking Facebook Retargeting Campaign Ideas PDF
This slide covers metrics for analysing the results of Facebook retargeting campaign. It includes KPIs such as ad spend, cost per click, click-through rate, ad reach, post engagement, ad clicks, ad impressions, link clicks, etc. Deliver an awe inspiring pitch with this creative Consumer Retargeting Techniques Dashboard For Tracking Facebook Retargeting Campaign Ideas PDF bundle. Topics like Cost Thousand, Cost Per, Through Rate can be discussed with this completely editable template. It is available for immediate download depending on the needs and requirements of the user.
Consumer Retargeting Techniques Dashboard For Tracking Instagram Retargeting Campaign Rules PDF
This slide covers metrics for analyzing the results of the Instagram retargeting campaign. It includes KPIs such as amount spend, total reach, total impressions, website clicks, page likes, ad clicks, post reactions, etc.Deliver and pitch your topic in the best possible manner with this Consumer Retargeting Techniques Dashboard For Tracking Instagram Retargeting Campaign Rules PDF. Use them to share invaluable insights on Total Impressions, Post Reactions, Total Amount and impress your audience. This template can be altered and modified as per your expectations. So, grab it now.

Funding Pitch On Key Financial Metrics Dashboard Ppt Ideas Deck PDF
This slide illustrates facts and figures related to important financial metrics It includes cash flow, DSO, ROCE, EPS diluted for Q4 FY21, Q3 FY22 and Q4 FY22 etc. Showcasing this set of slides titled Funding Pitch On Key Financial Metrics Dashboard Ppt Ideas Deck PDF. The topics addressed in these templates are Cash Flow, EPS Diluted, ROCE. All the content presented in this PPT design is completely editable. Download it and make adjustments in color, background, font etc. as per your unique business setting.
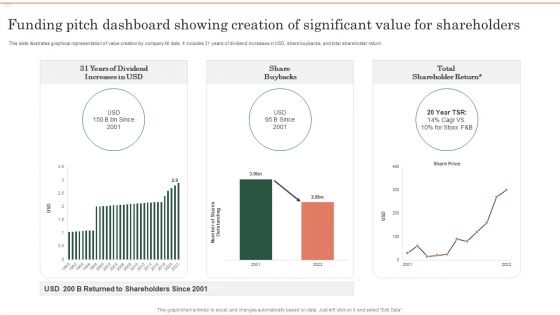
Funding Pitch Dashboard Showing Creation Of Significant Value For Shareholders Themes PDF
This slide illustrates graphical representation of value creation by company till date. It includes 31 years of dividend increases in USD, share buybacks, and total shareholder return. Showcasing this set of slides titled Funding Pitch Dashboard Showing Creation Of Significant Value For Shareholders Themes PDF. The topics addressed in these templates are 31 Years Dividend, Increases USD, Share Buybacks. All the content presented in this PPT design is completely editable. Download it and make adjustments in color, background, font etc. as per your unique business setting.
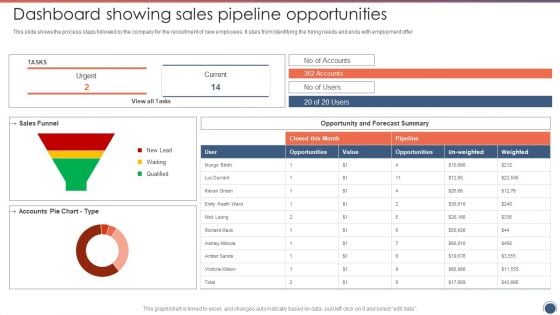
Dashboard Showing Sales Pipeline Opportunities Sales Funnel Management Strategies To Increase Sales Microsoft PDF
This slide shows the process steps followed by the company for the recruitment of new employees. It stars from Identifying the hiring needs and ends with employment offer.Deliver and pitch your topic in the best possible manner with this Dashboard Showing Sales Pipeline Opportunities Sales Funnel Management Strategies To Increase Sales Microsoft PDF. Use them to share invaluable insights on Sales Funnel, Forecast Summary, Opportunities and impress your audience. This template can be altered and modified as per your expectations. So, grab it now.
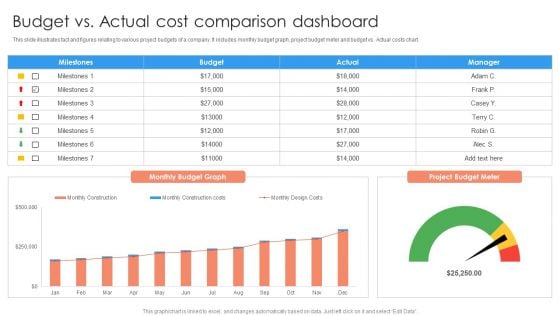
Budget Vs Actual Cost Comparison Dashboard Ppt PowerPoint Presentation Professional Format Ideas PDF
This slide illustrates fact and figures relating to various project budgets of a company. It includes monthly budget graph, project budget meter and budget vs. Actual costs chart.Pitch your topic with ease and precision using this Budget Vs Actual Cost Comparison Dashboard Ppt PowerPoint Presentation Professional Format Ideas PDF. This layout presents information on Milestones, Budget Graph, Manager. It is also available for immediate download and adjustment. So, changes can be made in the color, design, graphics or any other component to create a unique layout.
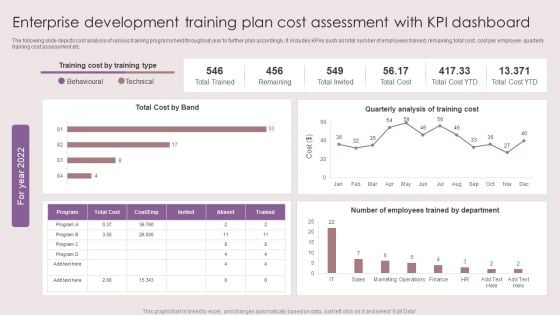
Enterprise Development Training Plan Cost Assessment With KPI Dashboard Mockup PDF
The following slide depicts cost analysis of various training programs held throughout year to further plan accordingly. It includes KPAs such as total number of employees trained, remaining, total cost, cost per employee, quarterly training cost assessment etc. Showcasing this set of slides titled Enterprise Development Training Plan Cost Assessment With KPI Dashboard Mockup PDF. The topics addressed in these templates are Total Cost Band, Quarterly Analysis, Training Cost. All the content presented in this PPT design is completely editable. Download it and make adjustments in color, background, font etc. as per your unique business setting.
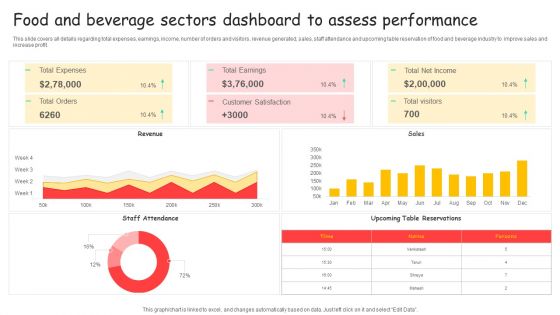
Food And Beverage Sectors Dashboard To Assess Performance Ppt Styles Elements PDF
This slide covers all details regarding total expenses, earnings, income, number of orders and visitors, revenue generated, sales, staff attendance and upcoming table reservation of food and beverage industry to improve sales and increase profit. Showcasing this set of slides titled Food And Beverage Sectors Dashboard To Assess Performance Ppt Styles Elements PDF. The topics addressed in these templates are Total Expenses, Total Earnings, Total Net Income. All the content presented in this PPT design is completely editable. Download it and make adjustments in color, background, font etc. as per your unique business setting.
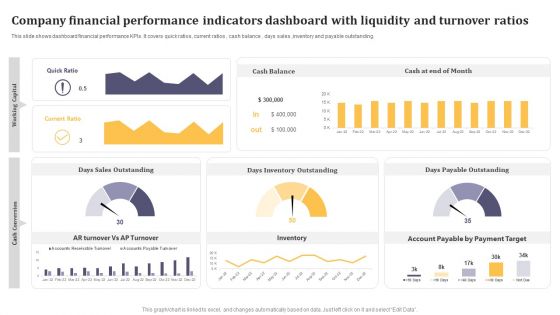
Company Financial Performance Indicators Dashboard With Liquidity And Turnover Ratios Formats PDF
This graph or chart is linked to excel, and changes automatically based on data. Just left click on it and select Edit Data. Pitch your topic with ease and precision using this Company Financial Performance Indicators Dashboard With Liquidity And Turnover Ratios Formats PDF. This layout presents information on Cash Balance, Days Inventory Outstanding, Days Payable Outstanding. It is also available for immediate download and adjustment. So, changes can be made in the color, design, graphics or any other component to create a unique layout.
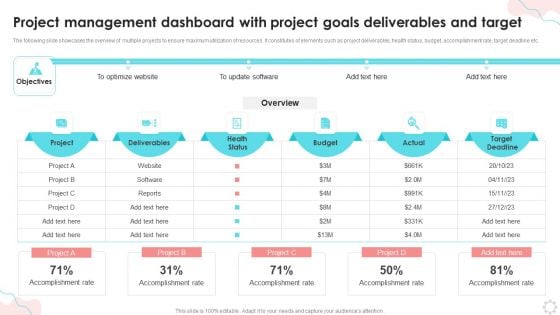
Project Management Dashboard With Project Goals Deliverables And Target Ppt PowerPoint Presentation Summary Demonstration PDF
The following slide showcases the overview of multiple projects to ensure maximum utilization of resources. It constitutes of elements such as project deliverables, health status, budget, accomplishment rate, target deadline etc.Showcasing this set of slides titled Project Management Dashboard With Project Goals Deliverables And Target Ppt PowerPoint Presentation Summary Demonstration PDF. The topics addressed in these templates are Accomplishment Rate, Optimize Website, Deliverables. All the content presented in this PPT design is completely editable. Download it and make adjustments in color, background, font etc. as per your unique business setting.
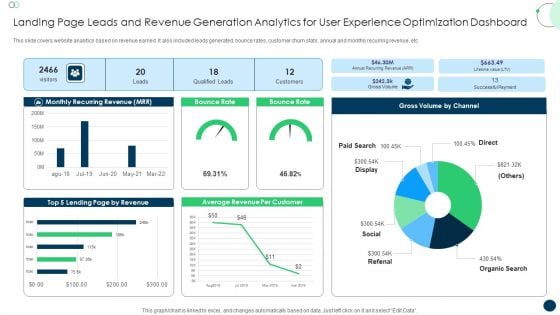
Landing Page Leads And Revenue Generation Analytics For User Experience Optimization Dashboard Formats PDF
This slide covers website analytics based on revenue earned. It also included leads generated, bounce rates, customer churn stats, annual and monthly recurring revenue, etc. Pitch your topic with ease and precision using this Landing Page Leads And Revenue Generation Analytics For User Experience Optimization Dashboard Formats PDF. This layout presents information on Monthly Recurring Revenue, Bounce Rate, Gross Volume. It is also available for immediate download and adjustment. So, changes can be made in the color, design, graphics or any other component to create a unique layout.
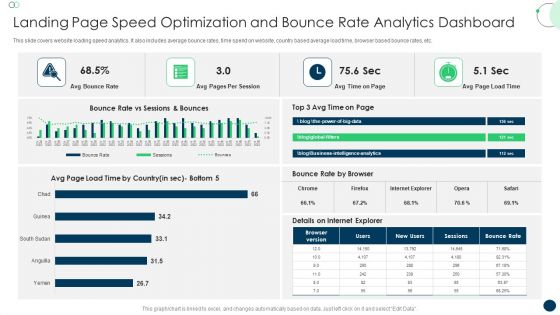
Landing Page Speed Optimization And Bounce Rate Analytics Dashboard Topics PDF
This slide covers website loading speed analytics. It also includes average bounce rates, time spend on website, country based average load time, browser based bounce rates, etc. Pitch your topic with ease and precision using this Landing Page Speed Optimization And Bounce Rate Analytics Dashboard Topics PDF. This layout presents information on Avg Bounce Rate, Avg Pages, Per Session. It is also available for immediate download and adjustment. So, changes can be made in the color, design, graphics or any other component to create a unique layout.
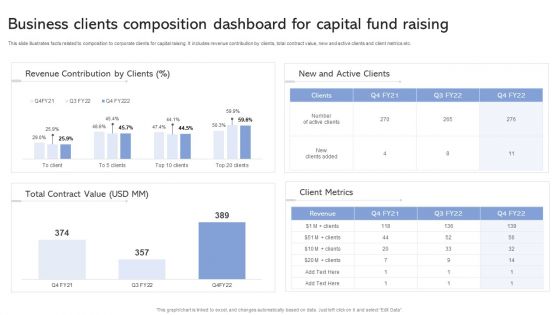
Business Clients Composition Dashboard For Capital Fund Raising Ppt Infographic Template Microsoft PDF
This slide illustrates facts related to composition to corporate clients for capital raising. It includes revenue contribution by clients, total contract value, new and active clients and client metrics etc. Showcasing this set of slides titled Business Clients Composition Dashboard For Capital Fund Raising Ppt Infographic Template Microsoft PDF. The topics addressed in these templates are Revenue Contribution Clients, Client Metrics, Total Contract Value. All the content presented in this PPT design is completely editable. Download it and make adjustments in color, background, font etc. as per your unique business setting.
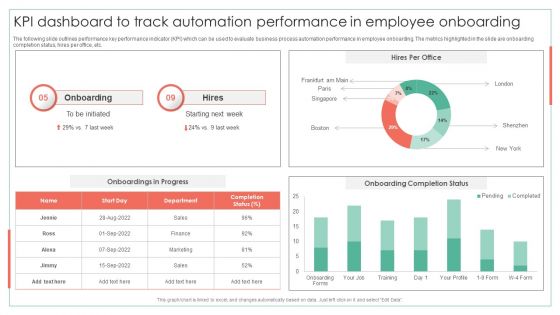
KPI Dashboard To Track Automation Performance In Employee Onboarding Achieving Operational Efficiency Download PDF
The following slide outlines performance key performance indicator KPI which can be used to evaluate business process automation performance in employee onboarding. The metrics highlighted in the slide are onboarding completion status, hires per office, etc.Deliver an awe inspiring pitch with this creative KPI Dashboard To Track Automation Performance In Employee Onboarding Achieving Operational Efficiency Download PDF bundle. Topics like Onboarding Completion, Onboarding, Onboarding Completion can be discussed with this completely editable template. It is available for immediate download depending on the needs and requirements of the user.
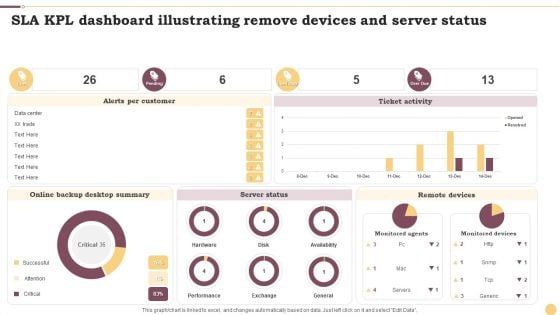
SLA KPL Dashboard Illustrating Remove Devices And Server Status Ppt Inspiration Layout Ideas PDF
This graph or chart is linked to excel, and changes automatically based on data. Just left click on it and select Edit Data. Showcasing this set of slides titled SLA KPL Dashboard Illustrating Remove Devices And Server Status Ppt Inspiration Layout Ideas PDF. The topics addressed in these templates are Alerts Per Customer, Ticket Activity, Server Status. All the content presented in this PPT design is completely editable. Download it and make adjustments in color, background, font etc. as per your unique business setting.
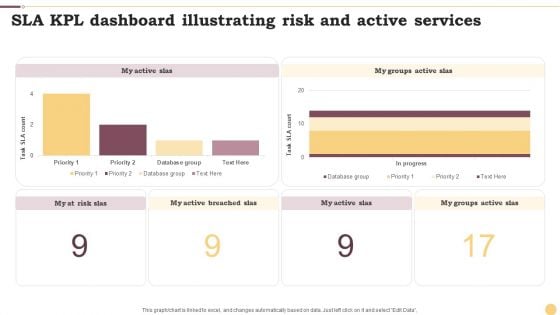
SLA KPL Dashboard Illustrating Risk And Active Services Ppt Portfolio Design Inspiration PDF
This graph or chart is linked to excel, and changes automatically based on data. Just left click on it and select Edit Data. Pitch your topic with ease and precision using this SLA KPL Dashboard Illustrating Risk And Active Services Ppt Portfolio Design Inspiration PDF. This layout presents information on My Active SLAs, Database Group, Priority. It is also available for immediate download and adjustment. So, changes can be made in the color, design, graphics or any other component to create a unique layout.
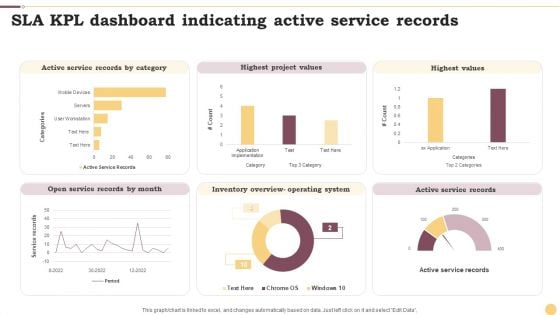
SLA KPL Dashboard Indicating Active Service Records Ppt Professional Graphics Example PDF
This graph or chart is linked to excel, and changes automatically based on data. Just left click on it and select Edit Data. Pitch your topic with ease and precision using this SLA KPL Dashboard Indicating Active Service Records Ppt Professional Graphics Example PDF. This layout presents information on Active Service Records, Highest Project Values, Highest Values. It is also available for immediate download and adjustment. So, changes can be made in the color, design, graphics or any other component to create a unique layout.
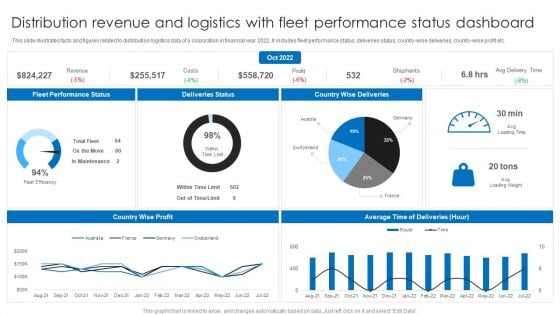
Distribution Revenue And Logistics With Fleet Performance Status Dashboard Ppt Layouts Background PDF
This slide illustrates facts and figures related to distribution logistics data of a corporation in financial year 2022. It includes fleet performance status, deliveries status, country-wise deliveries, country-wise profit etc. Pitch your topic with ease and precision using this Distribution Revenue And Logistics With Fleet Performance Status Dashboard Ppt Layouts Background PDF. This layout presents information on Deliveries Status, Country Wise Deliveries, Fleet Performance Status. It is also available for immediate download and adjustment. So, changes can be made in the color, design, graphics or any other component to create a unique layout.
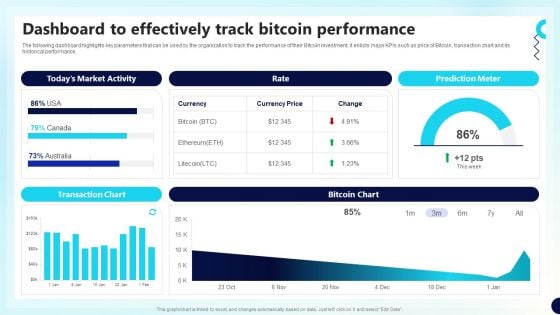
Dashboard To Effectively Track Bitcoin Decentralized Fund Investment Playbook Designs PDF
This Dashboard To Effectively Track Bitcoin Decentralized Fund Investment Playbook Designs PDF from Slidegeeks makes it easy to present information on your topic with precision. It provides customization options, so you can make changes to the colors, design, graphics, or any other component to create a unique layout. It is also available for immediate download, so you can begin using it right away. Slidegeeks has done good research to ensure that you have everything you need to make your presentation stand out. Make a name out there for a brilliant performance.
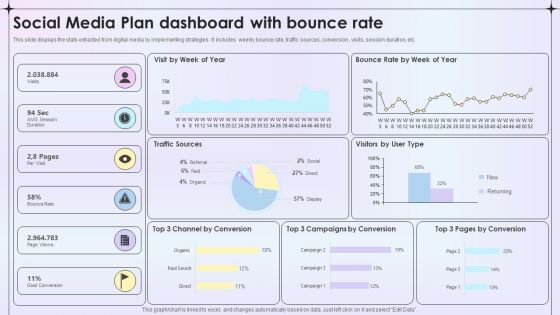
Social Media Plan Dashboard With Bounce Rate Ppt Ideas Graphics Template PDF
This slide displays the stats extracted from digital media by implementing strategies . It includes weekly bounce rate, traffic sources, conversion , visits, session duration, etc. Pitch your topic with ease and precision using this Social Media Plan Dashboard With Bounce Rate Ppt Ideas Graphics Template PDF. This layout presents information on Traffic Sources, Visitors User Type, Goal Conversion. It is also available for immediate download and adjustment. So, changes can be made in the color, design, graphics or any other component to create a unique layout.
Company Event Communication Dashboard For Tracking Event Gross Revenue Themes PDF
This slide covers metrics for analyzing gross revenue generated throughout the event. It includes a graphical and tabular representation of revenue generated via promo codes and tracking links. Want to ace your presentation in front of a live audience Our Company Event Communication Dashboard For Tracking Event Gross Revenue Themes PDF can help you do that by engaging all the users towards you.. Slidegeeks experts have put their efforts and expertise into creating these impeccable powerpoint presentations so that you can communicate your ideas clearly. Moreover, all the templates are customizable, and easy-to-edit and downloadable. Use these for both personal and commercial use.
Company Event Communication Dashboard For Tracking Event Revenue And Registrations Ideas PDF
This slide covers metrics for analyzing the event revenue and registrations. It includes KPIs such as gross revenue, gross revenue from promos, total refund, total registration, visits to purchase conversion, check-in- status, etc. There are so many reasons you need a Company Event Communication Dashboard For Tracking Event Revenue And Registrations Ideas PDF. The first reason is you can not spend time making everything from scratch, Thus, Slidegeeks has made presentation templates for you too. You can easily download these templates from our website easily.
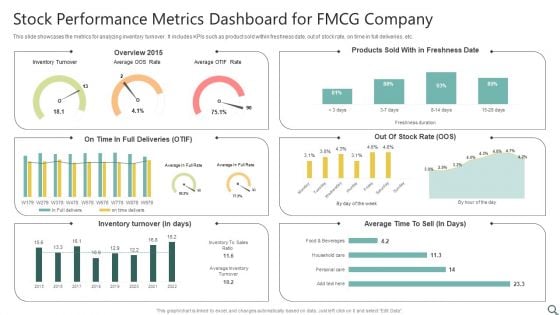
Stock Performance Metrics Dashboard For FMCG Company Ppt Ideas Design Inspiration PDF
This slide showcases the metrics for analyzing inventory turnover. It includes KPIs such as product sold within freshness date, out of stock rate, on time in full deliveries, etc. Showcasing this set of slides titled Stock Performance Metrics Dashboard For FMCG Company Ppt Ideas Design Inspiration PDF. The topics addressed in these templates are Inventory Turnover, Overview 2015, Inventory Turnover. All the content presented in this PPT design is completely editable. Download it and make adjustments in color, background, font etc. as per your unique business setting.
Performance Tracking Dashboard For SDLC Phases Of Software Development Procedure Demonstration PDF
This slide represents the requirement gathering and analysis phase of the software development life cycle, including the steps taken in this stage, such as collecting needed information about the product to be made.This Performance Tracking Dashboard For SDLC Phases Of Software Development Procedure Demonstration PDF is perfect for any presentation, be it in front of clients or colleagues. It is a versatile and stylish solution for organizing your meetings. The product features a modern design for your presentation meetings. The adjustable and customizable slides provide unlimited possibilities for acing up your presentation. Slidegeeks has done all the homework before launching the product for you. So, do not wait, grab the presentation templates today.
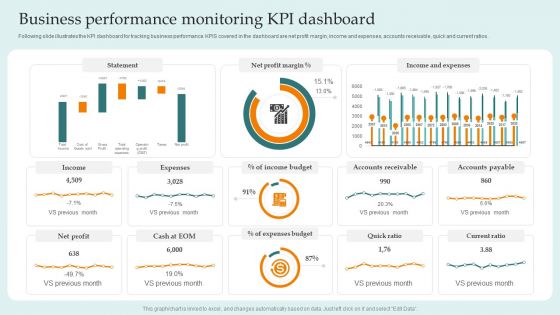
Business Performance Monitoring Kpi Dashboard Guide For Successful Merger And Acquisition Mockup PDF
Coming up with a presentation necessitates that the majority of the effort goes into the content and the message you intend to convey. The visuals of a PowerPoint presentation can only be effective if it supplements and supports the story that is being told. Keeping this in mind our experts created Business Performance Monitoring Kpi Dashboard Guide For Successful Merger And Acquisition Mockup PDF to reduce the time that goes into designing the presentation. This way, you can concentrate on the message while our designers take care of providing you with the right template for the situation.
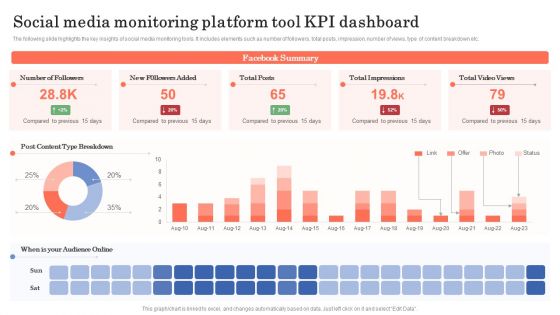
Social Media Monitoring Platform Tool KPI Dashboard Ppt Gallery Show PDF
The following slide highlights the key insights of social media monitoring tools. It includes elements such as number of followers, total posts, impression, number of views, type of content breakdown etc. Showcasing this set of slides titled Social Media Monitoring Platform Tool KPI Dashboard Ppt Gallery Show PDF. The topics addressed in these templates are Number Followers, New Followers Added, Total Impressions. All the content presented in this PPT design is completely editable. Download it and make adjustments in color, background, font etc. as per your unique business setting.
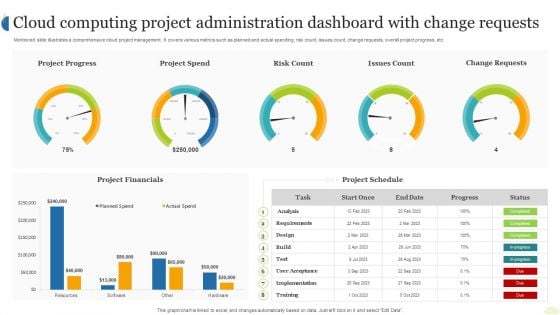
Cloud Computing Project Administration Dashboard With Change Requests Ppt Layouts Background Images PDF
Mentioned slide illustrates a comprehensive cloud project management. It covers various metrics such as planned and actual spending, risk count, issues count, change requests, overall project progress, etc. Showcasing this set of slides titled Cloud Computing Project Administration Dashboard With Change Requests Ppt Layouts Background Images PDF. The topics addressed in these templates are Project Financials, Project Spend, Project Progress. All the content presented in this PPT design is completely editable. Download it and make adjustments in color, background, font etc. as per your unique business setting.
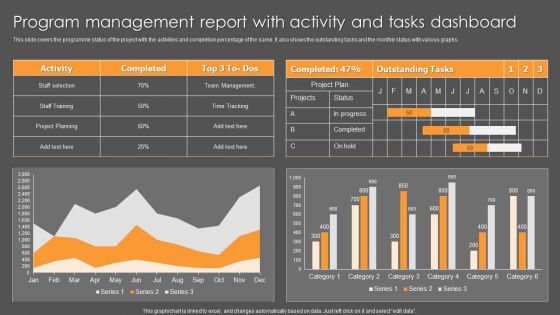
Program Management Report With Activity And Tasks Dashboard Ppt File Objects PDF
This slide covers the programme status of the project with the activities and completion percentage of the same. It also shows the outstanding tasks and the monthly status with various graphs. Pitch your topic with ease and precision using this Program Management Report With Activity And Tasks Dashboard Ppt File Objects PDF. This layout presents information on Activity, Team Management, Time Tracking. It is also available for immediate download and adjustment. So, changes can be made in the color, design, graphics or any other component to create a unique layout.
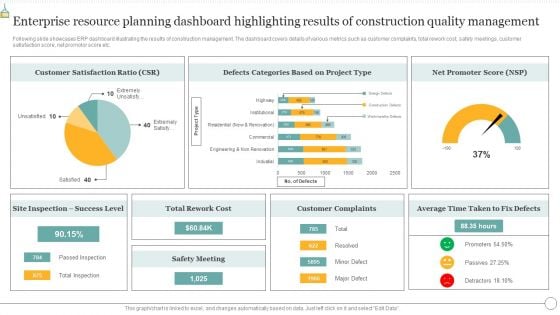
Enterprise Resource Planning Dashboard Highlighting Results Of Construction Quality Management Summary PDF
Following slide exhibits various functionalities that constructing company look for in ERP software. The multiple functionalities covered in the slide are project tracking, job costing, project estimating, improved accuracy, process automation etc. Pitch your topic with ease and precision using this Enterprise Resource Planning Dashboard Highlighting Results Of Construction Quality Management Summary PDF. This layout presents information on Technology Efficiency, Process Automation, Improved Accuracy. It is also available for immediate download and adjustment. So, changes can be made in the color, design, graphics or any other component to create a unique layout.
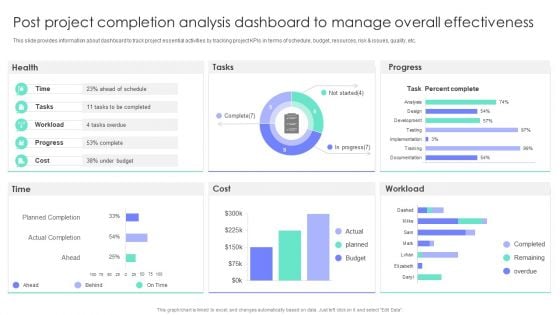
Post Project Completion Analysis Dashboard To Manage Overall Effectiveness Project Administration Portrait PDF
Coming up with a presentation necessitates that the majority of the effort goes into the content and the message you intend to convey. The visuals of a PowerPoint presentation can only be effective if it supplements and supports the story that is being told. Keeping this in mind our experts created Post Project Completion Analysis Dashboard To Manage Overall Effectiveness Project Administration Portrait PDF to reduce the time that goes into designing the presentation. This way, you can concentrate on the message while our designers take care of providing you with the right template for the situation.
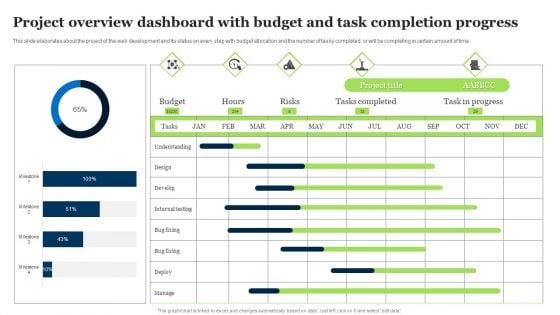
Project Overview Dashboard With Budget And Task Completion Progress Slides PDF
This slide elaborates about the project of the web development and its status on every step with budget allocation and the number of tasks completed or will be completing in certain amount of time. Showcasing this set of slides titled Project Overview Dashboard With Budget And Task Completion Progress Slides PDF. The topics addressed in these templates are Project Title, Budget, Risks. All the content presented in this PPT design is completely editable. Download it and make adjustments in color, background, font etc. as per your unique business setting.
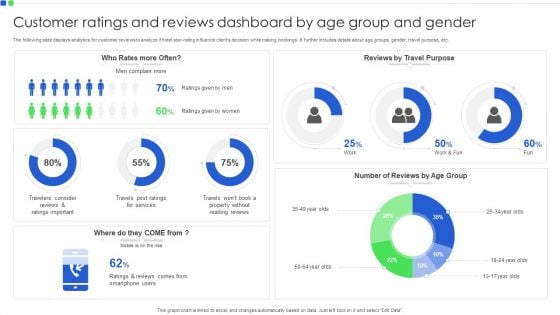
Customer Ratings And Reviews Dashboard By Age Group And Gender Introduction PDF
The following slide displays analytics for customer reviews to analyze if hotel star rating influence clients decision while making bookings. It further includes details about age groups, gender, travel purpose, etc. Pitch your topic with ease and precision using this Customer Ratings And Reviews Dashboard By Age Group And Gender Introduction PDF. This layout presents information on Customer Ratings And Reviews, Age Group And Gender. It is also available for immediate download and adjustment. So, changes can be made in the color, design, graphics or any other component to create a unique layout.
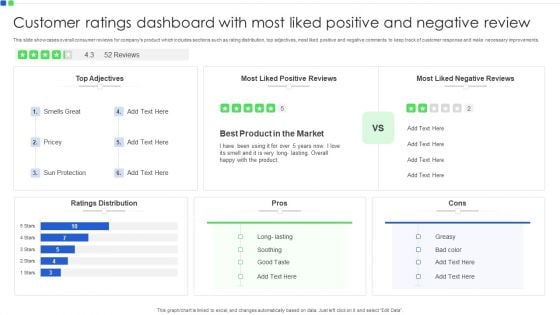
Customer Ratings Dashboard With Most Liked Positive And Negative Review Formats PDF
This slide showcases overall consumer reviews for companys product which includes sections such as rating distribution, top adjectives, most liked positive and negative comments to keep track of customer response and make necessary improvements. Showcasing this set of slides titled Customer Ratings Dashboard With Most Liked Positive And Negative Review Formats PDF. The topics addressed in these templates are Smells Great, Sun Protection, Soothing. All the content presented in this PPT design is completely editable. Download it and make adjustments in color, background, font etc. as per your unique business setting.
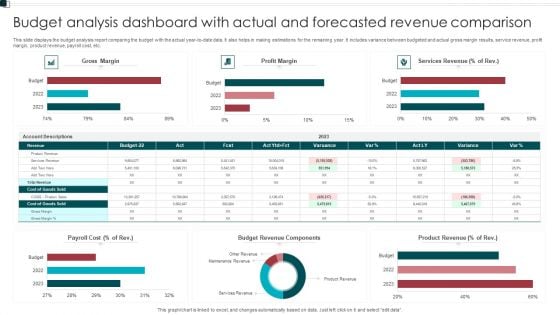
Budget Analysis Dashboard With Actual And Forecasted Revenue Comparison Structure PDF
This slide displays the budget analysis report comparing the budget with the actual year to date data. It also helps in making estimations for the remaining year. It includes variance between budgeted and actual gross margin results, service revenue, profit margin, product revenue, payroll cost, etc. Pitch your topic with ease and precision using this Budget Analysis Dashboard With Actual And Forecasted Revenue Comparison Structure PDF. This layout presents information on Payroll Cost, Budget Revenue Components, Product Revenue. It is also available for immediate download and adjustment. So, changes can be made in the color, design, graphics or any other component to create a unique layout.
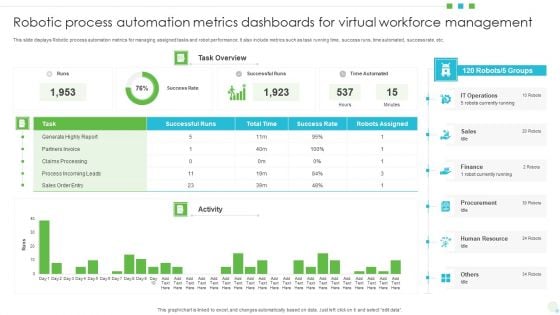
Robotic Process Automation Metrics Dashboards For Virtual Workforce Management Background PDF
This slide displays Robotic process automation metrics for managing assigned tasks and robot performance. It also include metrics such as task running time, success runs, time automated, success rate, etc. Showcasing this set of slides titled Robotic Process Automation Metrics Dashboards For Virtual Workforce Management Background PDF. The topics addressed in these templates are Finance, Sales, Human Resource. All the content presented in this PPT design is completely editable. Download it and make adjustments in color, background, font etc. as per your unique business setting.
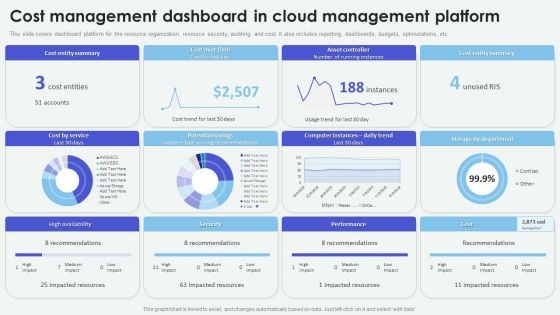
Cloud Based Computing Analysis Cost Management Dashboard In Cloud Management Formats PDF
Slidegeeks is here to make your presentations a breeze with Cloud Based Computing Analysis Cost Management Dashboard In Cloud Management Formats PDF With our easy-to-use and customizable templates, you can focus on delivering your ideas rather than worrying about formatting. With a variety of designs to choose from, youre sure to find one that suits your needs. And with animations and unique photos, illustrations, and fonts, you can make your presentation pop. So whether youre giving a sales pitch or presenting to the board, make sure to check out Slidegeeks first
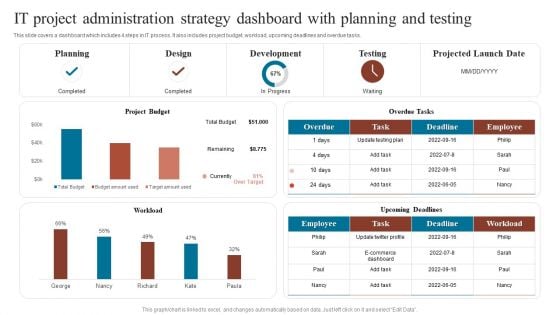
It Project Administration Strategy Dashboard With Planning And Testing Download PDF
This slide helps in enclosing the detailed plan of allocated resources of individual project by the project managers. It also illustrates task and interdependencies with respect of their roles. Showcasing this set of slides titled It Project Administration Strategy Dashboard With Planning And Testing Download PDF. The topics addressed in these templates are Overdue Tasks, Development, Projected Launch. All the content presented in this PPT design is completely editable. Download it and make adjustments in color, background, font etc. as per your unique business setting.
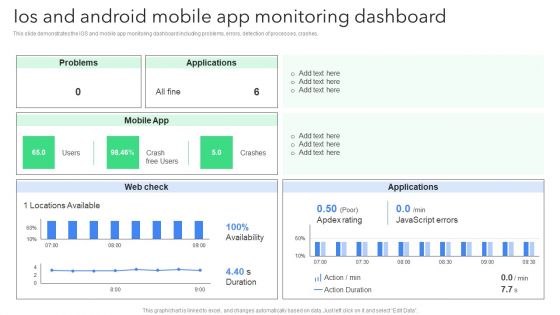
Creating Mobile Application For Android Ios And Android Mobile App Monitoring Dashboard Clipart PDF
Are you in need of a template that can accommodate all of your creative concepts. This one is crafted professionally and can be altered to fit any style. Use it with Google Slides or PowerPoint. Include striking photographs, symbols, depictions, and other visuals. Fill, move around, or remove text boxes as desired. Test out color palettes and font mixtures. Edit and save your work, or work with colleagues. Download Creating Mobile Application For Android Ios And Android Mobile App Monitoring Dashboard Clipart PDF and observe how to make your presentation outstanding. Give an impeccable presentation to your group and make your presentation unforgettable.
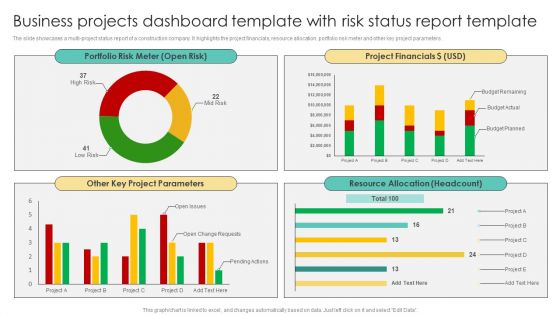
Business Projects Dashboard Template With Risk Status Report Template Topics PDF
The slide showcases a multi-project status report of a construction company. It highlights the project financials, resource allocation, portfolio risk meter and other key project parameters. Pitch your topic with ease and precision using this Business Projects Dashboard Template With Risk Status Report Template Topics PDF. This layout presents information on Portfolio Risk Meter, Project Financials, Project Parameters, Resource Allocation. It is also available for immediate download and adjustment. So, changes can be made in the color, design, graphics or any other component to create a unique layout.
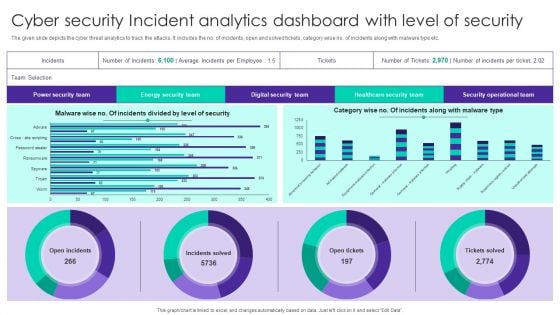
Cyber Security Incident Analytics Dashboard With Level Of Security Ppt Ideas Graphics Tutorials PDF
The given slide depicts the cyber threat analytics to track the attacks. It includes the no. of incidents, open and solved tickets, category wise no. of incidents along with malware type etc. Pitch your topic with ease and precision using this Cyber Security Incident Analytics Dashboard With Level Of Security Ppt Ideas Graphics Tutorials PDF. This layout presents information on Power Security Team, Open Incidents, Incidents Solved, Open Tickets. It is also available for immediate download and adjustment. So, changes can be made in the color, design, graphics or any other component to create a unique layout.
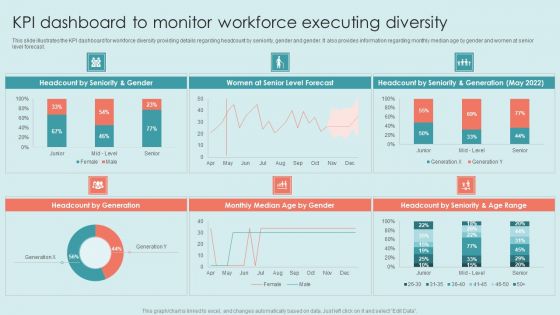
Executing Diversity KPI Dashboard To Monitor Workforce Executing Diversity Background PDF
This slide covers information regarding the key traits of inclusive leadership such as commitment, courage, cognize bias, curiosity etc. It also provides details about thinking to develop and behavior to adopt for becoming an effective inclusive leader. If your project calls for a presentation, then Slidegeeks is your go-to partner because we have professionally designed, easy-to-edit templates that are perfect for any presentation. After downloading, you can easily edit Executing Diversity KPI Dashboard To Monitor Workforce Executing Diversity Background PDF and make the changes accordingly. You can rearrange slides or fill them with different images. Check out all the handy templates.

Omnichannel Banking Services Platform Dashboard To Track Customers Account Statements Pictures PDF
This slide covers overview of customers account based on different bank products used by customers. It includes elements such as statements for cash and loan accounts, credit cards, expense and budget analysis, bill payments, etc. Want to ace your presentation in front of a live audience Our Omnichannel Banking Services Platform Dashboard To Track Customers Account Statements Pictures PDF can help you do that by engaging all the users towards you. Slidegeeks experts have put their efforts and expertise into creating these impeccable powerpoint presentations so that you can communicate your ideas clearly. Moreover, all the templates are customizable, and easy to edit and downloadable. Use these for both personal and commercial use.
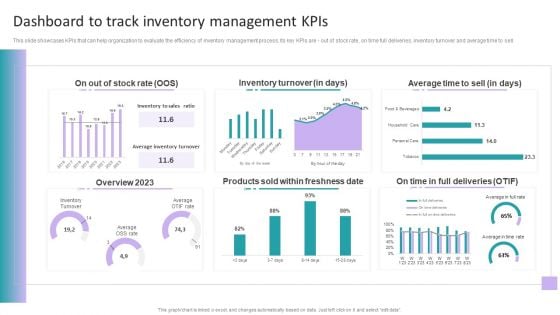
Stock Inventory Acquisition Dashboard To Track Inventory Management Kpis Themes PDF
This slide showcases KPIs that can help organization to evaluate the efficiency of inventory management process. Its key KPIs are - out of stock rate, on time full deliveries, inventory turnover and average time to sell. The best PPT templates are a great way to save time, energy, and resources. Slidegeeks have 100 percent editable powerpoint slides making them incredibly versatile. With these quality presentation templates, you can create a captivating and memorable presentation by combining visually appealing slides and effectively communicating your message. Download Stock Inventory Acquisition Dashboard To Track Inventory Management Kpis Themes PDF from Slidegeeks and deliver a wonderful presentation.
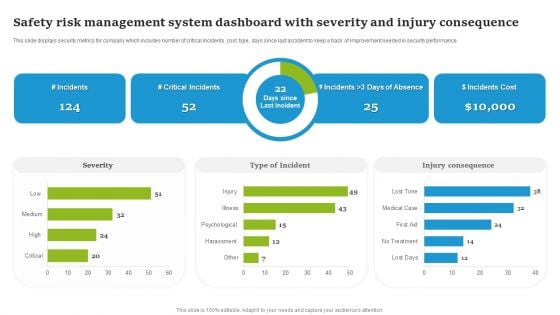
Safety Risk Management System Dashboard With Severity And Injury Consequence Clipart PDF
This slide displays security metrics for company which includes number of critical incidents, cost, type, days since last accident to keep a track of Improvement needed in security performance. Pitch your topic with ease and precision using this Safety Risk Management System Dashboard With Severity And Injury Consequence Clipart PDF. This layout presents information on Severity, Type Of Incident, Injury Consequence . It is also available for immediate download and adjustment. So, changes can be made in the color, design, graphics or any other component to create a unique layout.
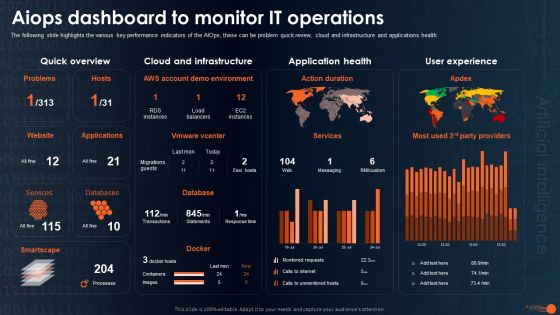
Integrating Aiops To Enhance Process Effectiveness Aiops Dashboard To Monitor Download PDF
The following slide highlights the various key performance indicators of the AIOps, these can be problem quick review, cloud and infrastructure and applications health Boost your pitch with our creative Integrating Aiops To Enhance Process Effectiveness Aiops Dashboard To Monitor Download PDF. Deliver an awe-inspiring pitch that will mesmerize everyone. Using these presentation templates you will surely catch everyones attention. You can browse the ppts collection on our website. We have researchers who are experts at creating the right content for the templates. So you dont have to invest time in any additional work. Just grab the template now and use them.
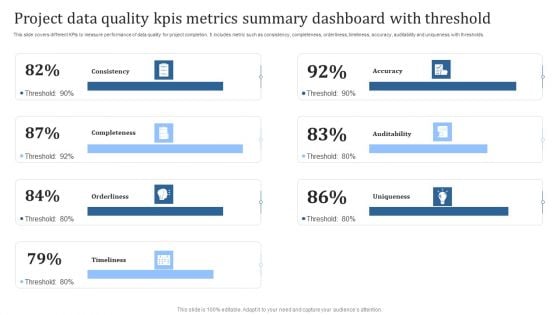
Project Data Quality Kpis Metrics Summary Dashboard With Threshold Guidelines PDF
This slide covers different KPIs to measure performance of data quality for project completion. It includes metric such as consistency, completeness, orderliness, timeliness, accuracy, auditability and uniqueness with thresholds. Pitch your topic with ease and precision using this Project Data Quality Kpis Metrics Summary Dashboard With Threshold Guidelines PDF. This layout presents information on Consistency, Completeness, Orderliness. It is also available for immediate download and adjustment. So, changes can be made in the color, design, graphics or any other component to create a unique layout.


 Continue with Email

 Home
Home


