Marketing Calendar
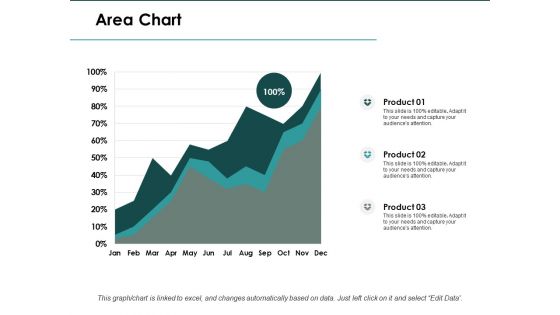
Area Chart Finance Ppt PowerPoint Presentation Infographics Slide
This is a area chart finance ppt powerpoint presentation infographics slide. This is a three stage process. The stages in this process are area chart, finance, marketing, analysis, investment.
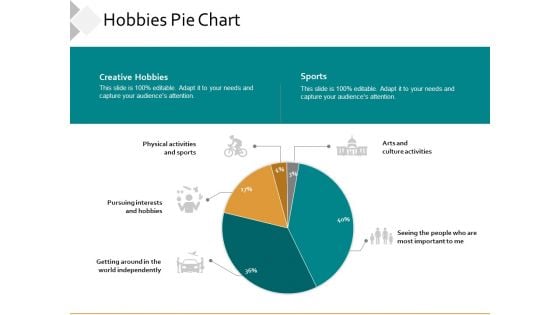
Hobbies Pie Chart Ppt PowerPoint Presentation Show Smartart
This is a hobbies pie chart ppt powerpoint presentation show smartart. This is a five stage process. The stages in this process are financial, business, marketing, management, pie chart.

Area Chart Percentage Ppt PowerPoint Presentation Portfolio Pictures
This is a area chart percentage ppt powerpoint presentation portfolio pictures. This is a three stage process. The stages in this process are area chart, finance, marketing, management, investment.
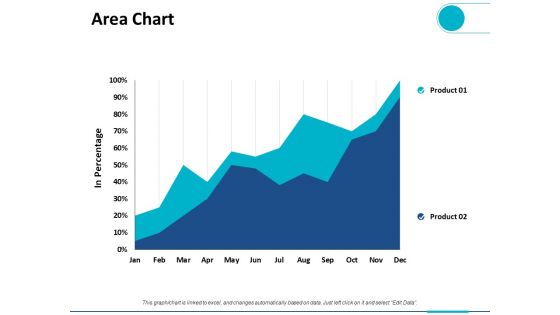
Area Chart Finance Ppt PowerPoint Presentation Pictures Clipart
This is a area chart finance ppt powerpoint presentation pictures clipart. This is a two stage process. The stages in this process are area chart, finance, marketing, analysis, investment.
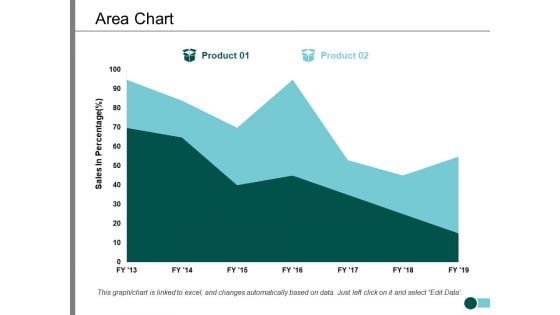
Area Chart Percentage Product Ppt PowerPoint Presentation Infographic Template Slide
This is a area chart percentage product ppt powerpoint presentation infographic template slide. This is a two stage process. The stages in this process are area chart, finance, marketing, management, investment.
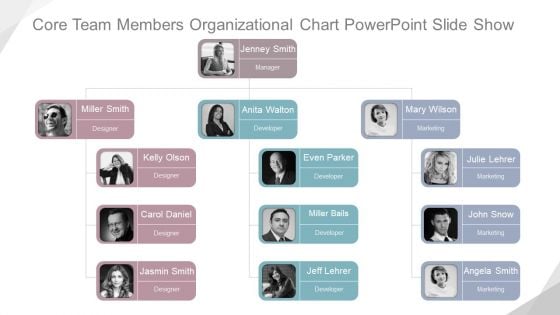
Core Team Members Organizational Chart Ppt PowerPoint Presentation Background Designs
This is a core team members organizational chart ppt powerpoint presentation background designs. This is a five stage process. The stages in this process are manager, designer, developer, marketing.
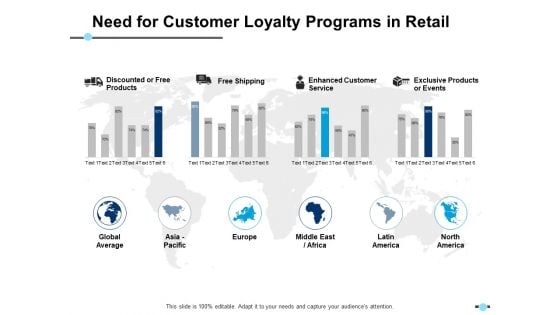
Need For Customer Loyalty Programs In Retail Enhanced Customer Service Ppt PowerPoint Presentation Outline Graphics Pictures
This is a need for customer loyalty programs in retail enhanced customer service ppt powerpoint presentation outline graphics pictures. This is a four stage process. The stages in this process are finance, strategy, analysis, marketing.
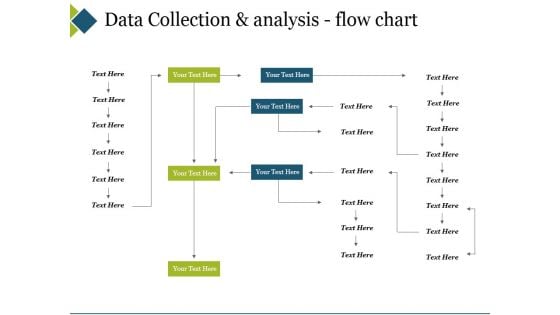
Data Collection And Analysis Flow Chart Ppt PowerPoint Presentation Model Rules
This is a data collection and analysis flow chart ppt powerpoint presentation model rules. This is a six stage process. The stages in this process are business, marketing, management, planning, chart.
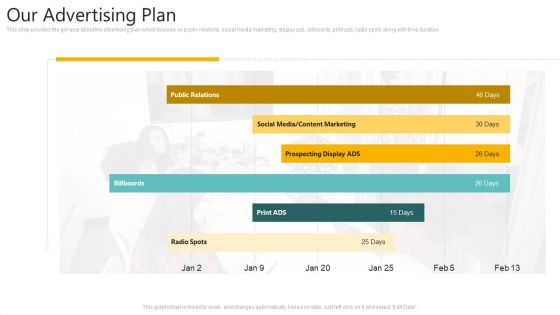
Agency Pitch Deck PPT Our Advertising Plan Ppt Layouts Background Designs PDF
This slide provides the glimpse about the advertising plan which focuses on public relations, social media marketing, display ads, billboards, print ads, radio spots along with time duration. Deliver an awe inspiring pitch with this creative agency pitch deck ppt our advertising plan ppt layouts background designs pdf bundle. Topics like content marketing, social media can be discussed with this completely editable template. It is available for immediate download depending on the needs and requirements of the user.
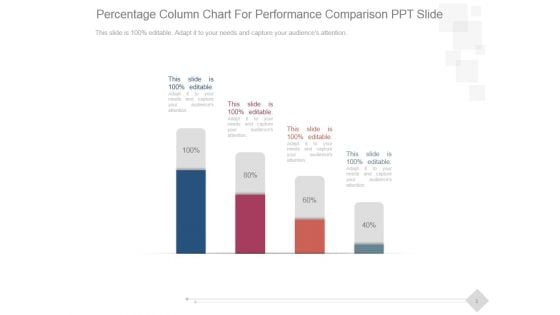
Percentage Column Chart For Performance Comparison Ppt PowerPoint Presentation Good
This is a percentage column chart for performance comparison ppt powerpoint presentation good. This is a four stage process. The stages in this process are business, marketing, technology, presentation, management.
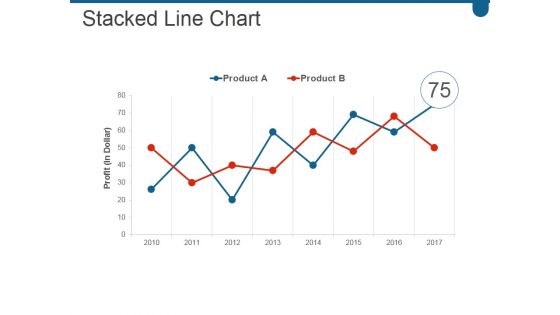
Stacked Line Chart Ppt PowerPoint Presentation Infographic Template Show
This is a stacked line chart ppt powerpoint presentation infographic template show. This is a two stage process. The stages in this process are business, marketing, growth, success, line.
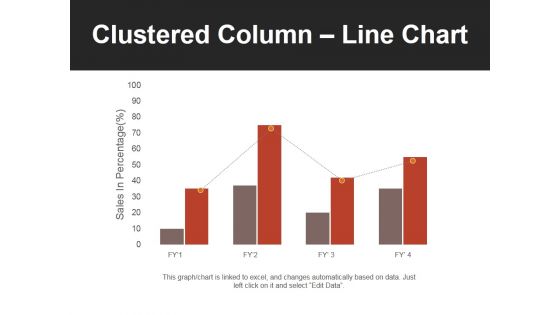
Clustered Column Line Chart Ppt PowerPoint Presentation Professional Slides
This is a clustered column line chart ppt powerpoint presentation professional slides. This is a four stage process. The stages in this process are bar, finance, business, marketing, growth.
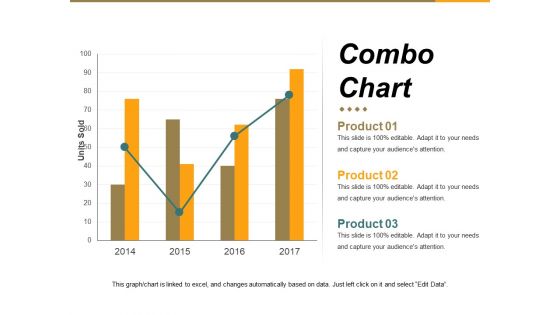
Combo Chart Ppt PowerPoint Presentation Infographics Example Introduction
This is a combo chart ppt powerpoint presentation infographics example introduction. This is a four stage process. The stages in this process are units sold, business, marketing, graph, growth.
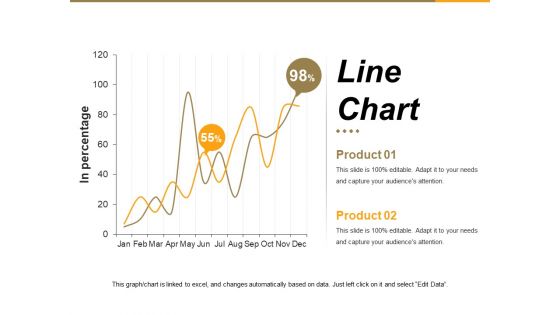
Line Chart Ppt PowerPoint Presentation Summary File Formats
This is a line chart ppt powerpoint presentation summary file formats. This is a two stage process. The stages in this process are in percentage, graph, business, marketing, growth.
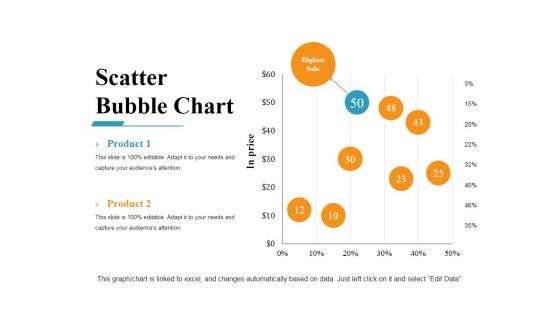
Scatter Bubble Chart Ppt PowerPoint Presentation Gallery Example Introduction
This is a scatter bubble chart ppt powerpoint presentation gallery example introduction. This is a eight stage process. The stages in this process are business, marketing, finance, bubble, scatter.
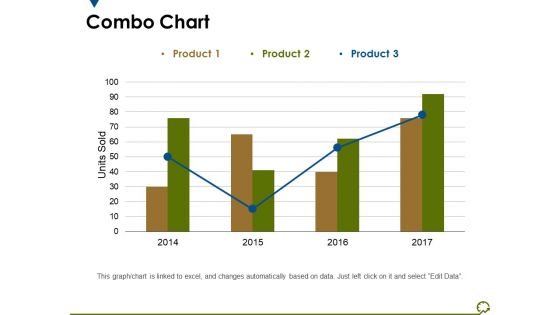
Combo Chart Ppt PowerPoint Presentation Outline Graphics Tutorials
This is a combo chart ppt powerpoint presentation outline graphics tutorials. This is a three stage process. The stages in this process are units sold, years, business, marketing, graph.

Line Chart Ppt PowerPoint Presentation Infographics Graphic Images
This is a line chart ppt powerpoint presentation infographics graphic images. This is a two stage process. The stages in this process are sales in percentage, financial years, growth, business, marketing.
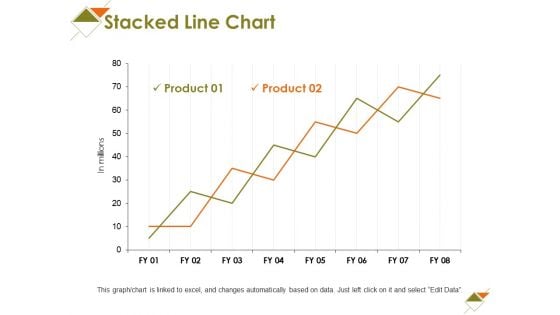
Stacked Line Chart Ppt PowerPoint Presentation File Display
This is a stacked line chart ppt powerpoint presentation file display. This is a two stage process. The stages in this process are business, marketing, graph, strategy, in millions.
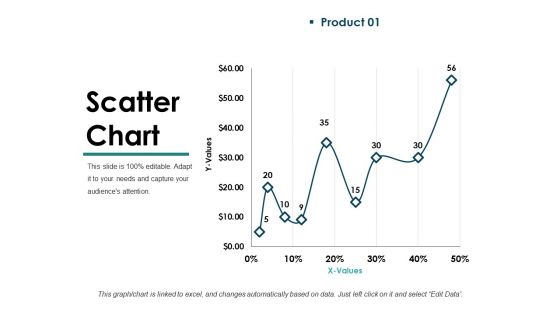
Scatter Chart Template 1 Ppt PowerPoint Presentation Inspiration Guidelines
This is a scatter chart template 1 ppt powerpoint presentation inspiration guidelines. This is a one stage process. The stages in this process are business, marketing, graph, values, growth.
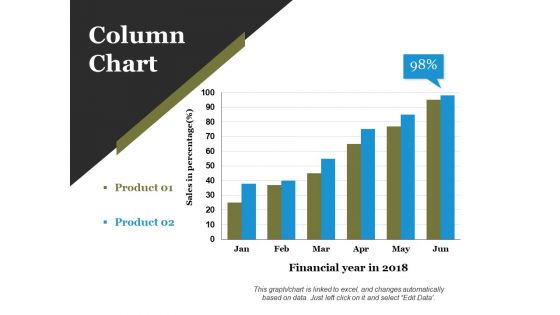
Column Chart Ppt PowerPoint Presentation Infographics Layout Ideas
This is a column chart ppt powerpoint presentation infographics layout ideas. This is a two stage process. The stages in this process are financial year in, business, marketing, growth, graph.
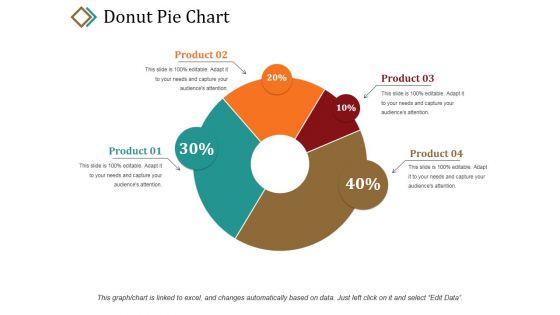
Donut Pie Chart Ppt PowerPoint Presentation Portfolio Graphic Tips
This is a donut pie chart ppt powerpoint presentation portfolio graphic tips. This is a four stage process. The stages in this process are product, percentage, business, marketing, donut.
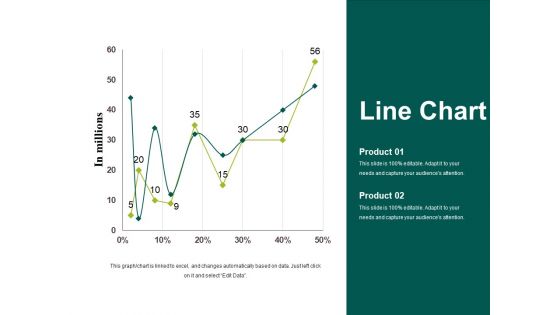
Line Chart Template 1 Ppt PowerPoint Presentation Styles Graphics Tutorials
This is a line chart template 1 ppt powerpoint presentation styles graphics tutorials. This is a two stage process. The stages in this process are in millions, business, marketing, strategy, graph.
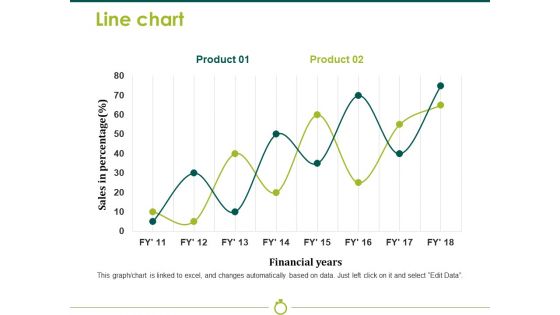
Line Chart Template 2 Ppt PowerPoint Presentation Model Background Image
This is a line chart template 2 ppt powerpoint presentation model background image. This is a two stage process. The stages in this process are sales in percentage, financial years, business, marketing, strategy, graph.
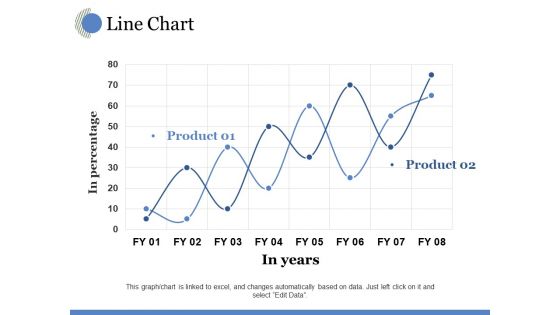
Line Chart Ppt PowerPoint Presentation Model Visual Aids
This is a line chart ppt powerpoint presentation model visual aids. This is a two stage process. The stages in this process are in years, in percentage, growth, business, marketing.

Line Chart Ppt PowerPoint Presentation Gallery Example Topics
This is a line chart ppt powerpoint presentation gallery example topics. This is a two stage process. The stages in this process are in millions, business, marketing, strategy, graph.
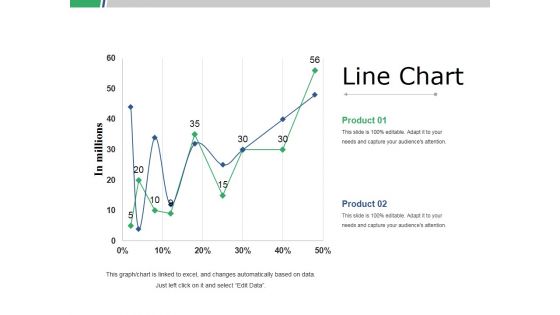
Line Chart Ppt PowerPoint Presentation Slides Graphics Template
This is a line chart ppt powerpoint presentation slides graphics template. This is a two stage process. The stages in this process are business, marketing, strategy, line graph, finance.
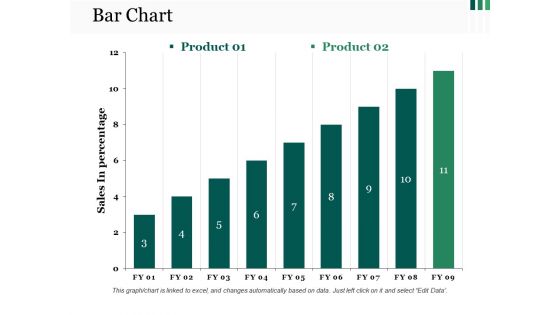
Bar Chart Ppt PowerPoint Presentation Show Format Ideas
This is a bar chart ppt powerpoint presentation show format ideas. This is a two stage process. The stages in this process are bar graph, growth, success, business, marketing.
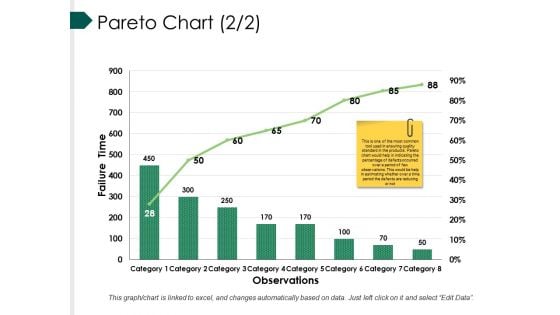
Pareto Chart Template Ppt PowerPoint Presentation Summary Graphic Images
This is a pareto chart template ppt powerpoint presentation summary graphic images. This is a eight stage process. The stages in this process are bar, marketing, strategy, finance, teamwork.
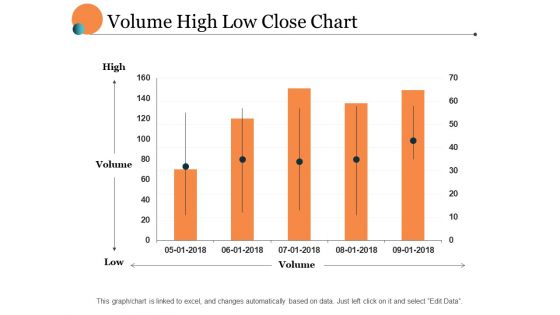
Volume High Low Close Chart Ppt PowerPoint Presentation Portfolio Layout
This is a volume high low close chart ppt powerpoint presentation portfolio layout. This is a five stage process. The stages in this process are finance, marketing, management, investment, analysis.
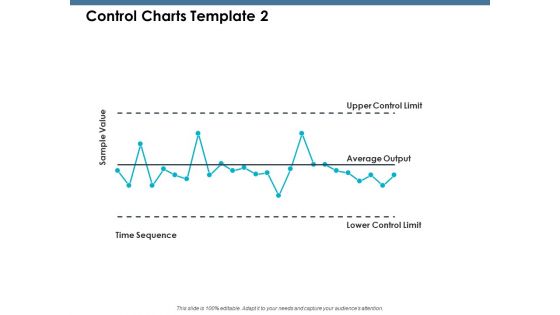
Control Charts Sample Value Ppt PowerPoint Presentation Infographics Demonstration
This is a control charts sample value ppt powerpoint presentation infographics demonstration. This is a five stage process. The stages in this process are product, percentage, marketing, business, management.
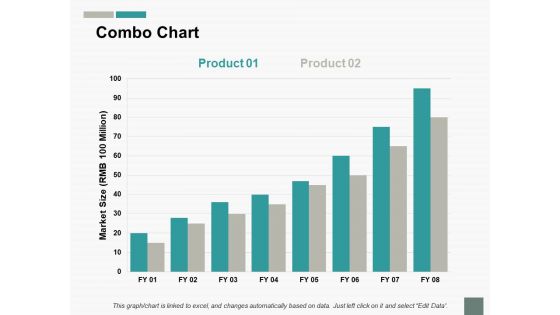
Combo Chart Finance Ppt PowerPoint Presentation Infographic Template Graphics
This is a combo chart finance ppt powerpoint presentation infographic template graphics. This is a two stage process. The stages in this process are growth, finance, marketing, management, investment.
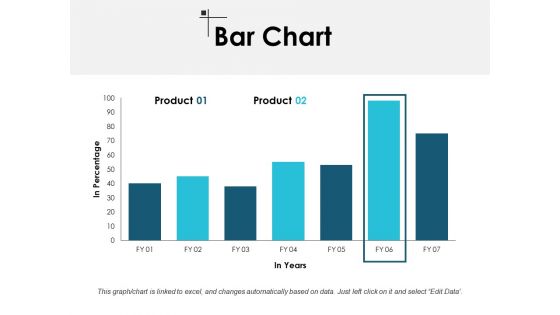
Bar Chart Finance Ppt PowerPoint Presentation Model Master Slide
This is a bar chart finance ppt powerpoint presentation model master slide. This is a two stage process. The stages in this process are finance, marketing, management, investment, analysis.
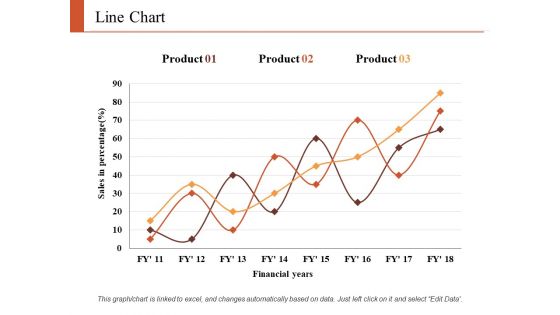
Line Chart Finance Ppt PowerPoint Presentation Infographic Template Graphics Tutorials
This is a line chart finance ppt powerpoint presentation infographic template graphics tutorials. This is a three stage process. The stages in this process are finance, marketing, analysis, business, investment.
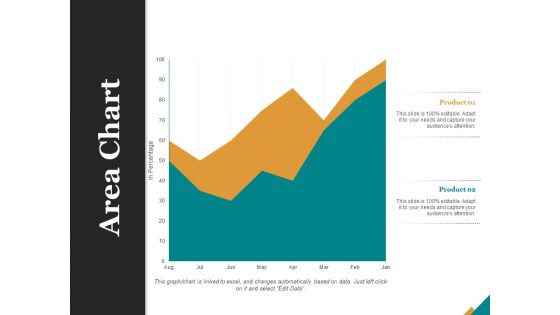
Area Chart Finance Ppt PowerPoint Presentation Summary Design Templates
This is a area chart finance ppt powerpoint presentation summary design templates. This is a two stage process. The stages in this process are finance, marketing, management, investment, analysis.
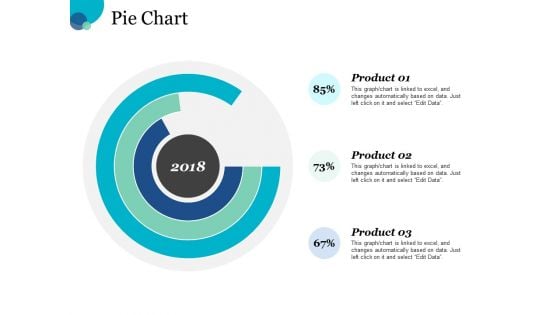
Pie Chart Finance Ppt PowerPoint Presentation Slides Graphic Images
This is a pie chart finance ppt powerpoint presentation slides graphic images. This is a three stage process. The stages in this process are finance, marketing, management, investment, analysis.
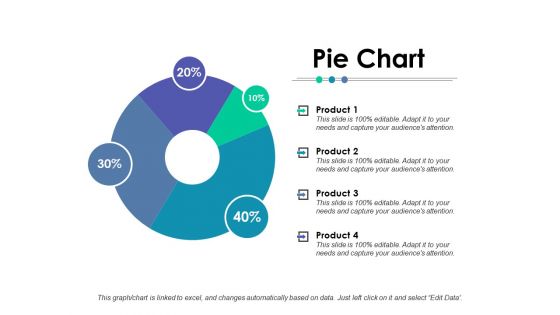
Pie Chart Finance Ppt PowerPoint Presentation Styles File Formats
This is a pie chart finance ppt powerpoint presentation styles file formats. This is a four stage process. The stages in this process are finance, analysis, business, investment, marketing.
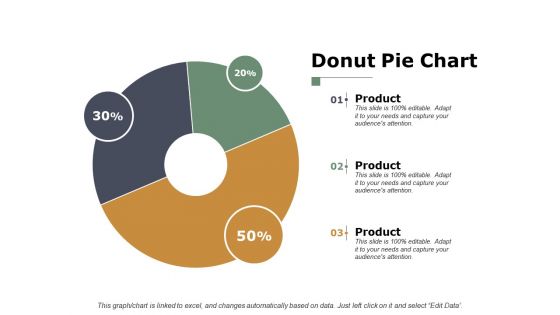
Donut Pie Chart Finance Ppt PowerPoint Presentation Inspiration Graphics
This is a donut pie chart finance ppt powerpoint presentation inspiration graphics. This is a three stage process. The stages in this process are finance, analysis, business, investment, marketing.
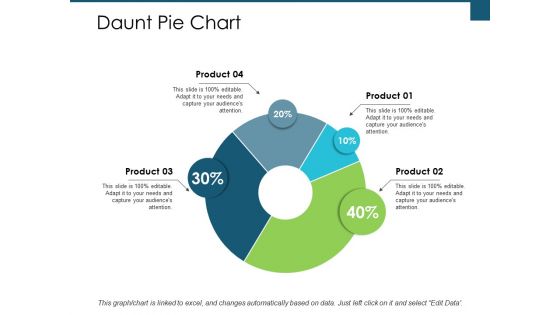
Daunt Pie Chart Investment Ppt PowerPoint Presentation Infographic Template Aids
This is a daunt pie chart investment ppt powerpoint presentation infographic template aids. This is a four stage process. The stages in this process are finance, analysis, business, investment, marketing.
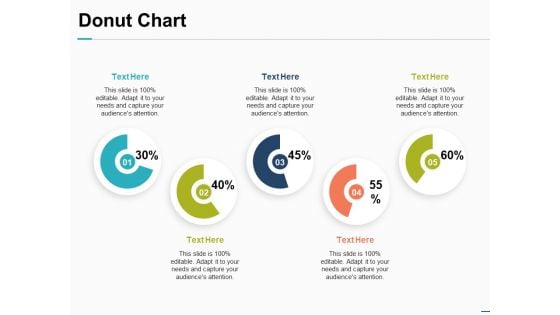
Donut Chart Financial Investment Ppt PowerPoint Presentation Inspiration Introduction
This is a donut chart financial investment ppt powerpoint presentation inspiration introduction. This is a five stage process. The stages in this process are finance, marketing, management, investment, analysis.
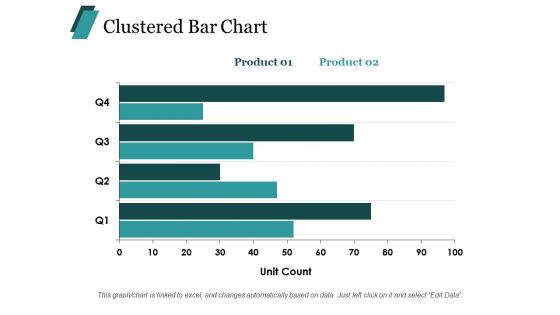
Clustered Bar Chart Finance Ppt PowerPoint Presentation Summary Layouts
This is a clustered bar chart finance ppt powerpoint presentation summary layouts. This is a two stage process. The stages in this process are finance, marketing, management, investment, analysis.
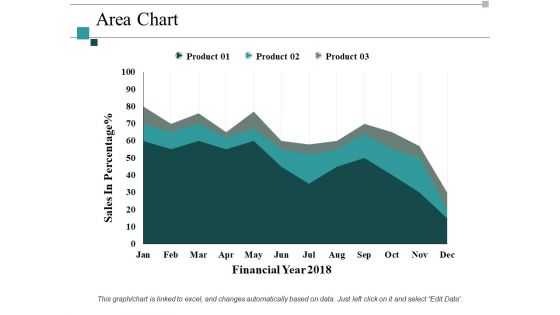
Area Chart Investment Ppt PowerPoint Presentation Summary Design Inspiration
This is a area chart investment ppt powerpoint presentation summary design inspiration. This is a three stage process. The stages in this process are finance, marketing, management, investment, analysis.
Column Chart Finance Ppt Powerpoint Presentation Infographic Template Icon
This is a column chart finance ppt powerpoint presentation infographic template icon. This is a three stage process. The stages in this process are finance, marketing, management, investment, analysis.
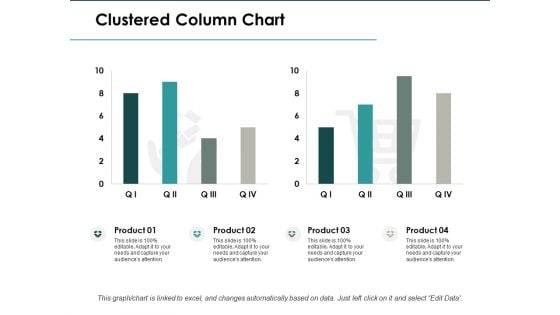
Clustered Column Chart Investment Ppt PowerPoint Presentation Infographic Template Clipart
This is a clustered column chart investment ppt powerpoint presentation infographic template clipart. This is a four stage process. The stages in this process are finance, analysis, business, investment, marketing.
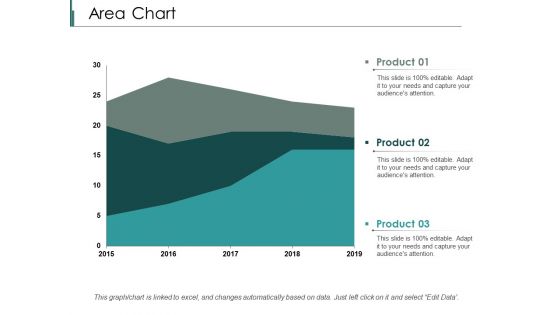
Area Chart Finance Ppt PowerPoint Presentation Styles Designs Download
This is a area chart finance ppt powerpoint presentation styles designs download. This is a three stage process. The stages in this process are finance, analysis, business, investment, marketing.
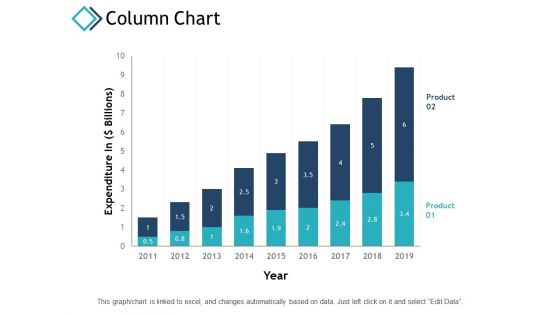
Column Chart Finance Investment Ppt PowerPoint Presentation Inspiration Template
This is a column chart finance investment ppt powerpoint presentation inspiration template. This is a two stage process. The stages in this process are finance, analysis, business, investment, marketing.
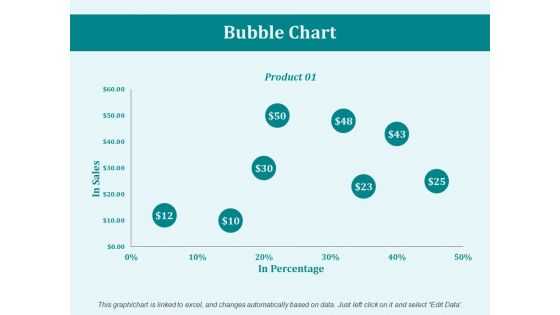
Bubble Chart Product Ppt PowerPoint Presentation Inspiration Design Ideas
This is a bubble chart product ppt powerpoint presentation inspiration design ideas. This is a one stage process. The stages in this process are business, management, marketing, product, percentage.
Open High Low Close Chart Ppt PowerPoint Presentation Icon Portrait
This is a open high low close chart ppt powerpoint presentation icon portrait. This is a two stage process. The stages in this process are business, management, marketing, percentage, product.
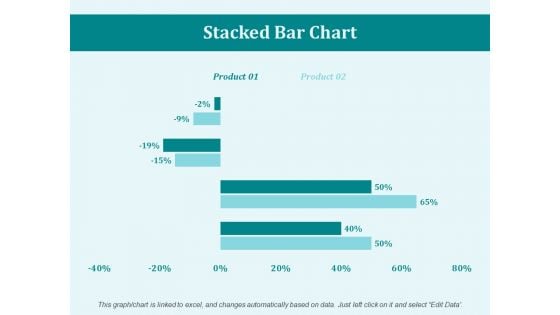
Stacked Bar Chart Percentage Ppt PowerPoint Presentation Portfolio Mockup
This is a stacked bar chart percentage ppt powerpoint presentation portfolio mockup. This is a two stage process. The stages in this process are business, marketing, management, percentage, product.
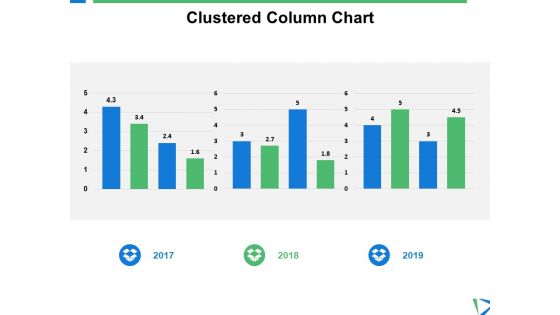
Clustered Column Chart Finance Ppt PowerPoint Presentation Gallery Styles
This is a clustered column chart finance ppt powerpoint presentation gallery styles. This is a three stage process. The stages in this process are finance, analysis, business, investment, marketing.
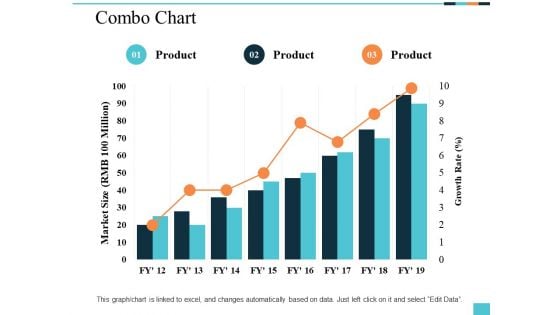
Combo Chart Product Ppt PowerPoint Presentation Professional Graphics Template
This is a combo chart product ppt powerpoint presentation professional graphics template. This is a three stage process. The stages in this process are finance, marketing, management, investment, product.
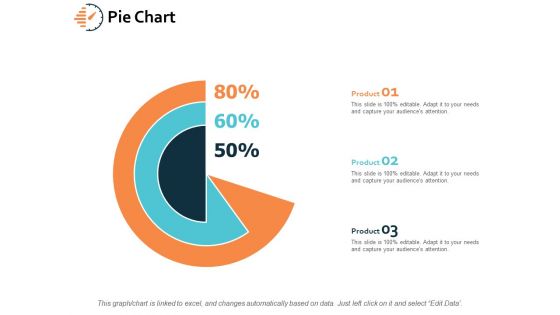
Pie Chart Investment Finance Ppt PowerPoint Presentation File Influencers
This is a pie chart investment finance ppt powerpoint presentation file influencers. This is a three stage process. The stages in this process are finance, analysis, business, investment, marketing.
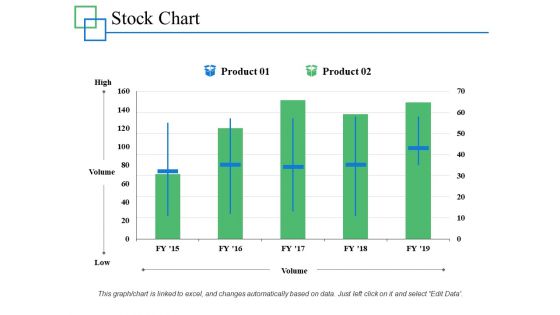
Stock Chart Management Investment Ppt PowerPoint Presentation Infographics Professional
This is a stock chart management investment ppt powerpoint presentation infographics professional. This is a two stage process. The stages in this process are marketing, business, management, percentage, product.
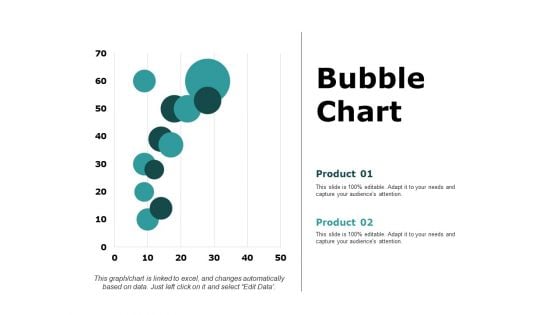
Bubble Chart Percentage Product Ppt PowerPoint Presentation Ideas Aids
This is a bubble chart percentage product ppt powerpoint presentation ideas aids. This is a two stage process. The stages in this process are business, management, marketing, percentage, product.
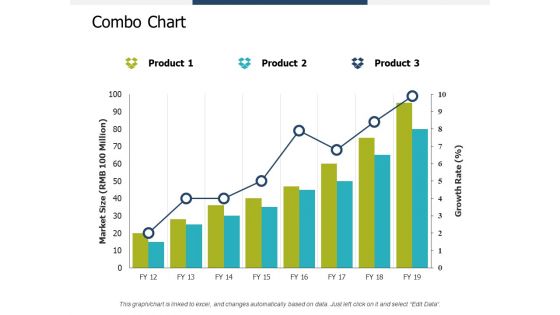
Combo Chart Investment Ppt PowerPoint Presentation Summary Infographic Template
This is a combo chart investment ppt powerpoint presentation summary infographic template. This is a three stage process. The stages in this process are finance, analysis, business, investment, marketing.
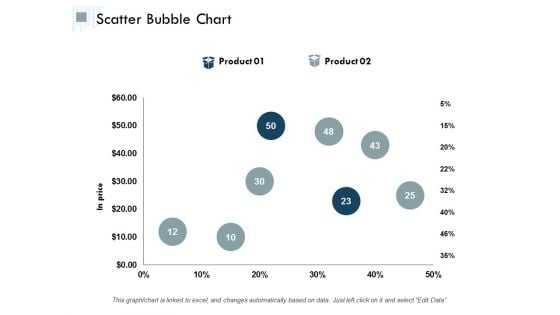
Scatter Bubble Chart Ppt PowerPoint Presentation Infographic Template Graphics Design
This is a scatter bubble chart ppt powerpoint presentation infographic template graphics design. This is a two stage process. The stages in this process are finance, analysis, business, investment, marketing.
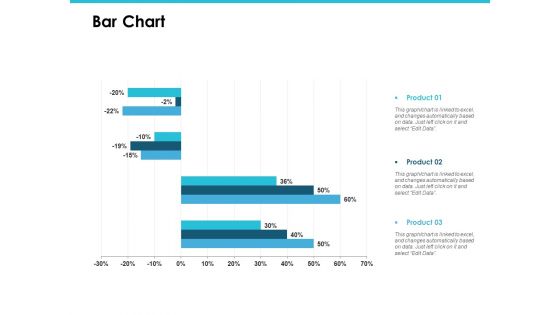
Bar Chart Management Investment Ppt PowerPoint Presentation File Rules
This is a bar chart management investment ppt powerpoint presentation file rules. This is a three stage process. The stages in this process are finance, marketing, management, investment, analysis.
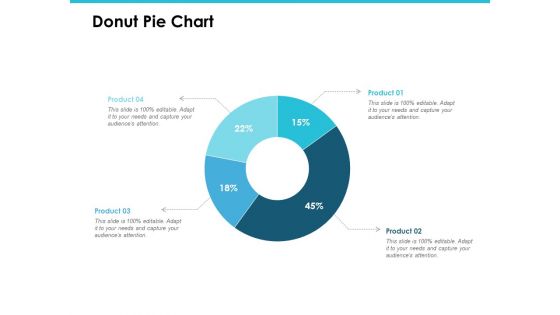
Donut Pie Chart Investment Analysis Ppt PowerPoint Presentation Gallery Introduction
This is a donut pie chart investment analysis ppt powerpoint presentation gallery introduction. This is a four stage process. The stages in this process are finance, marketing, management, investment, analysis.
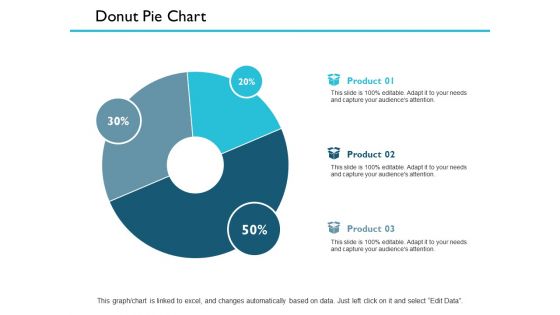
Donut Pie Chart Finance Ppt PowerPoint Presentation Outline Smartart
This is a donut pie chart finance ppt powerpoint presentation outline smartart. This is a three stage process. The stages in this process are management, marketing, business, strategy, finance.
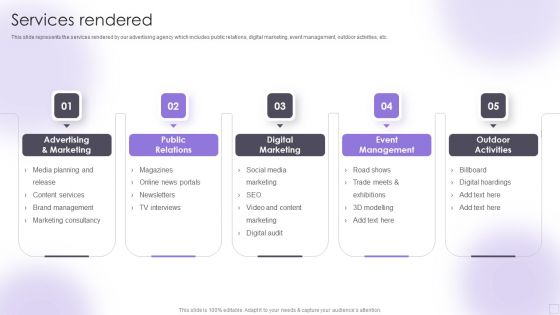
Advertising Services Company Profile Services Rendered Rules PDF
This slide represents the services rendered by our advertising agency which includes public relations, digital marketing, event management, outdoor activities, etc. This is a Advertising Services Company Profile Services Rendered Rules PDF template with various stages. Focus and dispense information on five stages using this creative set, that comes with editable features. It contains large content boxes to add your information on topics like Advertising And Marketing, Public Relations, Digital Marketing, Event Management, Outdoor Activities. You can also showcase facts, figures, and other relevant content using this PPT layout. Grab it now.
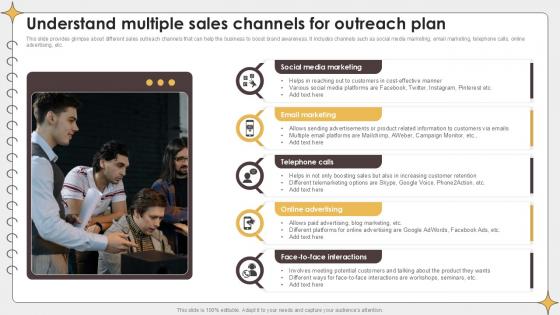
Understand Multiple Sales Channels Planning Outreach Campaigns PPT Template
This slide provides glimpse about different sales outreach channels that can help the business to boost brand awareness. It includes channels such as social media marketing, email marketing, telephone calls, online advertising, etc. Are you searching for a Understand Multiple Sales Channels Planning Outreach Campaigns PPT Template that is uncluttered, straightforward, and original Its easy to edit, and you can change the colors to suit your personal or business branding. For a presentation that expresses how much effort you have put in, this template is ideal With all of its features, including tables, diagrams, statistics, and lists, its perfect for a business plan presentation. Make your ideas more appealing with these professional slides. Download Understand Multiple Sales Channels Planning Outreach Campaigns PPT Template from Slidegeeks today. This slide provides glimpse about different sales outreach channels that can help the business to boost brand awareness. It includes channels such as social media marketing, email marketing, telephone calls, online advertising, etc.


 Continue with Email

 Home
Home


