Marketing Icon
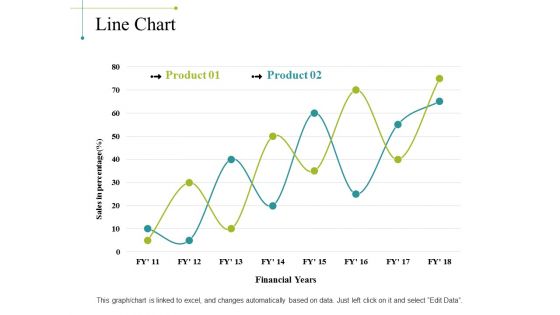
Line Chart Ppt PowerPoint Presentation Portfolio Background Image
This is a line chart ppt powerpoint presentation portfolio background image. This is a two stage process. The stages in this process are sales in percentage, financial years, chart, business, marketing, finance.
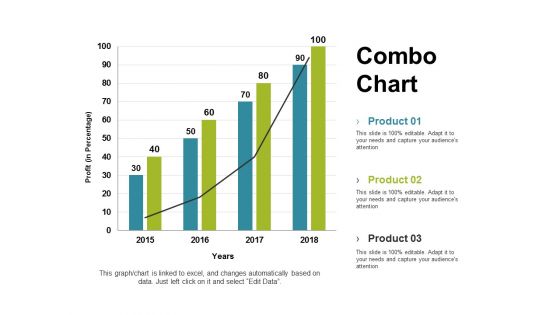
Combo Chart Ppt PowerPoint Presentation Gallery Graphics Tutorials
This is a Combo Chart Ppt PowerPoint Presentation Gallery Graphics Tutorials. This is a three stage process. The stages in this process are combo chart, finance, marketing, strategy, analysis.
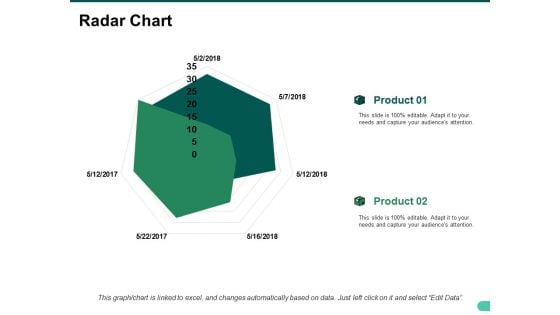
Radar Chart Ppt PowerPoint Presentation Show Graphic Images
This is a radar chart ppt powerpoint presentation show graphic images. This is a two stage process. The stages in this process are business, radar chart, marketing, graph, strategy.
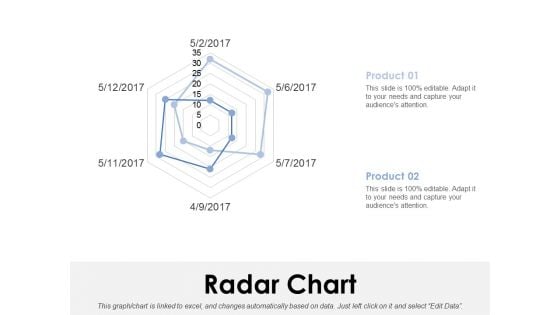
Radar Chart Ppt PowerPoint Presentation Model Clipart Images
This is a radar chart ppt powerpoint presentation model clipart images. This is a two stage process. The stages in this process are radar chart, finance, analysis, marketing, strategy, business.
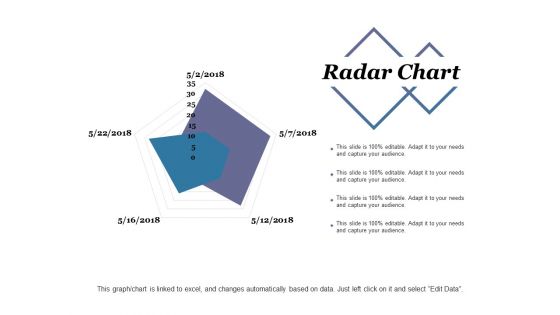
Radar Chart Ppt PowerPoint Presentation Infographic Template Sample
This is a radar chart ppt powerpoint presentation infographic template sample. This is a two stage process. The stages in this process are radar chart, finance, marketing, strategy, analysis.
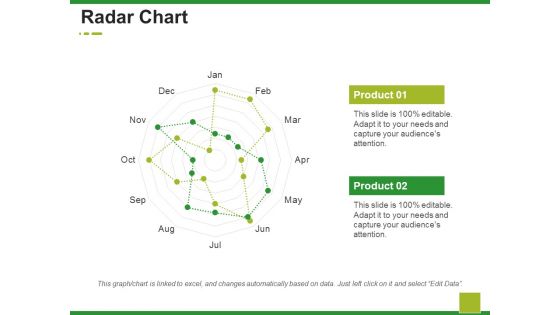
Radar Chart Ppt PowerPoint Presentation Ideas Design Ideas
This is a radar chart ppt powerpoint presentation ideas design ideas. This is a two stage process. The stages in this process are business, marketing, radar chart, finance, strategy.
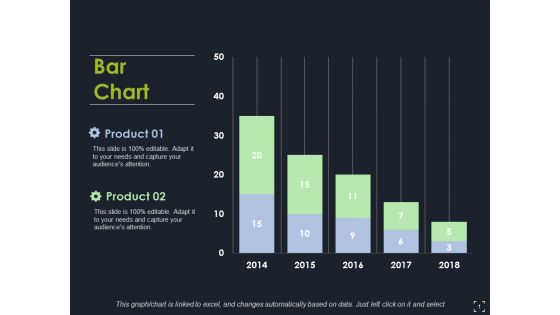
Bar Chart Ppt PowerPoint Presentation Model Clipart Images
This is a bar chart ppt powerpoint presentation model clipart images. This is a two stage process. The stages in this process are bar chart, finance, marketing, strategy, analysis.
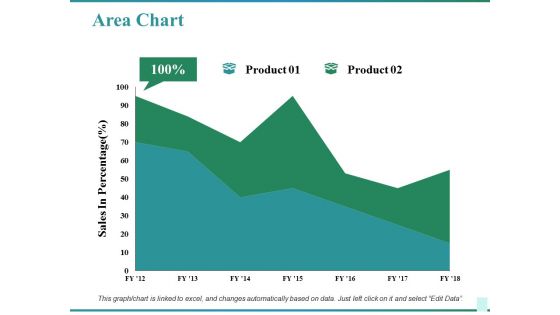
Area Chart Ppt PowerPoint Presentation Inspiration Background Designs
This is a area chart ppt powerpoint presentation inspiration background designs. This is a two stage process. The stages in this process are business, sales in percentage, area chart, marketing, finance.
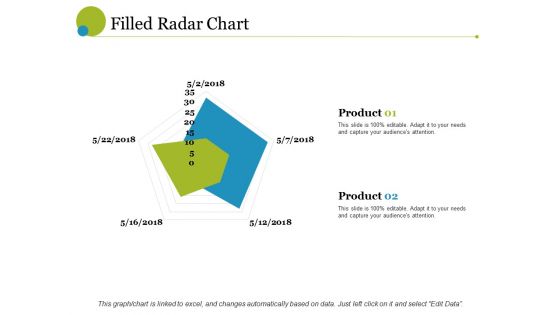
filled radar chart ppt powerpoint presentation ideas brochure
This is a filled radar chart ppt powerpoint presentation ideas brochure. This is a two stage process. The stages in this process are radar chart, finance, analysis, business, marketing, strategy.
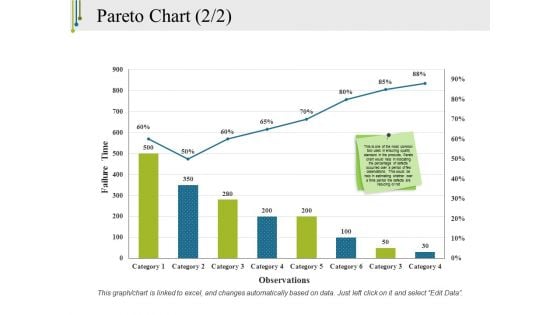
Pareto Chart Template 2 Ppt PowerPoint Presentation Outline Model
This is a pareto chart template 2 ppt powerpoint presentation outline model. This is a eight stage process. The stages in this process are pareto chart, finance, marketing, strategy, analysis.
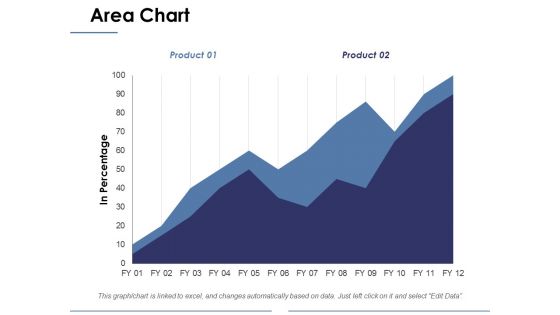
Area Chart Ppt PowerPoint Presentation Layouts Background Designs
This is a area chart ppt powerpoint presentation layouts background designs. This is a two stage process. The stages in this process are business, marketing, in percentage, area chart, finance.
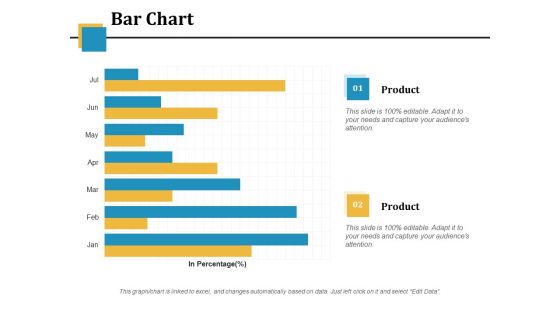
Bar Chart Ppt PowerPoint Presentation Infographic Template Picture
This is a bar chart ppt powerpoint presentation infographic template picture. This is a two stage process. The stages in this process are financial, in percentage, business, marketing, bar chart.
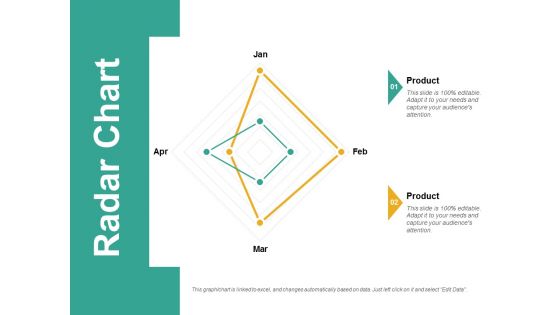
Radar Chart Ppt PowerPoint Presentation Visual Aids Professional
This is a radar chart ppt powerpoint presentation visual aids professional. This is a two stage process. The stages in this process are radar chart, finance, marketing, strategy, business.

Area Chart Ppt PowerPoint Presentation Styles Design Templates
This is a area chart ppt powerpoint presentation styles design templates. This is a two stage process. The stages in this process are area chart, analysis, business, marketing, strategy.

Combo Chart Ppt PowerPoint Presentation Inspiration Slide Download
This is a combo chart ppt powerpoint presentation inspiration slide download. This is a two stage process. The stages in this process are Combo chart, finance, marketing, strategy, analysis.
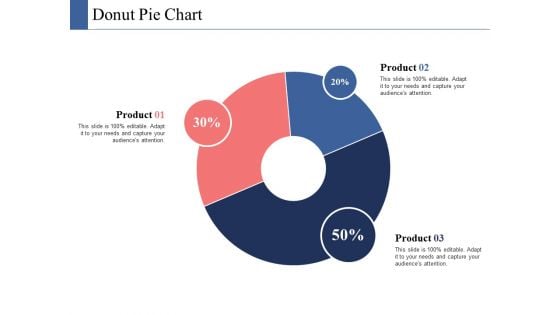
Donut Pie Chart Ppt PowerPoint Presentation Infographics Ideas
This is a donut pie chart ppt powerpoint presentation infographics ideas. This is a three stage process. The stages in this process are donut pie chart, finance, marketing, strategy, analysis.
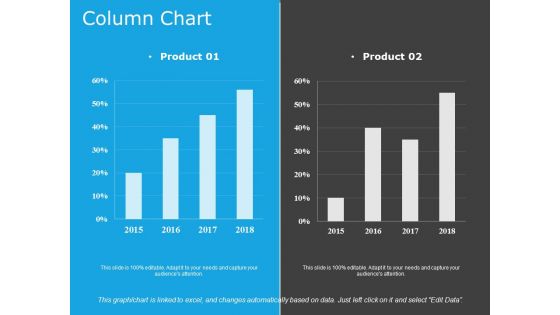
Column Chart Template 1 Ppt PowerPoint Presentation Portfolio Format
This is a column chart template 1 ppt powerpoint presentation portfolio format. This is a two stage process. The stages in this process are column chart, finance, marketing, strategy, business.
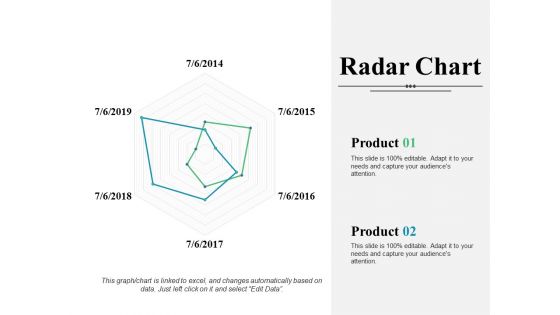
Radar Chart Ppt PowerPoint Presentation Infographic Template Introduction
This is a radar chart ppt powerpoint presentation infographic template introduction. This is a two stage process. The stages in this process are radar chart, finance, marketing, strategy, analysis, business.

Area Chart Ppt PowerPoint Presentation Infographic Template Designs
This is a area chart ppt powerpoint presentation infographic template designs. This is a two stage process. The stages in this process are area chart, finance, marketing, strategy, business.
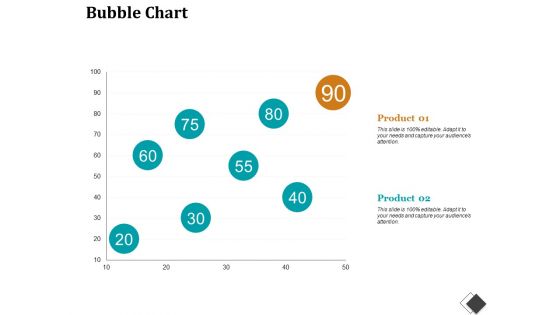
Bubble Chart Enterprise Model Canvas Ppt PowerPoint Presentation File Structure
This is a bubble chart enterprise model canvas ppt powerpoint presentation file structure. This is a two stage process. The stages in this process are bubble chart, finance, marketing, strategy, analysis, investment.
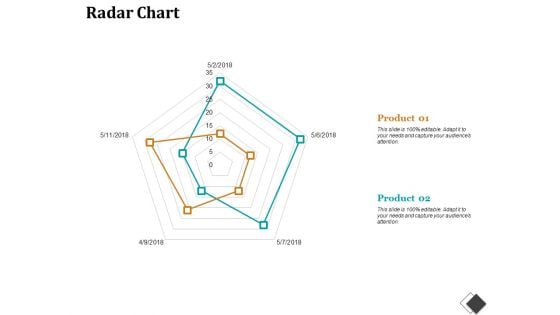
Radar Chart Enterprise Model Canvas Ppt PowerPoint Presentation File Slides
This is a radar chart enterprise model canvas ppt powerpoint presentation file slides. This is a two stage process. The stages in this process are radar chart, finance, marketing, strategy, business.
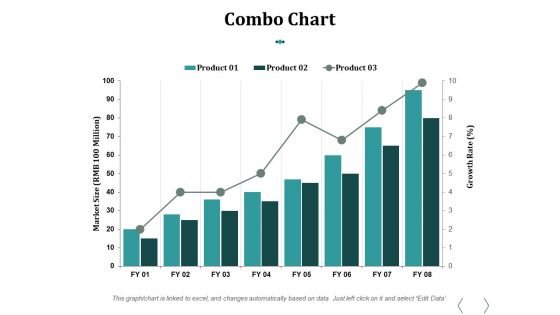
Combo Chart Ppt PowerPoint Presentation Summary Graphic Images
This is a combo chart ppt powerpoint presentation summary graphic images. This is a three stage process. The stages in this process are combo chart, product, growth, marketing, business.
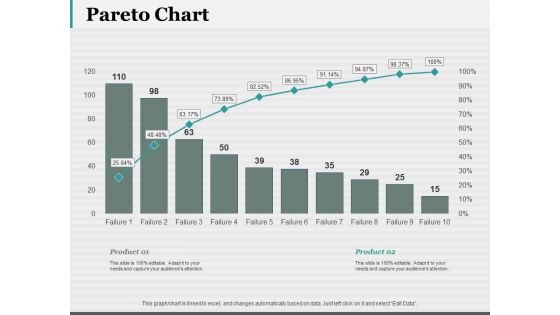
Pareto Chart Ppt PowerPoint Presentation Visual Aids Pictures
This is a pareto chart ppt powerpoint presentation visual aids pictures. This is a two stage process. The stages in this process are pareto chart, finance, marketing, strategy, business.

Bubble Chart Analysis Ppt PowerPoint Presentation Gallery Introduction
This is a bubble chart analysis ppt powerpoint presentation gallery introduction. This is a two stage process. The stages in this process are bubble chart, finance, marketing, strategy, business.
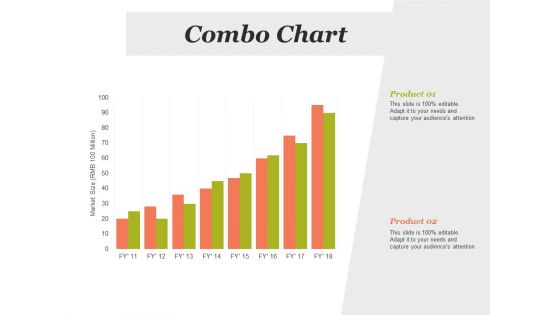
Combo Chart Process Ppt PowerPoint Presentation Model Clipart
This is a combo chart process ppt powerpoint presentation model clipart. This is a two stage process. The stages in this process are combo chart, finance, marketing, strategy, business.
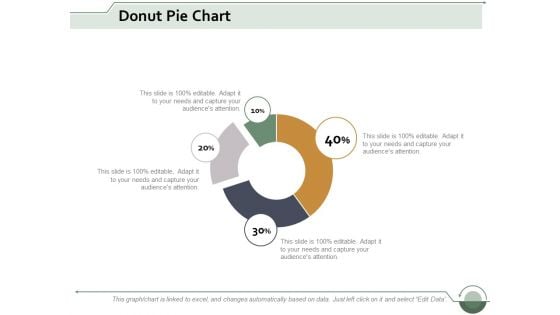
donut pie chart investment ppt powerpoint presentation show guide
This is a donut pie chart investment ppt powerpoint presentation show guide. This is a four stage process. The stages in this process are donut pie chart, finance, marketing, business, analysis.
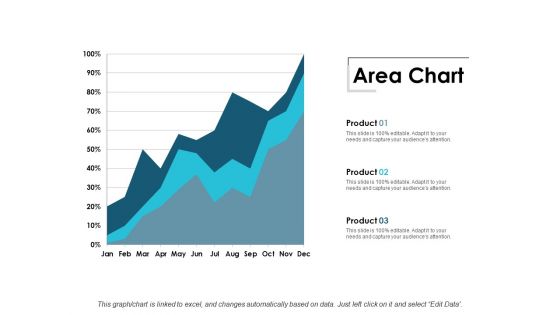
Area Chart Finance Ppt Powerpoint Presentation Slides Picture
This is a area chart finance ppt powerpoint presentation slides picture. This is a three stage process. The stages in this process are area chart, finance, marketing, management, investment.
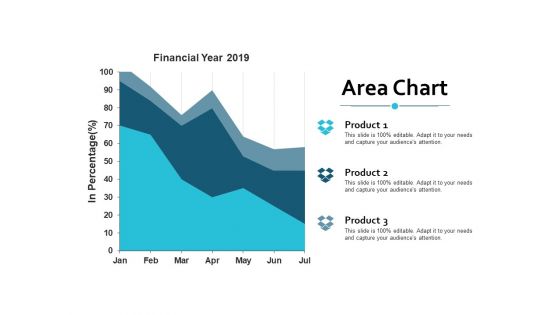
Area Chart Finance Ppt Powerpoint Presentation Inspiration Example
This is a area chart finance ppt powerpoint presentation inspiration example. This is a three stage process. The stages in this process are area chart, finance, marketing, management, investment.
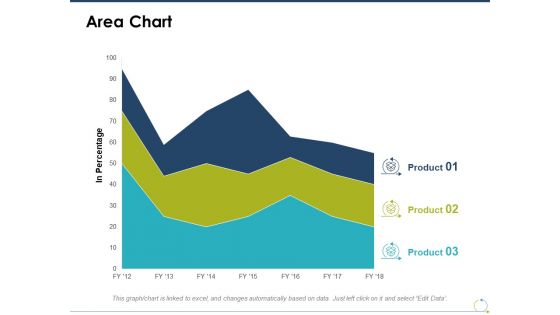
Area Chart Investment Ppt PowerPoint Presentation Gallery Example Introduction
This is a area chart investment ppt powerpoint presentation gallery example introduction. This is a three stage process. The stages in this process are area chart, finance, marketing, management, investment.

Area Chart Product Percentage Ppt PowerPoint Presentation Infographic Template Slide
This is a area chart product percentage ppt powerpoint presentation infographic template slide. This is a four stage process. The stages in this process are area chart, finance, marketing, management, investment.
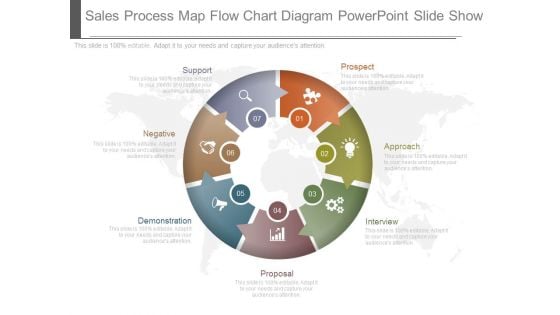
Sales Process Map Flow Chart Diagram Powerpoint Slide Show
This is a sales process map flow chart diagram powerpoint slide show. This is a seven stage process. The stages in this process are prospect, approach, interview, proposal, demonstration, negative, support.
Polygraphic Pie Chart Business PowerPoint Templates And PowerPoint Themes 0712
Polygraphic Pie Chart Business PowerPoint Templates And PowerPoint Themes 0712-Microsoft Powerpoint Templates and Background with polygraphic pie chart Take on the banter with our Polygraphic Pie Chart Business PowerPoint Templates And PowerPoint Themes 0712. They give you the advantage in any argument.
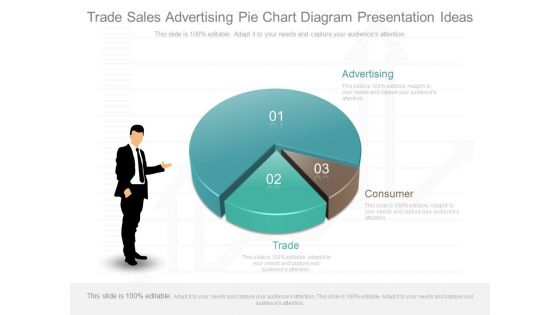
Trade Sales Advertising Pie Chart Diagram Presentation Ideas
This is a trade sales advertising pie chart diagram presentation ideas. This is a three stage process. The stages in this process are advertising, trade, consumer.
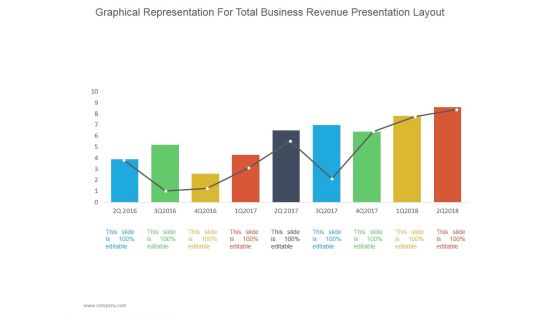
Graphical Representation For Total Business Revenue Ppt PowerPoint Presentation Diagrams
This is a graphical representation for total business revenue ppt powerpoint presentation diagrams. This is a nine stage process. The stages in this process are business, strategy, line chart, bar graph, marketing, management.

Data Collection Scatter Diagram Ppt PowerPoint Presentation Gallery Graphics Example
This is a data collection scatter diagram ppt powerpoint presentation gallery graphics example. This is a three stage process. The stages in this process are line chart, finance, marketing, management, investment.
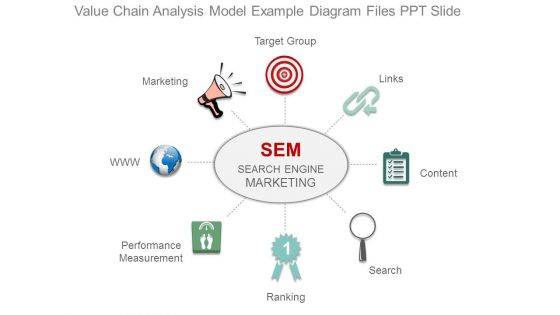
Value Chain Analysis Model Example Diagram Files Ppt Slide
This is a value chain analysis model example diagram files ppt slide. This is a eight stage process. The stages in this process are sem, search engine, marketing, marketing, target group, links, content, search, ranking, performance measurement, www.
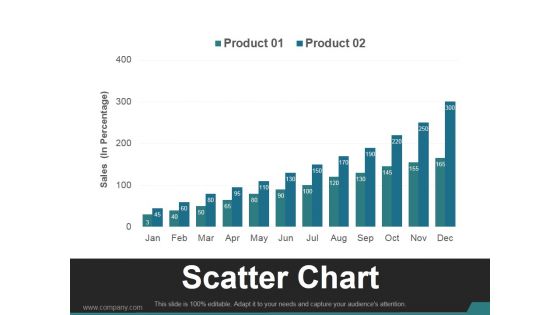
Scatter Chart Template 1 Ppt PowerPoint Presentation Visual Aids
This is a scatter chart template 1 ppt powerpoint presentation visual aids. This is a twelve stage process. The stages in this process are business, marketing, growth, finance, management.
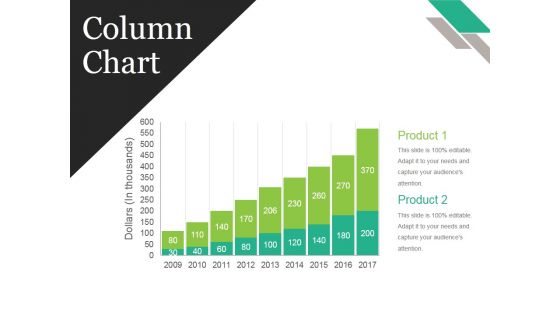
Column Chart Ppt PowerPoint Presentation Show Background Images
This is a column chart ppt powerpoint presentation show background images. This is a nine stage process. The stages in this process are business, strategy, marketing, analysis, growth strategy.

Our Charts And Graphs Ppt PowerPoint Presentation File Visuals
This is a our charts and graphs ppt powerpoint presentation file visuals. This is a one stage process. The stages in this process are business, strategy, marketing, analysis, finance.
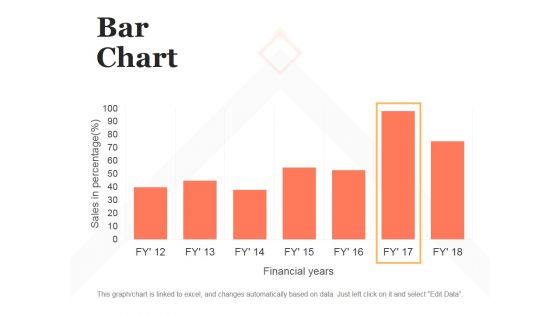
Bar Chart Ppt PowerPoint Presentation Infographic Template Brochure
This is a bar chart ppt powerpoint presentation infographic template brochure. This is a seven stage process. The stages in this process are bar graph, finance, marketing, strategy, analysis, business.
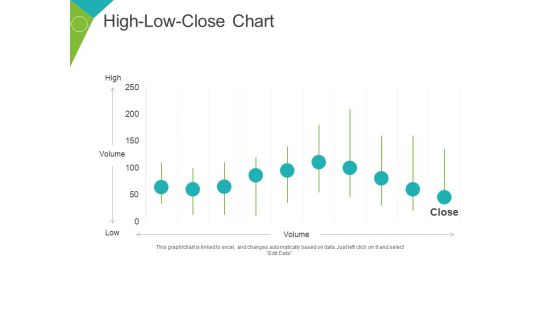
High Low Close Chart Ppt PowerPoint Presentation Layouts Guide
This is a high low close chart ppt powerpoint presentation layouts guide. This is a ten stage process. The stages in this process are high, volume, low, business, marketing, finance.
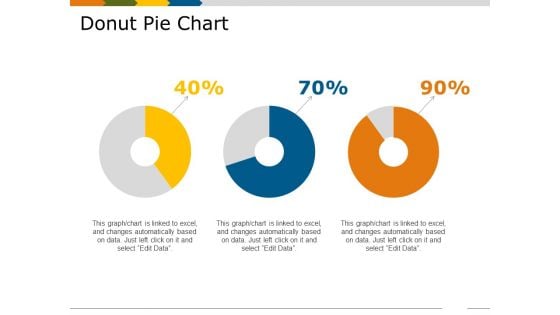
Donut Pie Chart Template 2 Ppt PowerPoint Presentation Show Skills
This is a donut pie chart template 2 ppt powerpoint presentation show skills. This is a three stage process. The stages in this process are percentage, business, marketing, process, finance.
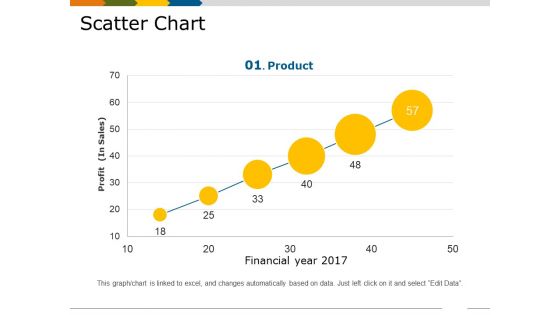
Scatter Chart Template 1 Ppt PowerPoint Presentation Show Slides
This is a scatter chart template 1 ppt powerpoint presentation show slides. This is a six stage process. The stages in this process are financial year, profit in sales, growth, business, marketing, product.
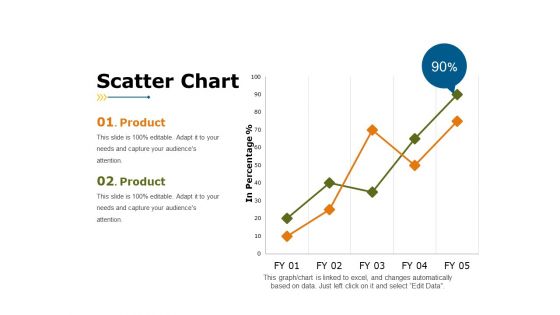
Scatter Chart Template 2 Ppt PowerPoint Presentation Styles Visual Aids
This is a scatter chart template 2 ppt powerpoint presentation styles visual aids. This is a two stage process. The stages in this process are product, business, marketing, in percentage, growth.
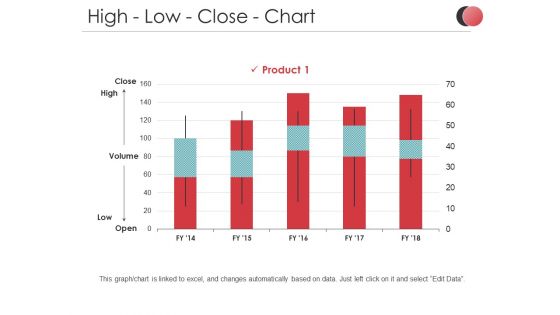
High Low Close Chart Ppt PowerPoint Presentation Ideas Brochure
This is a high low close chart ppt powerpoint presentation ideas brochure. This is a three stage process. The stages in this process are in percentage, product, business, marketing, finance.
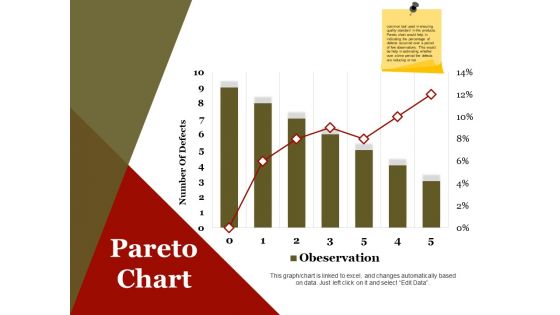
Pareto Chart Ppt PowerPoint Presentation Infographics Design Inspiration
This is a pareto chart ppt powerpoint presentation infographics design inspiration. This is a seven stage process. The stages in this process are number of defects, business, marketing, finance.
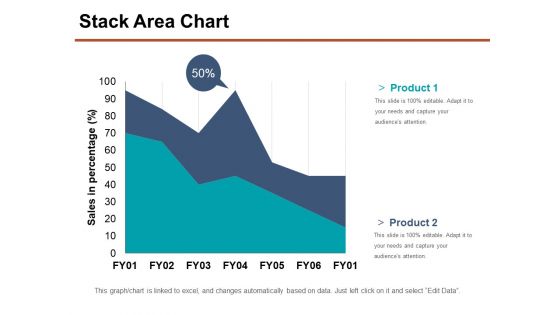
Stack Area Chart Ppt PowerPoint Presentation Show Samples
This is a stack area chart ppt powerpoint presentation show samples. This is a two stage process. The stages in this process are product, sales in percentage, business, marketing, percentage.
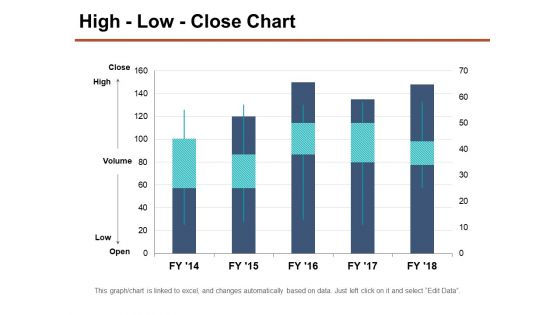
High Low Close Chart Ppt PowerPoint Presentation Layouts Objects
This is a high low close chart ppt powerpoint presentation layouts objects. This is a five stage process. The stages in this process are high, volume, low, business, marketing.
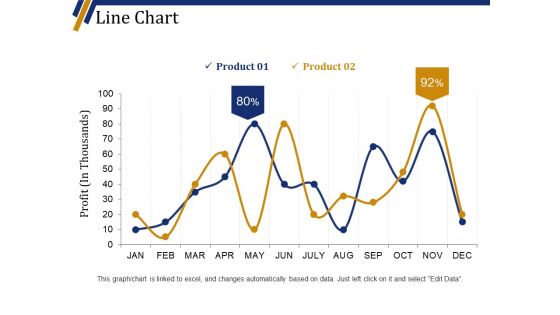
Line Chart Ppt PowerPoint Presentation Portfolio Background Designs
This is a line chart ppt powerpoint presentation portfolio background designs. This is a two stage process. The stages in this process are product, business, finance, marketing, profit in thousands.
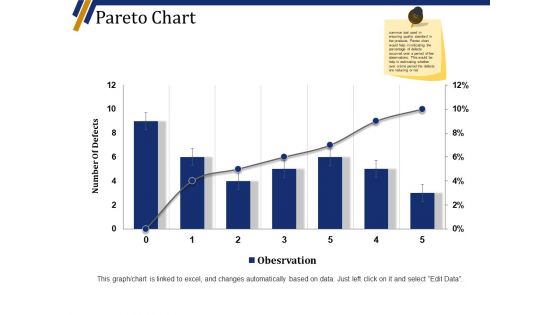
Pareto Chart Ppt PowerPoint Presentation File Infographic Template
This is a pareto chart ppt powerpoint presentation file infographic template. This is a six stage process. The stages in this process are number of defects, business, marketing, graph.
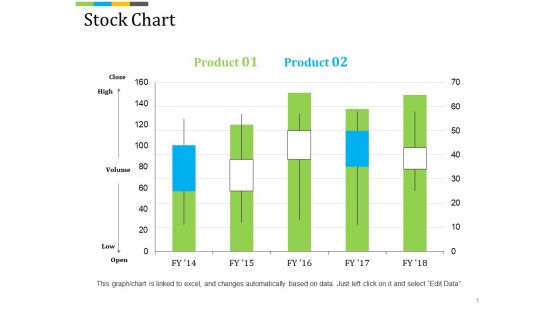
Stock Chart Ppt PowerPoint Presentation Professional Background Image
This is a stock chart ppt powerpoint presentation professional background image. This is a five stage process. The stages in this process are high, volume, low, finance, business, marketing.
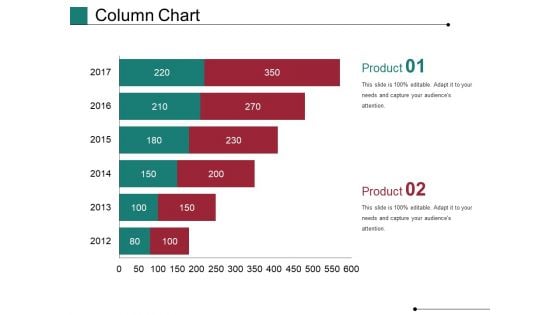
Column Chart Ppt PowerPoint Presentation Show Master Slide
This is a column chart ppt powerpoint presentation show master slide. This is a six stage process. The stages in this process are financial, years, business, marketing, finance, graph.
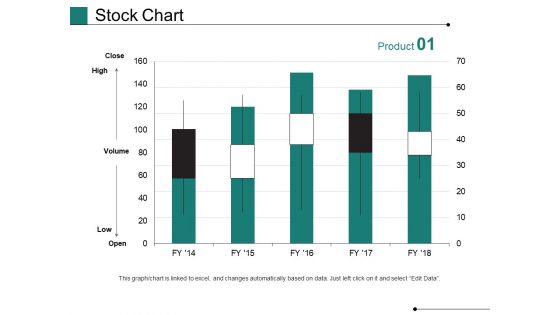
Stock Chart Ppt PowerPoint Presentation Pictures Graphics Design
This is a stock chart ppt powerpoint presentation pictures graphics design. This is a five stage process. The stages in this process are high, volume, low, business, marketing, graph.
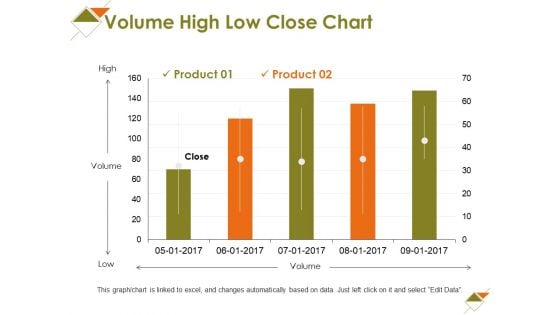
Volume High Low Close Chart Ppt PowerPoint Presentation Slides Styles
This is a volume high low close chart ppt powerpoint presentation slides styles. This is a two stage process. The stages in this process are high, volume, low, business, marketing.
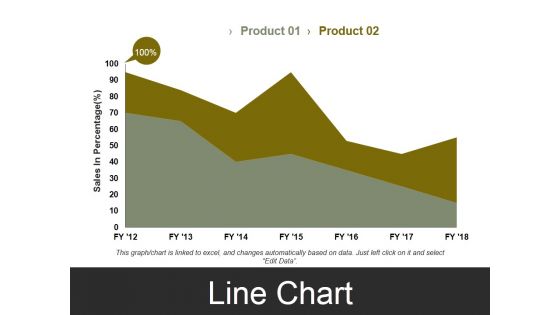
Line Chart Template 3 Ppt PowerPoint Presentation Styles Visual Aids
This is a line chart template 3 ppt powerpoint presentation styles visual aids. This is a two stage process. The stages in this process are sales in percentage, business, marketing, finance, graph.
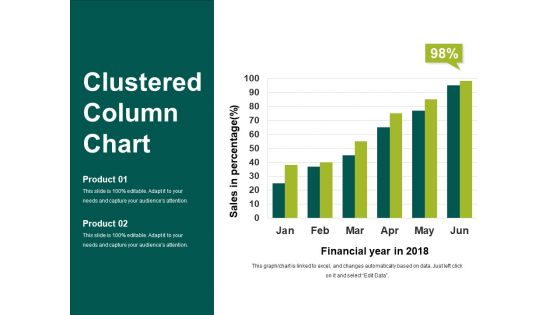
Clustered Column Chart Ppt PowerPoint Presentation Show Slideshow
This is a clustered column chart ppt powerpoint presentation show slideshow. This is a six stage process. The stages in this process are financial year in, sales in percentage, business, marketing, finance.
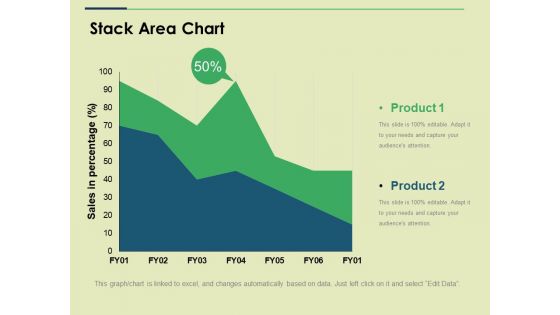
Stack Area Chart Ppt PowerPoint Presentation Show Slide
This is a stack area chart ppt powerpoint presentation show slide. This is a two stage process. The stages in this process are sales in percentage, business, marketing, strategy, graph.
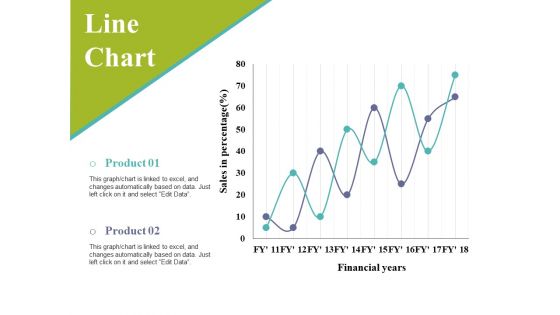
Line Chart Ppt PowerPoint Presentation Infographic Template Slides
This is a line chart ppt powerpoint presentation infographic template slides. This is a two stage process. The stages in this process are sales in percentage, financial years, business, marketing, graph.
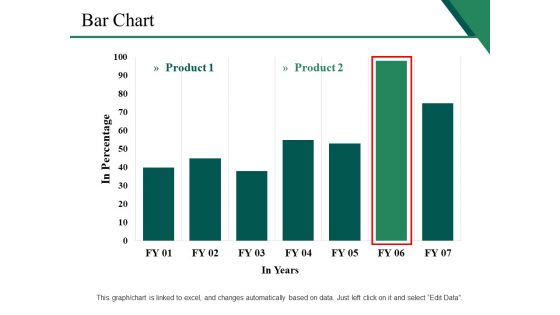
Bar Chart Ppt PowerPoint Presentation Inspiration Background Image
This is a bar chart ppt powerpoint presentation inspiration background image. This is a two stage process. The stages in this process are business, marketing, strategy, finance, in years, in percentage.
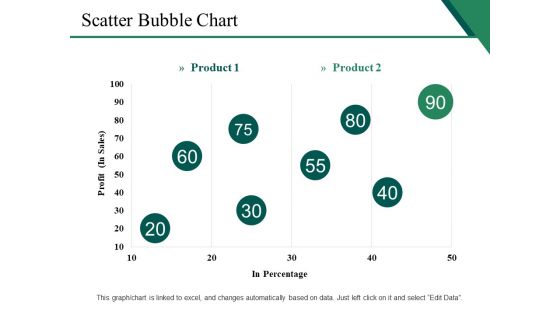
Scatter Bubble Chart Ppt PowerPoint Presentation Gallery Show
This is a scatter bubble chart ppt powerpoint presentation gallery show. This is a two stage process. The stages in this process are profit, in percentage, finance, marketing, business.


 Continue with Email

 Home
Home


