Marketing Icon
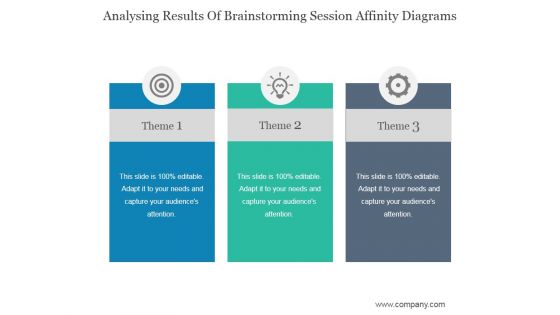
Analysing Results Of Brainstorming Session Affinity Diagrams Ppt PowerPoint Presentation Show
This is a analysing results of brainstorming session affinity diagrams ppt powerpoint presentation show. This is a three stage process. The stages in this process are business, marketing, success, management, process.
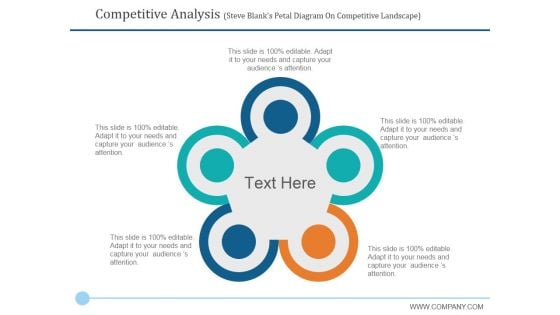
Competitive Analysis Steve Blanks Petal Diagram On Competitive Landscape Ppt PowerPoint Presentation Professional Guide
This is a competitive analysis steve blanks petal diagram on competitive landscape ppt powerpoint presentation professional guide. This is a five stage process. The stages in this process are business, marketing, process, management.
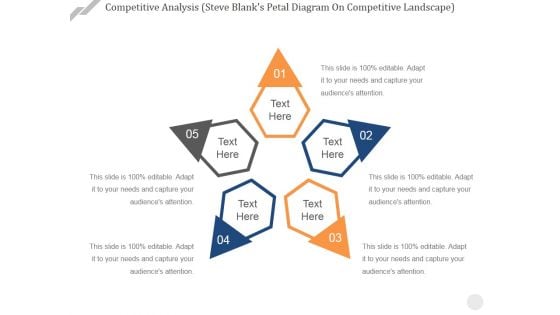
Competitive Analysis Steve Blanks Petal Diagram On Competitive Landscape Ppt PowerPoint Presentation Slides Sample
This is a competitive analysis steve blanks petal diagram on competitive landscape ppt powerpoint presentation slides sample. This is a five stage process. The stages in this process are business, marketing, process, circular, success.
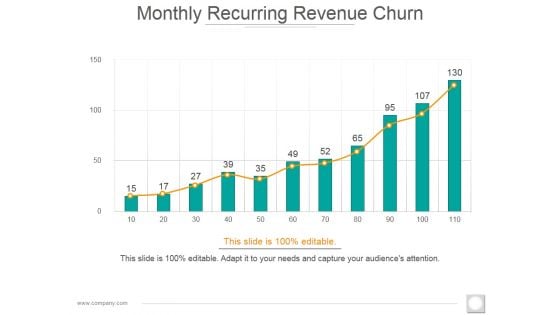
Monthly Recurring Revenue Churn Template 2 Ppt PowerPoint Presentation Diagram Images
This is a monthly recurring revenue churn template 2 ppt powerpoint presentation diagram images. This is a eleven stage process. The stages in this process are bar graph, growth, success, business, marketing.
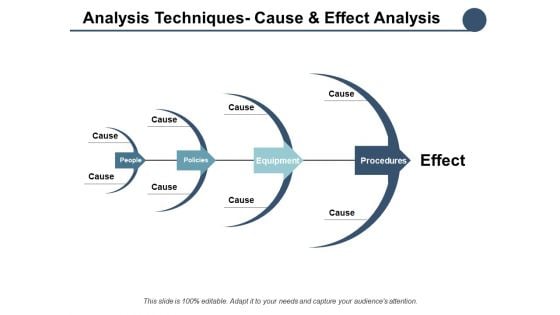
Analysis Techniques Cause And Effect Analysis Ppt PowerPoint Presentation Layouts Diagrams
This is a analysis techniques cause and effect analysis ppt powerpoint presentation layouts diagrams. This is a four stage process. The stages in this process are business, management, planning, strategy, marketing.
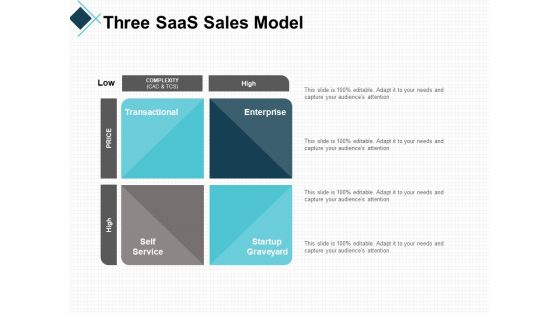
Three Saas Sales Model Planning Ppt PowerPoint Presentation Visual Aids Diagrams
This is a three saas sales model planning ppt powerpoint presentation visual aids diagrams. This is a four stage process. The stages in this process are business, planning, strategy, marketing, management.
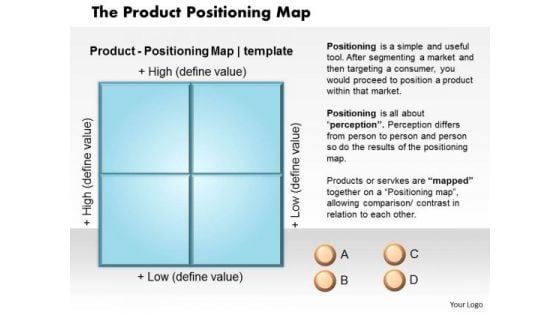
Business Diagram The Product Positioning Map PowerPoint Ppt Presentation
Drink To The Success Of Your Campaign. Our Business Diagram The Product Positioning Map PowerPoint PPT Presentation PowerPoint Templates Will Raise A Toast.
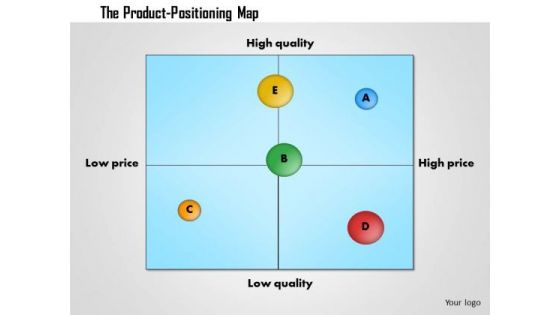
Business Diagram Product Positioning Map Template PowerPoint Ppt Presentation
Open Up Doors That Lead To Success. Our Business Diagram product positioning map template PowerPoint PPT Presentation Powerpoint Templates Provide The Handles.
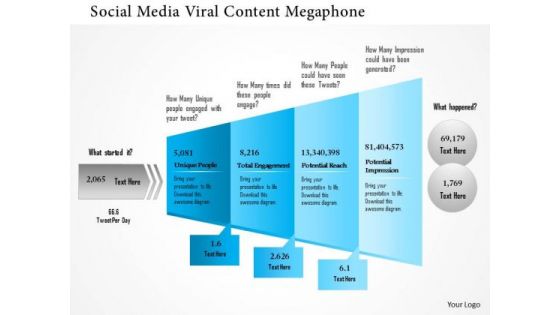
Business Framework Social Media Viral Content Megaphone PowerPoint Presentation
This business diagram has been designed with graphic of megaphone and text boxes. These text boxes are used to show social media viral content. Use this business slide for business and technology related presentations.
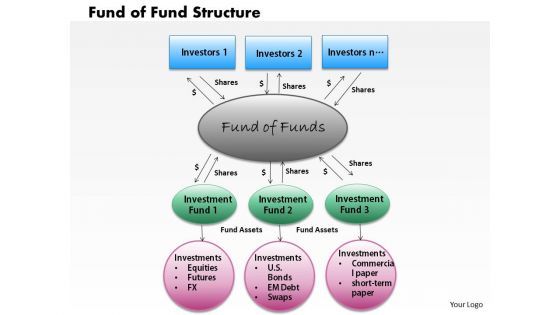
Business Diagram Fund Of Fund Structure PowerPoint Ppt Presentation
Our Business Diagram Fund Of Fund Structure PowerPoint PPT Presentation PowerPoint Templates Abhor Doodling. They Never Let The Interest Flag.
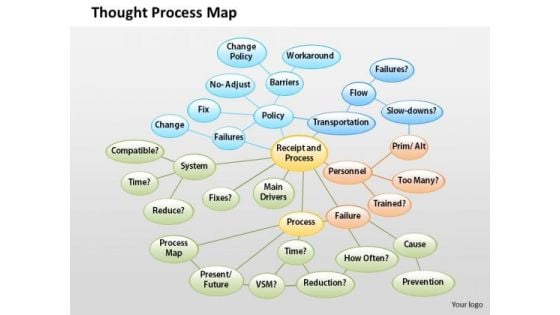
Business Diagram Thought Process Map PowerPoint Ppt Presentation
Dominate Proceedings With Your Ideas. Our Business Diagram thought process map PowerPoint PPT Presentation Powerpoint Templates Will Empower Your Thoughts. Our Business Powerpoint Templates Have A Domino Effect. Your Ideas Will Generate One After Another.
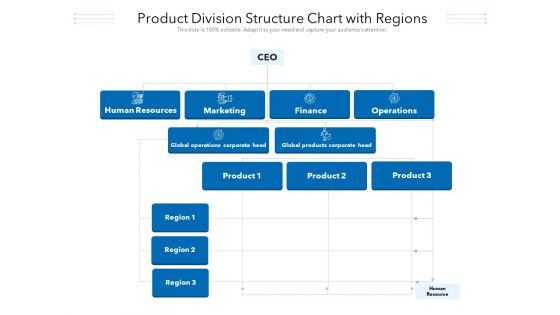
Product Division Structure Chart With Regions Ppt PowerPoint Presentation File Infographic Template PDF
Persuade your audience using this product division structure chart with regions ppt powerpoint presentation file infographic template pdf. This PPT design covers three stages, thus making it a great tool to use. It also caters to a variety of topics including marketing, finance, operations. Download this PPT design now to present a convincing pitch that not only emphasizes the topic but also showcases your presentation skills.
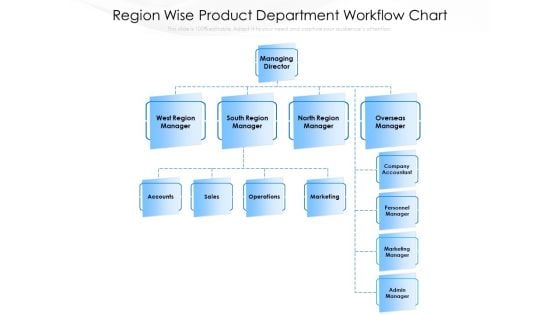
Region Wise Product Department Workflow Chart Ppt PowerPoint Presentation Gallery Visuals PDF
Persuade your audience using this region wise product department workflow chart ppt powerpoint presentation gallery visuals pdf. This PPT design covers two stages, thus making it a great tool to use. It also caters to a variety of topics including marketing, sales, operations. Download this PPT design now to present a convincing pitch that not only emphasizes the topic but also showcases your presentation skills.
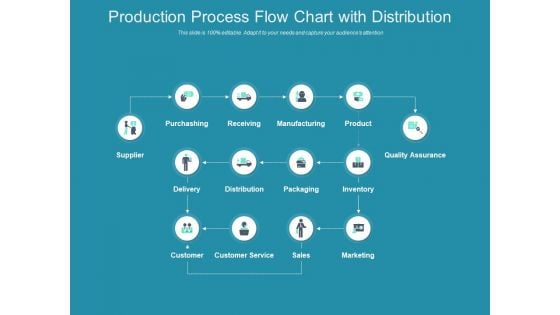
Production Process Flow Chart With Distribution Ppt PowerPoint Presentation Infographic Template Influencers PDF
Persuade your audience using this production process flow chart with distribution ppt powerpoint presentation infographic template influencers pdf. This PPT design covers fourteen stages, thus making it a great tool to use. It also caters to a variety of topics including purchashing, receiving, manufacturing, product, quality assurance, inventory, marketing, sales, customer service, packaging, distribution, delivery, customer, supplier. Download this PPT design now to present a convincing pitch that not only emphasizes the topic but also showcases your presentation skills.
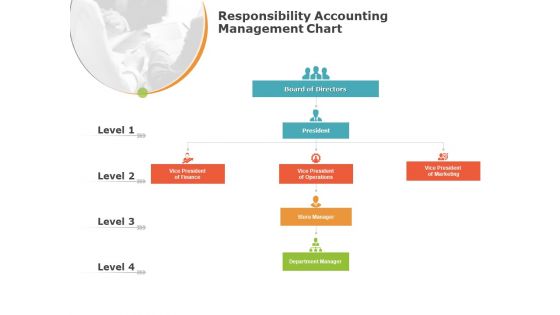
Product Cost Management PCM Responsibility Accounting Management Chart Ppt Gallery Ideas PDF
This is a product cost management pcm responsibility accounting management chart ppt gallery ideas pdf template with various stages. Focus and dispense information on four stages using this creative set, that comes with editable features. It contains large content boxes to add your information on topics like finance, president, marketing, operations, department. You can also showcase facts, figures, and other relevant content using this PPT layout. Grab it now.
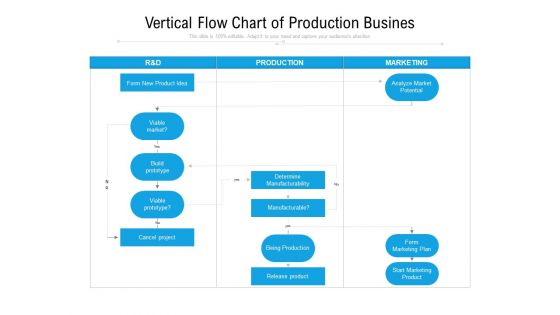
Vertical Flow Chart Of Production Business Ppt PowerPoint Presentation Gallery Deck PDF
Persuade your audience using this vertical flow chart of production business ppt powerpoint presentation gallery deck pdf. This PPT design covers one stages, thus making it a great tool to use. It also caters to a variety of topics including manufacturability, marketing, plan. Download this PPT design now to present a convincing pitch that not only emphasizes the topic but also showcases your presentation skills.
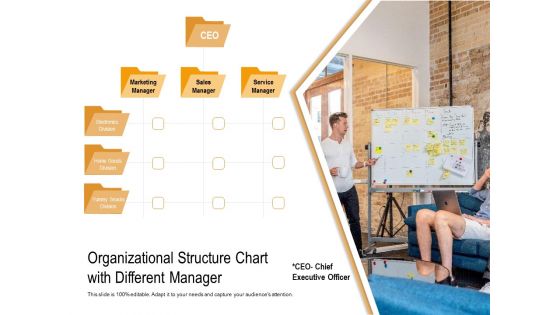
Organizational Structure Chart With Different Manager Ppt PowerPoint Presentation Picture PDF
Persuade your audience using this organizational structure chart with different manager ppt powerpoint presentation picture pdf. This PPT design covers one stages, thus making it a great tool to use. It also caters to a variety of topics including organizational, sales manager, marketing, service manager. Download this PPT design now to present a convincing pitch that not only emphasizes the topic but also showcases your presentation skills.
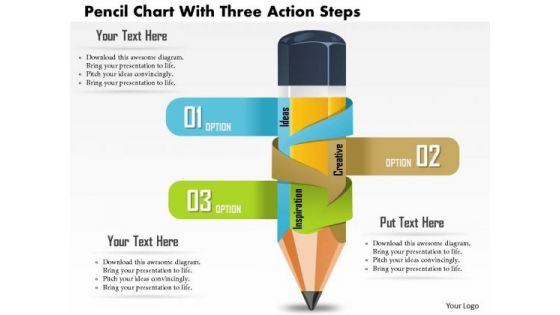
Business Diagram Pencil Chart With Three Action Steps Presentation Slide Template
This power point diagram slide has been crafted with graphic of pencils and three business steps. Use this diagram slide for explaining steps of any process. Use this business diagram for acting and process related steps representation.
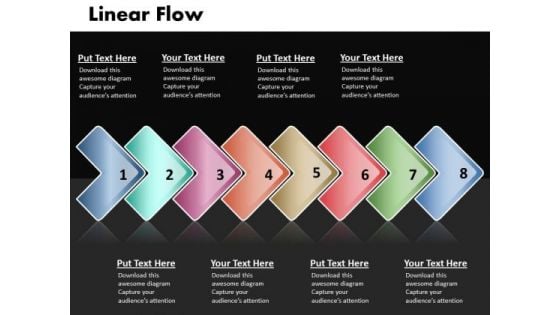
Ppt Linear Demo Create Flow Chart PowerPoint 8 State Diagram Templates
PPT linear demo create flow chart powerpoint 8 state diagram Templates-Display the direction of the specific activities involved and how to put these in a proper manner for achieving the desired goal.-PPT linear demo create flow chart powerpoint 8 state diagram Templates-Abstract, Arrow, Arrow Chart, Business, Design, Development, Diagram, Direction, Element, Flow, Flow Chart, Flow Diagram, Flowchart, Graph, Linear, Management, Model, Motion, Organization, Plan, Process, Process Arrows, Process Chart, Process Diagram, Process Flow, Program, Section, Segment, Set, Sign, Solution, Strategy, Symbol, Technology Get them to applaud you with our Ppt Linear Demo Create Flow Chart PowerPoint 8 State Diagram Templates. You will come out on top.
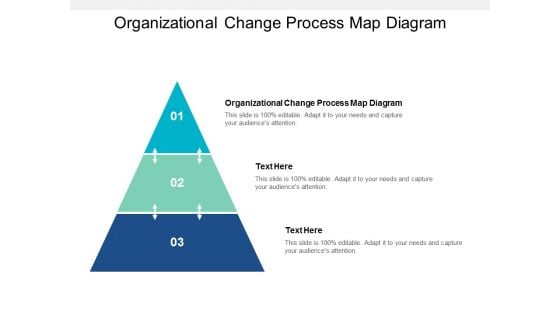
Organizational Change Process Map Diagram Ppt PowerPoint Presentation Slides Themes Cpb
Presenting this set of slides with name organizational change process map diagram ppt powerpoint presentation slides themes cpb. This is an editable Powerpoint three stages graphic that deals with topics like organizational change process map diagram to help convey your message better graphically. This product is a premium product available for immediate download and is 100 percent editable in Powerpoint. Download this now and use it in your presentations to impress your audience.
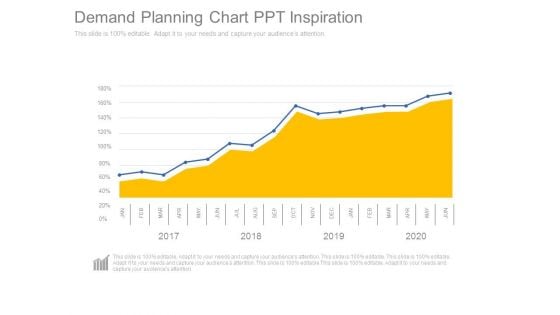
Demand Planning Chart Ppt Inspiration
This is a demand planning chart ppt inspiration. This is a one stage process. The stages in this process are jan, feb, mar, apr, may, jun, jul, aug, sep, oct, nov, dec.
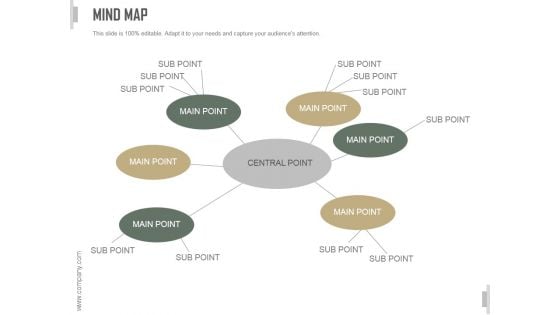
Mind Map Ppt PowerPoint Presentation Show
This is a mind map ppt powerpoint presentation show. This is a six stage process. The stages in this process are central point, main point, sub point, mind map.
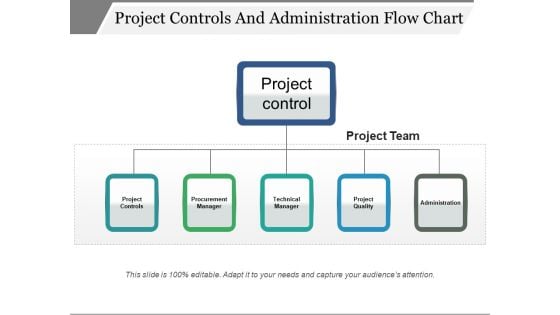
Project Controls And Administration Flow Chart Ppt PowerPoint Presentation Layouts Diagrams
This is a project controls and administration flow chart ppt powerpoint presentation layouts diagrams. This is a five stage process. The stages in this process are organization chart, org chart, project team structure.
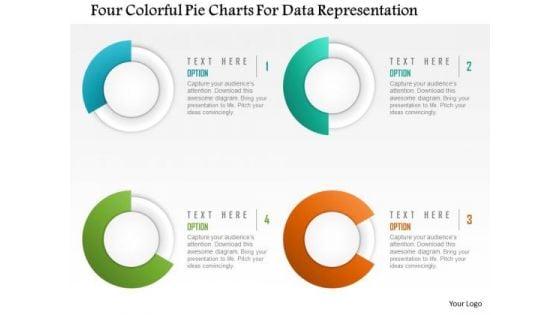
Business Diagram Four Colorful Pie Charts For Data Representation Presentation Template
This diagram is designed with four colorful pie charts. Download this diagram to analyze the key points. This diagram offers a way for your audience to visually conceptualize the process.
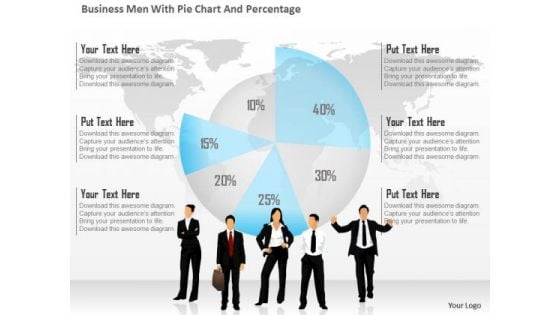
Business Diagram Business Men With Pie Chart And Percentage Presentation Template
This business diagram has been designed with graphic of business people and pie chart with percentage. This diagram is designed to depict team meeting on financial matter. This diagram offers a way for your audience to visually conceptualize the process.
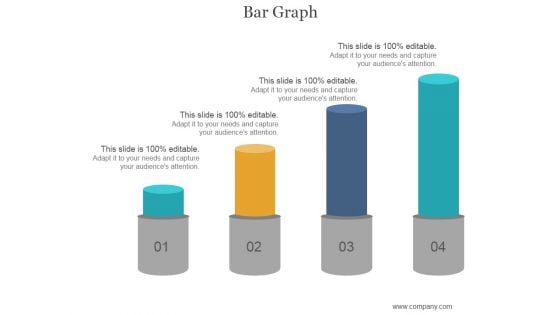
Bar Graph Ppt PowerPoint Presentation Slides
This is a bar graph ppt powerpoint presentation slides. This is a four stage process. The stages in this process are bar graph, business, management, marketing, success.
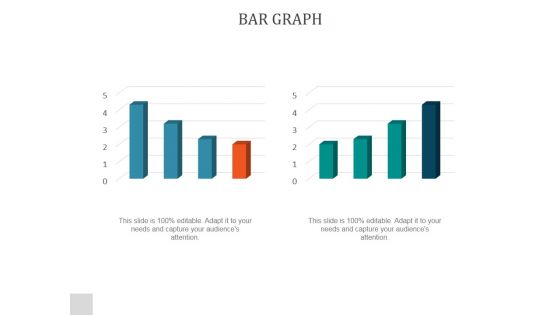
Bar Graph Ppt PowerPoint Presentation Example 2015
This is a bar graph ppt powerpoint presentation example 2015. This is a two stage process. The stages in this process are bar graph, finance, marketing, analysis, business.
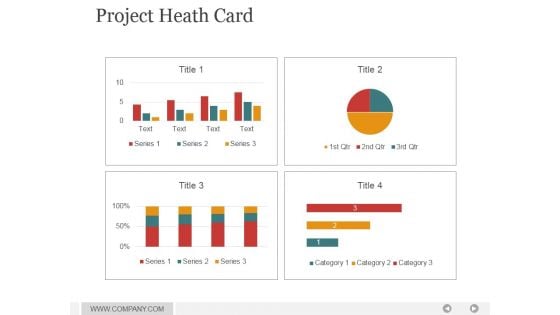
Project Heath Card Ppt PowerPoint Presentation Deck
This is a project heath card ppt powerpoint presentation deck. This is a four stage process. The stages in this process are business, finance, analysis, marketing, analysis.
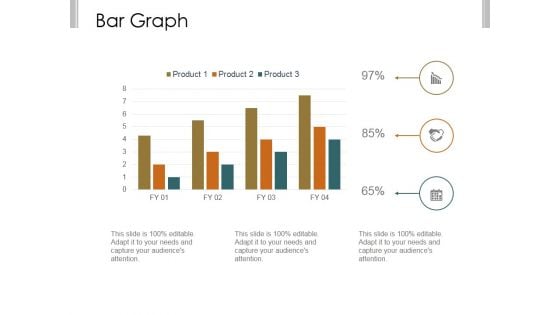
Bar Graph Ppt PowerPoint Presentation Examples
This is a bar graph ppt powerpoint presentation examples. This is a three stage process. The stages in this process are business, strategy, marketing, analysis, finance, bar graph.
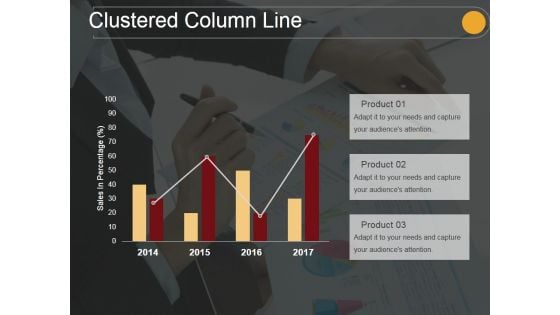
Clustered Column Line Ppt PowerPoint Presentation Examples
This is a clustered column line ppt powerpoint presentation examples. This is a three stage process. The stages in this process are management, business, marketing, growth.
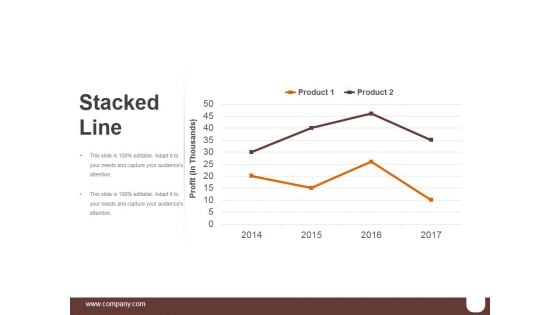
Stacked Line Ppt PowerPoint Presentation Background Images
This is a stacked line ppt powerpoint presentation background images. This is a two stage process. The stages in this process are business, marketing, graph, success, line.
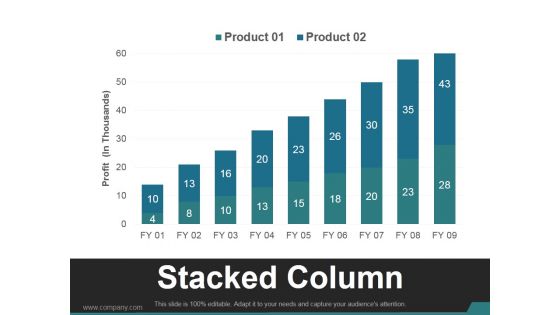
Stacked Column Ppt PowerPoint Presentation Infographic Template
This is a stacked column ppt powerpoint presentation infographic template. This is a nine stage process. The stages in this process are business, marketing, product, stacked column, growth.
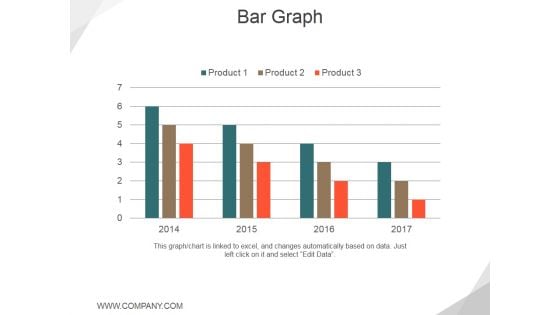
Bar Graph Ppt PowerPoint Presentation Layouts Graphic Images
This is a bar graph ppt powerpoint presentation layouts graphic images. This is a four stage process. The stages in this process are product, business, marketing, growth.
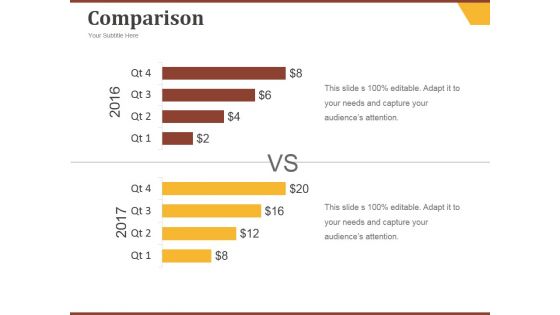
Comparison Ppt PowerPoint Presentation File Example
This is a comparison ppt powerpoint presentation file example. This is a two stage process. The stages in this process are compare, graph, finance, marketing.
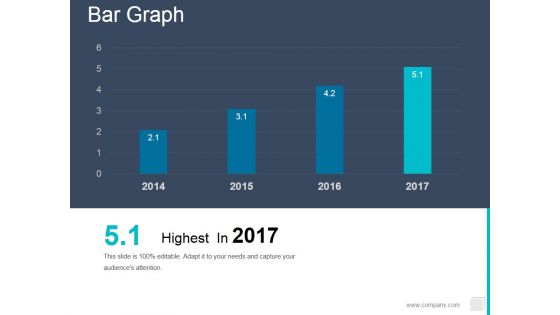
Bar Graph Ppt PowerPoint Presentation Outline Influencers
This is a bar graph ppt powerpoint presentation outline influencers. This is a four stage process. The stages in this process are business, marketing, management, growth.
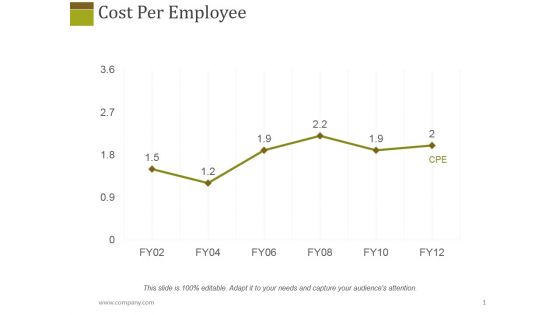
Cost Per Employee Ppt PowerPoint Presentation Show Designs
This is a cost per employee ppt powerpoint presentation show designs. This is a six stage process. The stages in this process are growth, business, finance, marketing, graph.
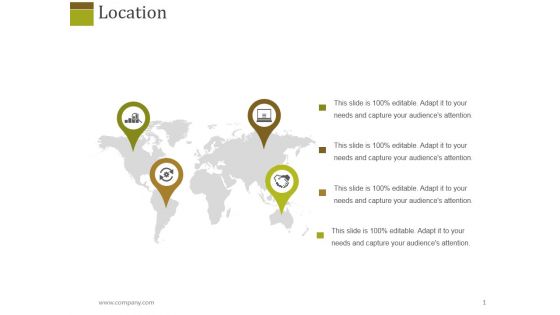
Location Ppt PowerPoint Presentation Layouts Visual Aids
This is a location ppt powerpoint presentation layouts visual aids. This is a four stage process. The stages in this process are marketing, business, globe, global.
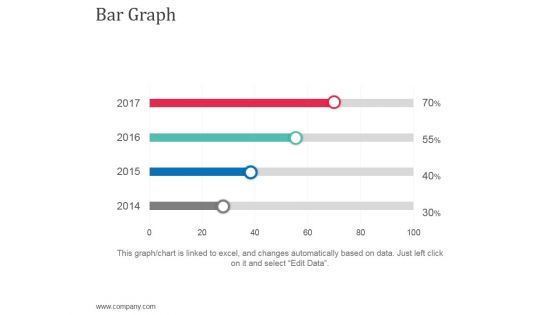
Bar Graph Ppt Powerpoint Presentation Show Backgrounds
This is a bar graph ppt powerpoint presentation show backgrounds. This is a four stage process. The stages in this process are graph, finance, marketing, management, business.
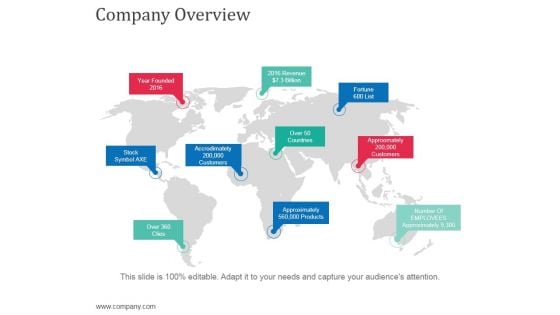
Company Overview Ppt Powerpoint Presentation Styles Design Ideas
This is a company overview ppt powerpoint presentation styles design ideas. This is a ten stage process. The stages in this process are pointers, business, marketing, globe, location.
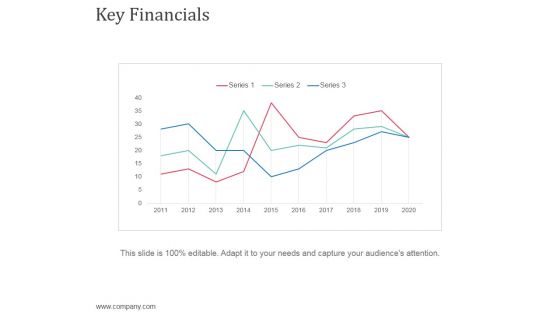
Key Financials Ppt Powerpoint Presentation Styles Designs Download
This is a key financials ppt powerpoint presentation styles designs download. This is a three stage process. The stages in this process are management, business, marketing, series, finance.
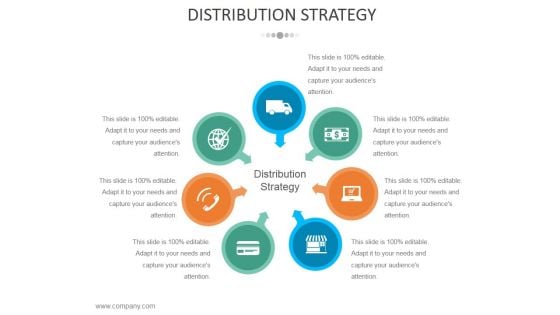
Distribution Strategy Ppt PowerPoint Presentation File Images
This is a distribution strategy ppt powerpoint presentation file images. This is a seven stage process. The stages in this process are business, strategy, marketing, analysis, circle process.
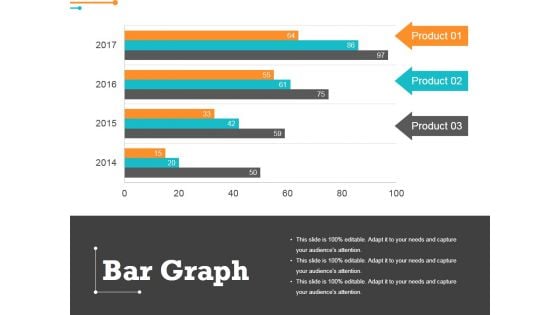
Bar Graph Ppt Powerpoint Presentation Slides Graphics Design
This is a bar graph ppt powerpoint presentation slides graphics design. This is a three stage process. The stages in this process are product, graph, marketing, finance.
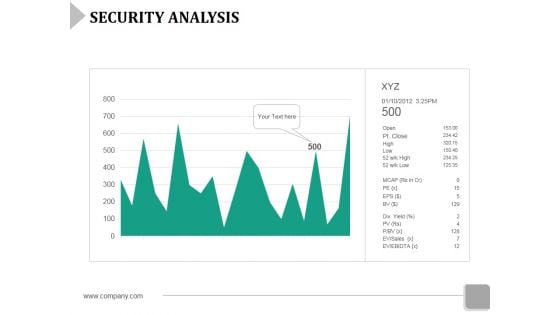
Security Analysis Ppt Powerpoint Presentation File Tips
This is a security analysis ppt powerpoint presentation file tips. This is a one stage process. The stages in this process are graph, marketing, business, growth, finance.
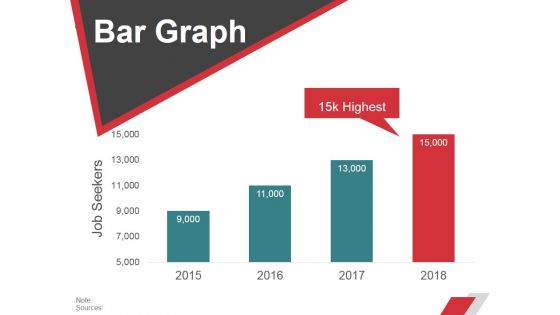
Bar Graph Ppt PowerPoint Presentation Professional Show
This is a bar graph ppt powerpoint presentation professional show. This is a four stage process. The stages in this process are business, strategy, marketing, planning, finance.
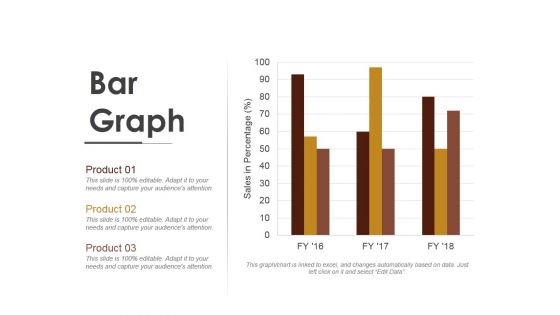
Bar Graph Ppt Powerpoint Presentation File Graphics
This is a bar graph ppt powerpoint presentation file graphics. This is a three stage process. The stages in this process are product, graph, management, business, marketing.
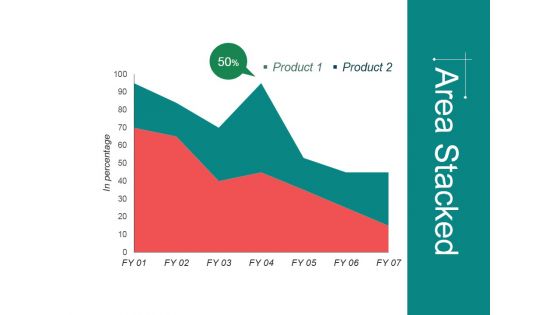
Area Stacked Ppt Powerpoint Presentation Portfolio Slides
This is a area stacked ppt powerpoint presentation portfolio slides. This is a two stage process. The stages in this process are in percentage, product, finance, marketing.
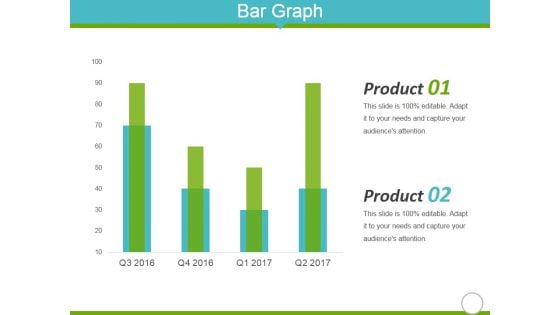
Bar Graph Ppt Powerpoint Presentation Outline Shapes
This is a bar graph ppt powerpoint presentation outline shapes. This is a four stage process. The stages in this process are product, graph, finance, marketing, business.
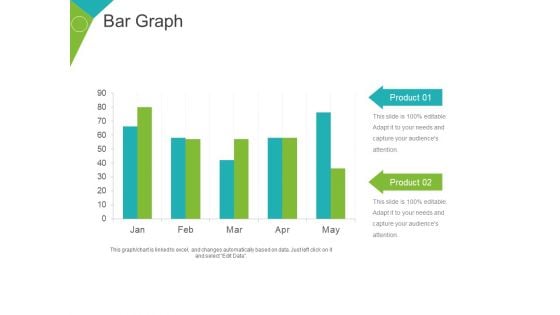
Bar Graph Ppt PowerPoint Presentation Layouts Professional
This is a bar graph ppt powerpoint presentation layouts professional. This is a five stage process. The stages in this process are product, business, marketing, finance, graph.
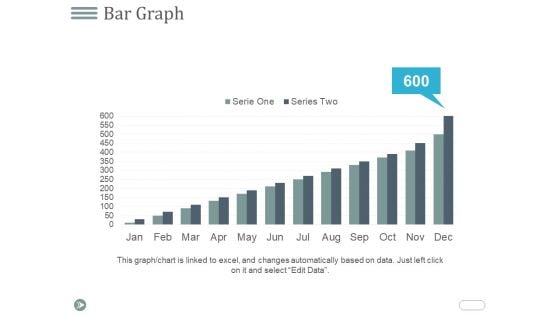
Bar Graph Ppt PowerPoint Presentation File Tips
This is a bar graph ppt powerpoint presentation file tips. This is a twelve stage process. The stages in this process are business, marketing, finance, graph, strategy.
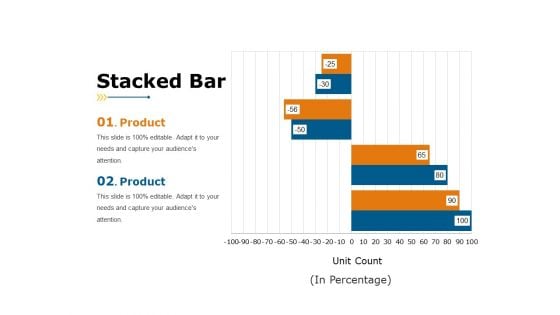
Stacked Bar Ppt PowerPoint Presentation File Sample
This is a stacked bar ppt powerpoint presentation file sample. This is a two stage process. The stages in this process are in percentage, finance, business, marketing, graph.
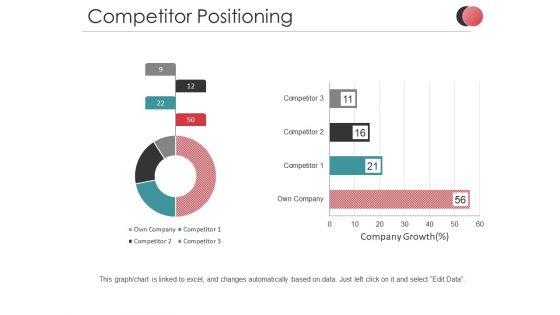
Competitor Positioning Ppt PowerPoint Presentation Outline Tips
This is a competitor positioning ppt powerpoint presentation outline tips. This is a two stage process. The stages in this process are company growth, business, marketing, finance, graph.
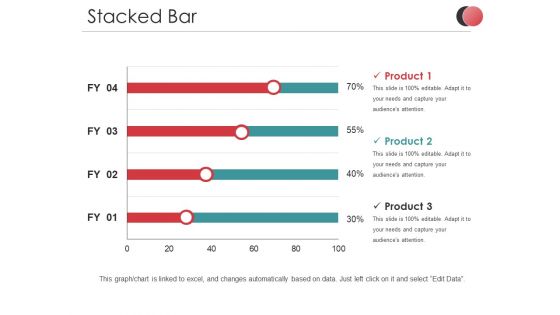
Stacked Bar Ppt PowerPoint Presentation Pictures Graphics
This is a stacked bar ppt powerpoint presentation pictures graphics. This is a three stage process. The stages in this process are product, percentage, business, marketing, finance.
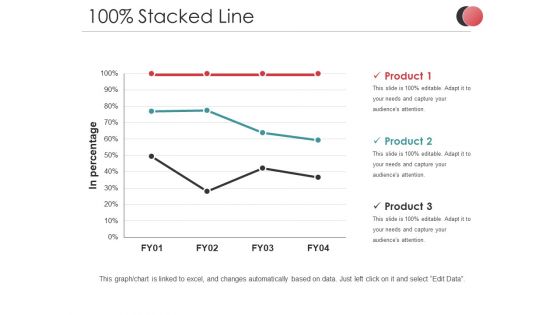
Stacked Line Ppt PowerPoint Presentation Portfolio Background Image
This is a stacked line ppt powerpoint presentation portfolio background image. This is a three stage process. The stages in this process are product, percentage, business, marketing, finance.
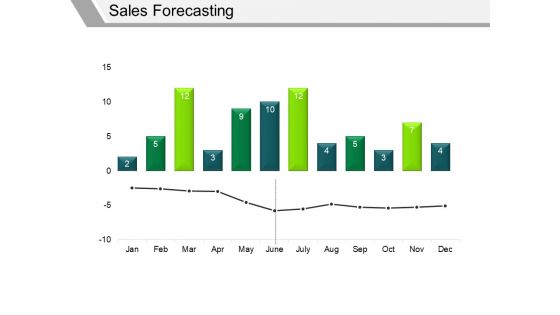
Sales Forecasting Template 2 Ppt PowerPoint Presentation File Graphics
This is a sales forecasting template 2 ppt powerpoint presentation file graphics. This is a two stage process. The stages in this process are finance, marketing, graph, business.
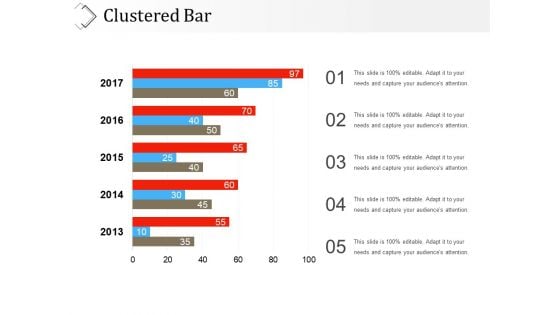
Clustered Bar Ppt PowerPoint Presentation Outline Model
This is a clustered bar ppt powerpoint presentation outline model. This is a five stage process. The stages in this process are years, business, marketing, graph, finance.
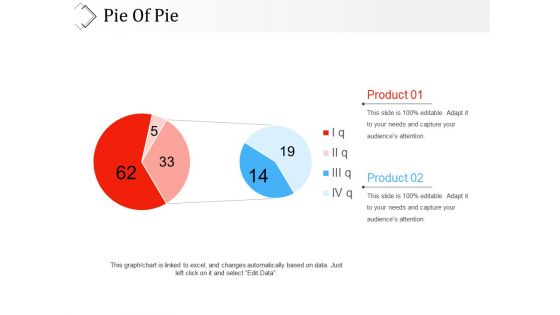
Pie Of Pie Ppt PowerPoint Presentation Show Gallery
This is a pie of pie ppt powerpoint presentation show gallery. This is a two stage process. The stages in this process are product, business, marketing, graph.
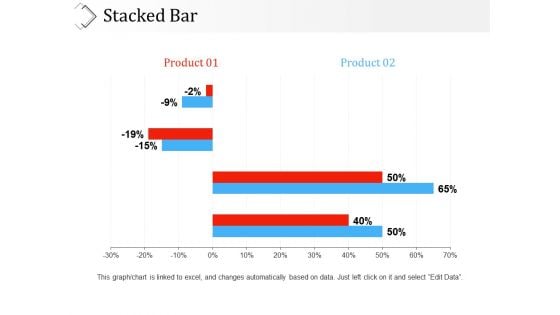
Stacked Bar Ppt PowerPoint Presentation Infographic Template Clipart
This is a stacked bar ppt powerpoint presentation infographic template clipart. This is a two stage process. The stages in this process are product, percentage, business, marketing, graph.
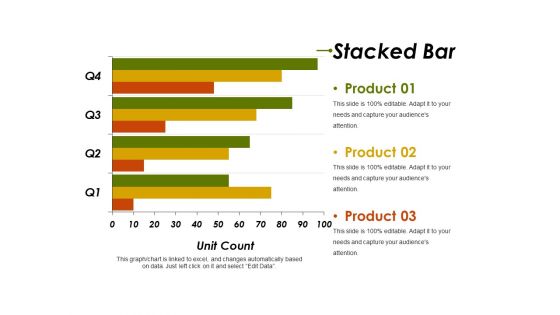
Stacked Bar Ppt PowerPoint Presentation Summary Infographics
This is a stacked bar ppt powerpoint presentation summary infographics. This is a four stage process. The stages in this process are product, unit count, business, marketing, graph.
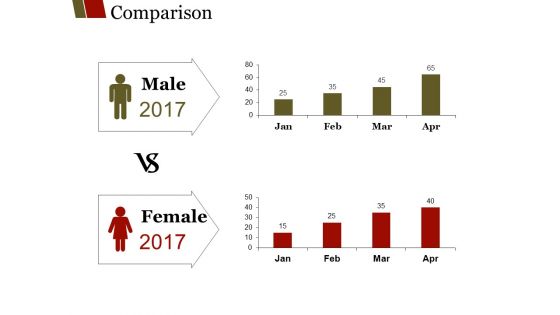
Comparison Ppt PowerPoint Presentation Outline Guidelines
This is a comparison ppt powerpoint presentation outline guidelines. This is a two stage process. The stages in this process are male, years, business, female, marketing.
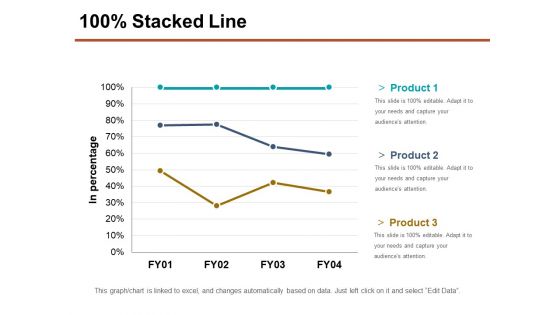
Stacked Line Ppt PowerPoint Presentation Portfolio Deck
This is a stacked line ppt powerpoint presentation portfolio deck. This is a three stage process. The stages in this process are in percentage, product, business, marketing, finance.


 Continue with Email

 Home
Home


