Marketing Management Dashboard
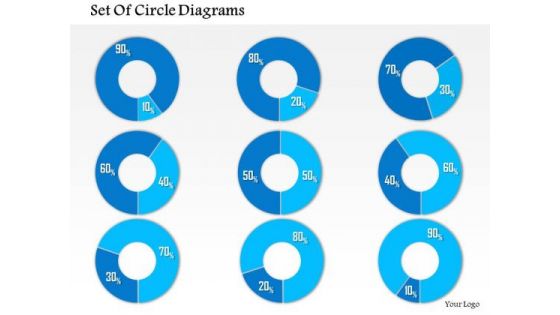
Business Framework 10 Percent To 90 Percent PowerPoint Presentation
This business diagram has been designed with graphic of multiple pie graphs. This diagram slide contains the concept of result analysis with percentage values. Use this diagram to present and compare data in an impressive manner
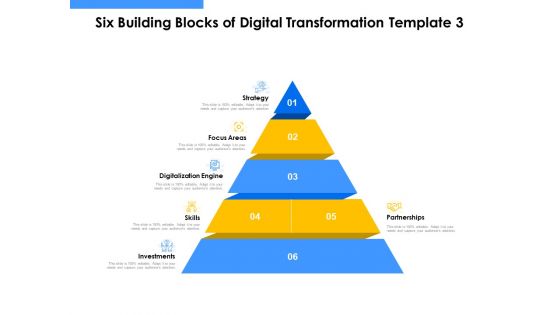
Employee Competency Matrix Six Building Blocks Of Digital Transformation Skills Ppt Professional Guidelines PDF
Presenting employee competency matrix six building blocks of digital transformation skills ppt professional guidelines pdf to provide visual cues and insights. Share and navigate important information on six stages that need your due attention. This template can be used to pitch topics like strategy and innovation, customer decision journey, process automation, data and analytics, technology, organization. In addition, this PPT design contains high-resolution images, graphics, etc, that are easily editable and available for immediate download.
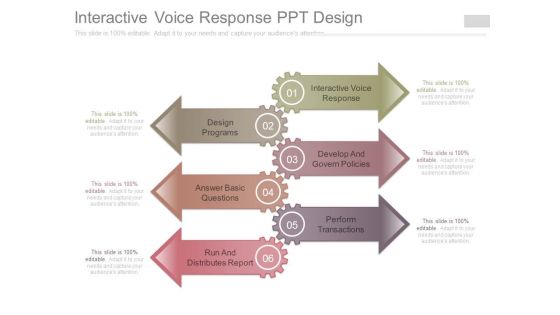
Interactive Voice Response Ppt Design
This is a interactive voice response ppt design. This is a six stage process. The stages in this process are new interactive voice response, design programs, develop and govern policies, perform transactions, answer basic questions, run and distributes report.
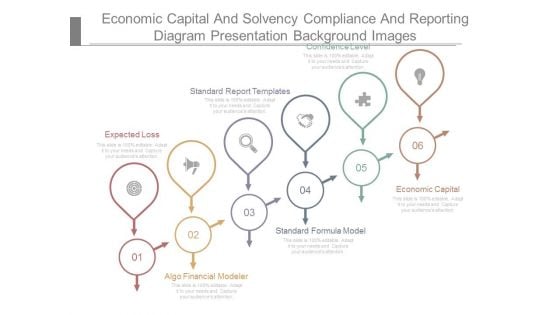
Economic Capital And Solvency Compliance And Reporting Diagram Presentation Background Images
This is a economic capital and solvency compliance and reporting diagram presentation background images. This is a six stage process. The stages in this process are confidence level, standard report templates, expected loss, algo financial modeler, standard formula model, economic capital.
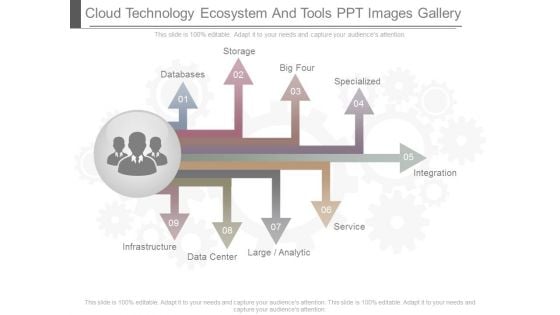
Cloud Technology Ecosystem And Tools Ppt Images Gallery
This is a cloud technology ecosystem and tools ppt images gallery. This is a nine stage process. The stages in this process are databases, storage, big four, specialized, infrastructure, data center, large analytic, service.
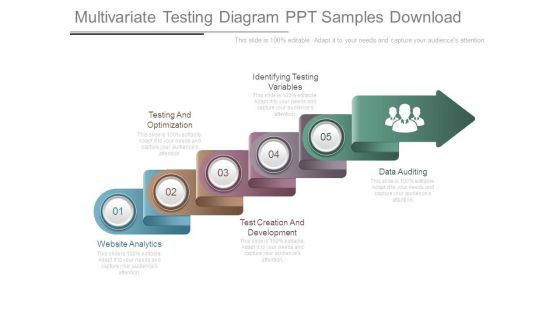
Multivariate Testing Diagram Ppt Samples Download
This is a multivariate testing diagram ppt samples download. This is a five stage process. The stages in this process are website analytics, testing and optimization, test creation and development, identifying testing variables, data auditing.
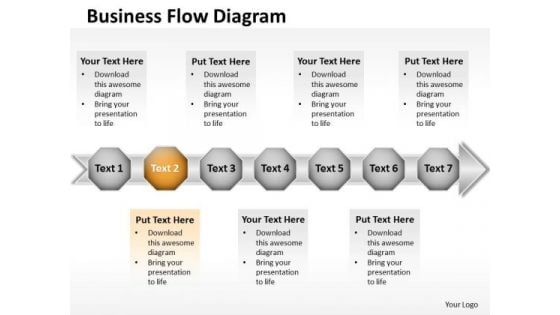
Ppt 7 Beeline Power Point Stage Business PowerPoint Theme Data Flow Diagram Templates
PPT 7 beeline power point stage business PowerPoint theme data flow diagram Templates-This PowerPoint Diagram shows Horizontal Demonstration through seven hexagonal boxes on the arrow pointing towards east direction signifying his completion of the process and leading towards success. This image has been conceived to enable you to emphatically communicate your ideas in your Business PPT presentations-PPT 7 beeline power point stage business PowerPoint theme data flow diagram Templates-arrow, art, assess, blue, business, chart, chevron, clip, clipart, colorful, compliance, corporate, design, development, diagram, flow, glossy, graphic, hierarchy, icon, illustration, implement, info graphic, levels, marketing, modern, plan, process, shape, shiny, square, stages, vector Influence decision makers with our Ppt 7 Beeline Power Point Stage Business PowerPoint Theme Data Flow Diagram Templates. Make sure your presentation gets the attention it deserves.
Quality Cost Report Comparison Ppt PowerPoint Presentation Icon Background Designs
This is a quality cost report comparison ppt powerpoint presentation icon background designs. This is a two stage process. The stages in this process are compare, business, table, marketing, strategy.
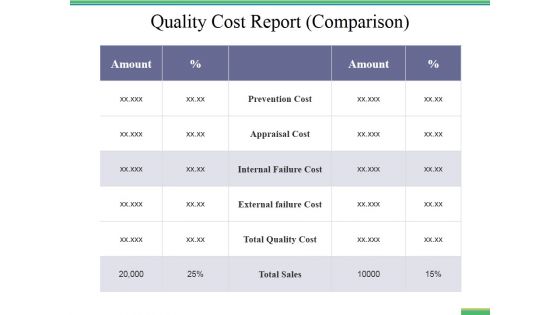
Quality Cost Report Comparison Ppt PowerPoint Presentation Infographic Template
This is a quality cost report comparison ppt powerpoint presentation infographic template. This is a two stage process. The stages in this process are business, comparison, marketing, amount, strategy.
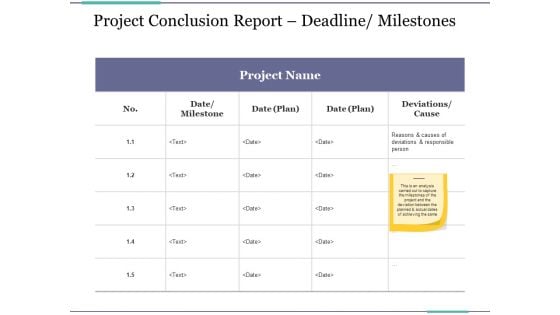
Project Conclusion Report Deadline Milestones Ppt PowerPoint Presentation Infographics Topics
This is a project conclusion report deadline milestones ppt powerpoint presentation infographics topics. This is a five stage process. The stages in this process are business, date milestone, deviations cause, marketing, planning.
Data Backup On Cloud Vector Icon Ppt PowerPoint Presentation Summary Graphic Images PDF
Presenting this set of slides with name data backup on cloud vector icon ppt powerpoint presentation summary graphic images pdf. This is a three stage process. The stages in this process are data backup on cloud vector icon. This is a completely editable PowerPoint presentation and is available for immediate download. Download now and impress your audience.
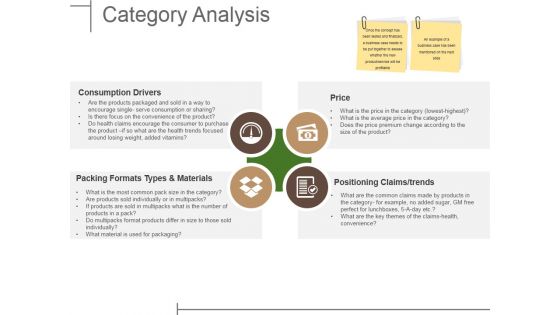
Category Analysis Ppt PowerPoint Presentation Show Tips
This is a category analysis ppt powerpoint presentation show tips. This is a four stage process. The stages in this process are consumption drivers, price, packing formats types and materials, positioning claims trends.
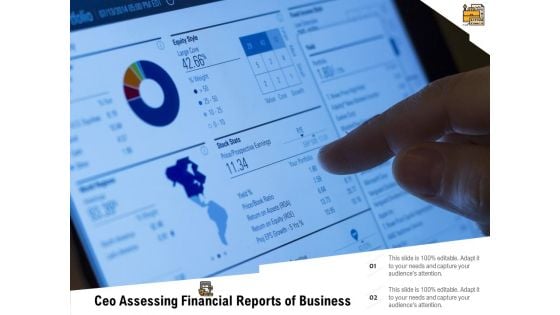
Ceo Assessing Financial Reports Of Business Ppt PowerPoint Presentation Gallery Inspiration PDF
Presenting ceo assessing financial reports of business ppt powerpoint presentation gallery inspiration pdf to dispense important information. This template comprises two stages. It also presents valuable insights into the topics including ceo assessing financial reports of business. This is a completely customizable PowerPoint theme that can be put to use immediately. So, download it and address the topic impactfully.
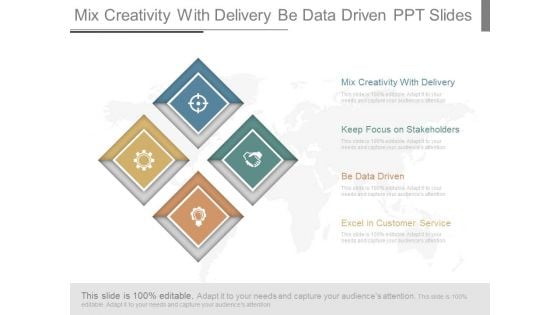
Mix Creativity With Delivery Be Data Driven Ppt Slides
This is a mix creativity with delivery be data driven ppt slides. This is a four stage process. The stages in this process are marketing, business, success, geographical.
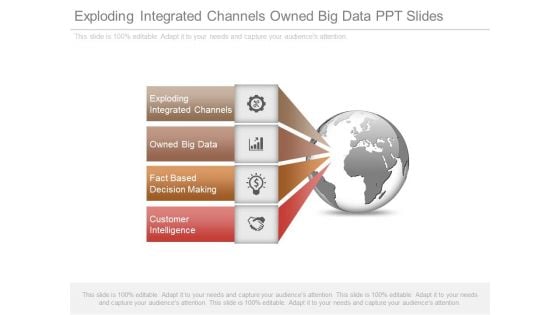
Exploding Integrated Channels Owned Big Data Ppt Slides
This is a exploding integrated channels owned big data ppt slides. This is a four stage process. The stages in this process are globe, marketing, business.
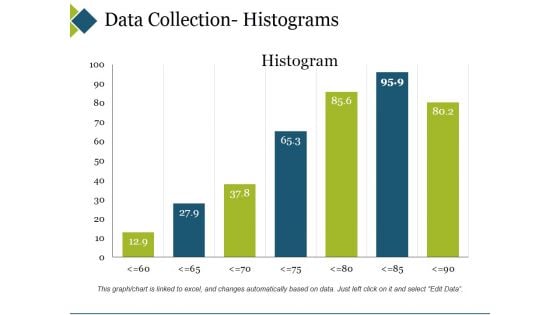
Data Collection Histograms Ppt PowerPoint Presentation Show Topics
This is a data collection histograms ppt powerpoint presentation show topics. This is a seven stage process. The stages in this process are business, marketing, histogram, finance, graph.
Cash Flow Statement Kpis Template 1 Ppt PowerPoint Presentation Icon Elements
This is a cash flow statement kpis template 1 ppt powerpoint presentation icon elements. This is a four stage process. The stages in this process are operations, financing activities, investing activities, net increase in cash.
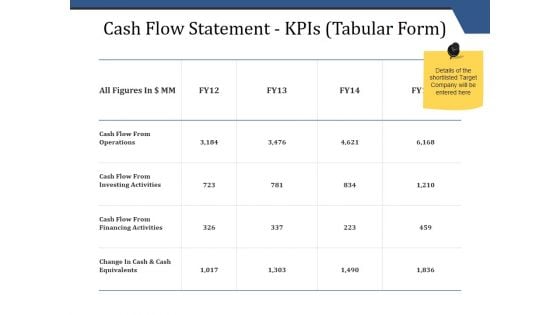
Cash Flow Statement Kpis Tabular Form Ppt PowerPoint Presentation Inspiration Master Slide
This is a cash flow statement kpis tabular form ppt powerpoint presentation inspiration master slide. This is a four stage process. The stages in this process are operations, financing activities, investing activities, net increase in cash.
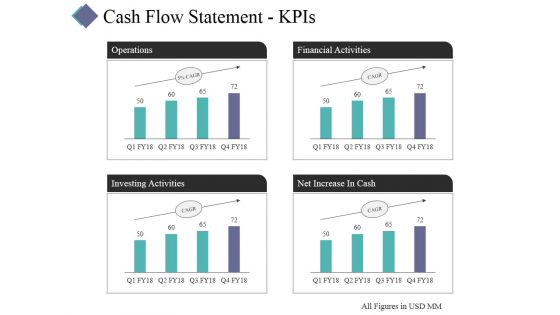
Cash Flow Statement Kpis Template 2 Ppt PowerPoint Presentation Layouts Visuals
This is a cash flow statement kpis template 2 ppt powerpoint presentation layouts visuals. This is a four stage process. The stages in this process are operations, financial activities, investing activities, net increase in cash.
P And L Kpis Template 2 Ppt PowerPoint Presentation Summary Icon
This is a p and l kpis template 2 ppt powerpoint presentation summary icon. This is a four stage process. The stages in this process are revenue, cogs, operating profit, net profit.
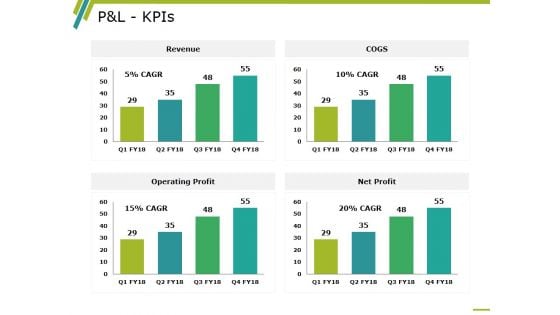
P And L Kpis Template 2 Ppt PowerPoint Presentation Professional Information
This is a p and l kpis template 2 ppt powerpoint presentation professional information. This is a four stage process. The stages in this process are revenue, operating profit, cogs, net profit, business.
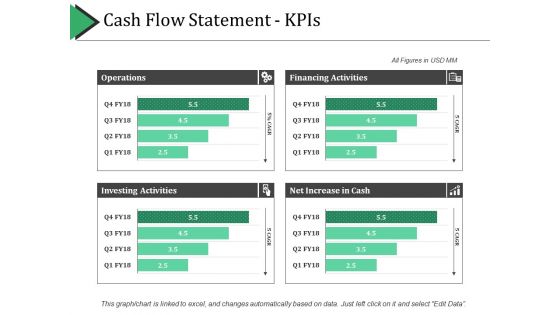
Cash Flow Statement - Kpis Ppt PowerPoint Presentation Layouts Graphics Template
This is a cash flow statement - kpis ppt powerpoint presentation layouts graphics template. This is a four stage process. The stages in this process are operations, financing activities, investing activities, net increase in cash.
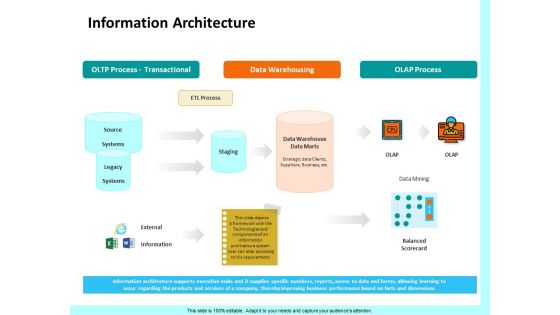
Firm Productivity Administration Information Architecture Ppt PowerPoint Presentation Gallery Skills PDF
Presenting this set of slides with name firm productivity administration information architecture ppt powerpoint presentation gallery skills pdf. This is a three stage process. The stages in this process are oltp process transactional, data warehousing, olap process, etl process, external, information, balanced scorecard, data mining, data warehouse data marts. This is a completely editable PowerPoint presentation and is available for immediate download. Download now and impress your audience.
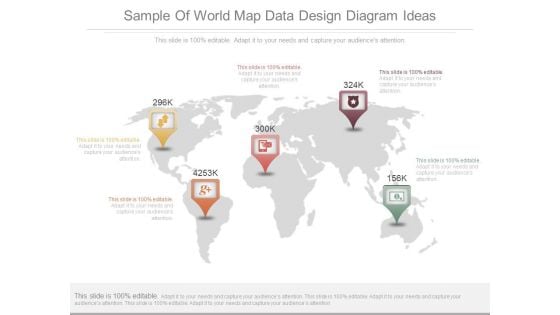
Sample Of World Map Data Design Diagram Ideas
This is a sample of world map data design diagram ideas. This is a five stage process. The stages in this process are map, location, indicator, marketing, geographical, business.
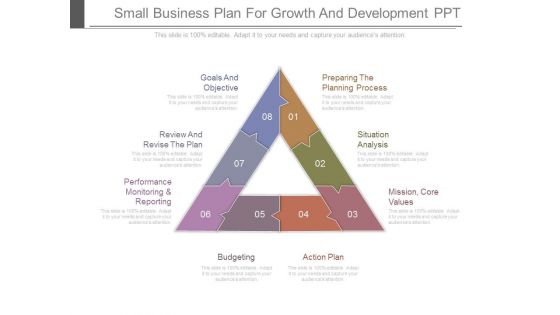
Small Business Plan For Growth And Development Ppt
This is a small business plan for growth and development ppt. This is a eight stage process. The stages in this process are preparing the planning process, situation analysis, mission, core values, action plan, budgeting, performance monitoring and reporting, review and revise the plan, goals and objective.\n\n
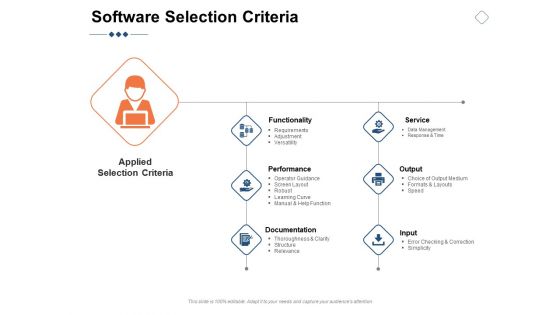
Software Selection Criteria Functionality Ppt PowerPoint Presentation Infographic Template Slides
Presenting this set of slides with name software selection criteria functionality ppt powerpoint presentation infographic template slides. This is a six stage process. The stages in this process are functionality, performance, documentation, service, output. This is a completely editable PowerPoint presentation and is available for immediate download. Download now and impress your audience.
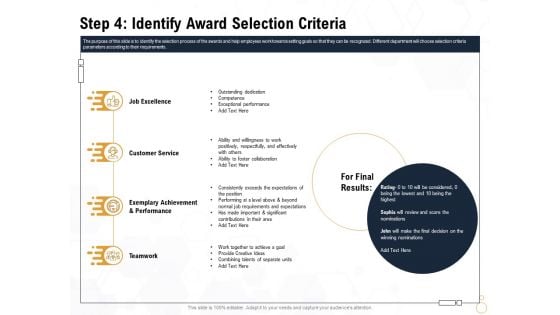
Star Employee Step 4 Identify Award Selection Criteria Infographics PDF
Presenting this set of slides with name star employee step 4 identify award selection criteria infographics pdf. This is a four stage process. The stages in this process are job excellence, customer service, teamwork, exemplary achievement and performance. This is a completely editable PowerPoint presentation and is available for immediate download. Download now and impress your audience.
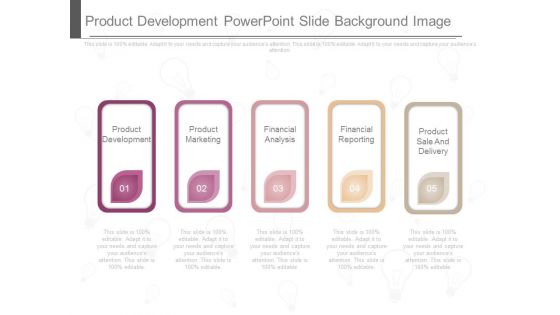
Product Development Powerpoint Slide Background Image
This is a product development powerpoint slide background image. This is a five stage process. The stages in this process are product development, product marketing, financial analysis, financial reporting, product sale and delivery.

Streamline Commercial Lending Diagram Ppt Examples
This is a streamline commercial lending diagram ppt examples. This is a six stage process. The stages in this process are origination, structuring, due diligence, reporting, marketing, credit analysis.
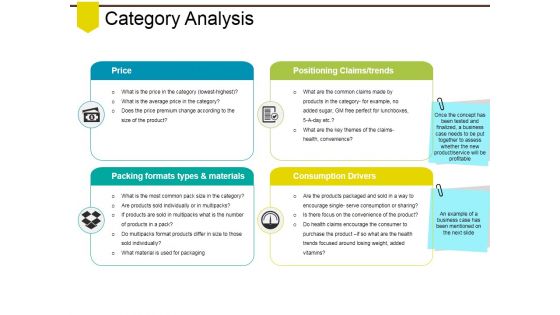
Category Analysis Ppt PowerPoint Presentation File Inspiration
This is a category analysis ppt powerpoint presentation file inspiration. This is a three stage process. The stages in this process are price, positioning claims trends, packing formats types and materials, consumption drivers.
Important Notes Ppt PowerPoint Presentation Gallery Introduction
This is a important notes ppt powerpoint presentation gallery introduction. This is a five stage process. The stages in this process are business, strategy, analysis, pretention, post it.
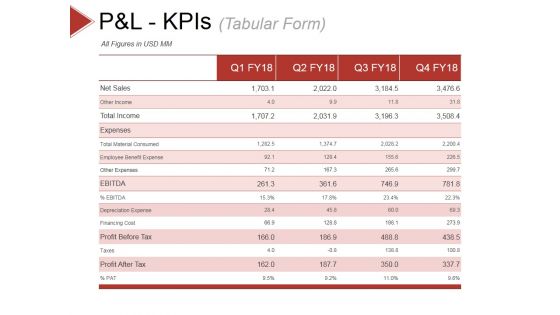
P And L Kpis Template 1 Ppt PowerPoint Presentation Slides Show
This is a p and l kpis template 1 ppt powerpoint presentation slides show. This is a four stage process. The stages in this process are other income, total income, expenses, other expenses, depreciation expense.
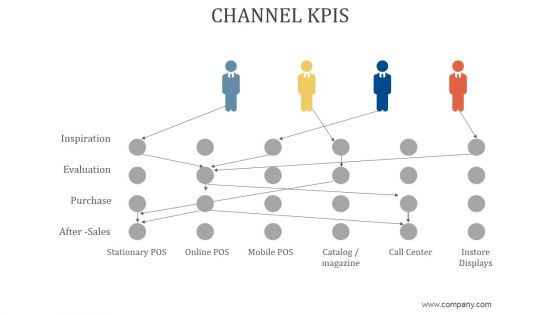
Channel Kpis Ppt PowerPoint Presentation Ideas
This is a channel kpis ppt powerpoint presentation ideas. This is a four stage process. The stages in this process are inspiration, evaluation, purchase, after sales, catalog magazine, call center, instore displays.
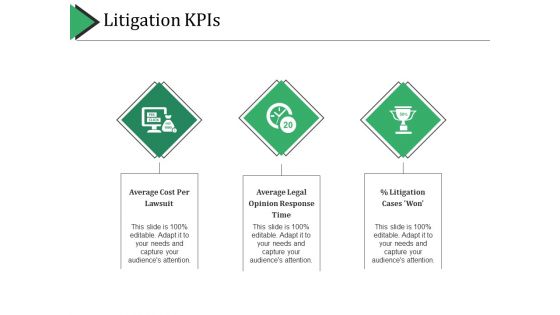
Litigation Kpis Ppt PowerPoint Presentation Styles Aids
This is a litigation kpis ppt powerpoint presentation styles aids. This is a three stage process. The stages in this process are average cost per lawsuit, average legal opinion response time.
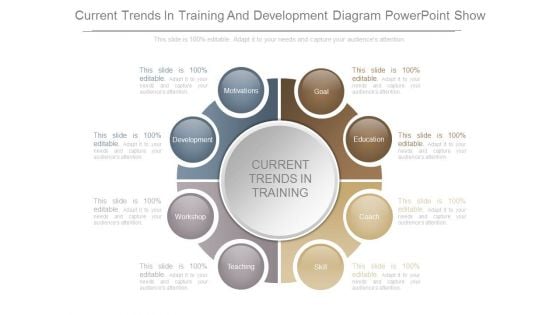
Current Trends In Training And Development Diagram Powerpoint Show
This is a current trends in training and development diagram powerpoint show. This is a eight stage process. The stages in this process are current trends in training, goal, education, coach, skill, teaching, workshop, development, motivations.
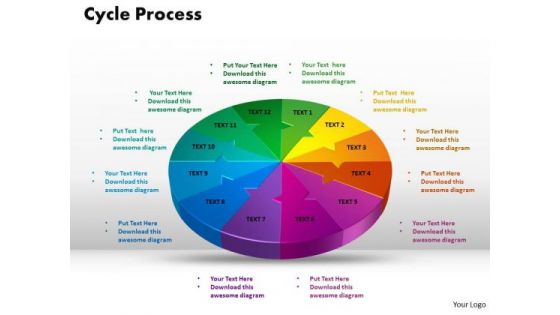
PowerPoint Backgrounds Cycle Process Graphic Ppt Designs
PowerPoint Backgrounds Cycle Process Graphic PPT Designs-Represent your data on this diagram in a meaningful and concise manner. This Cycle Process Diagram is type of graphic organizer that shows how items are related to one another in time-oriented cycle.-PowerPoint Backgrounds Cycle Process Graphic PPT Designs Empowerment is the aim of our PowerPoint Backgrounds Cycle Process Graphic Ppt Designs. They put their all behind your thoughts.
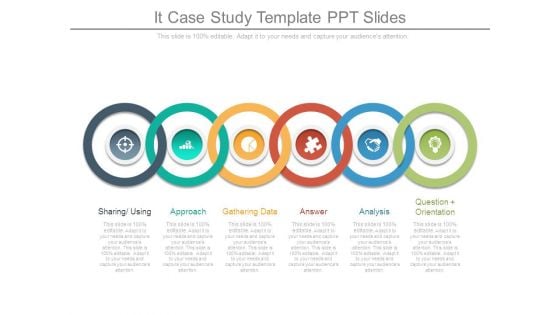
It Case Study Template Ppt Slides
This is a it case study template ppt slides. This is a six stage process. The stages in this process are sharing using, approach, gathering data, answer, analysis, question orientation.

Slice Data With Apples Sliced PowerPoint Slides And Ppt Diagram Templates
Slice Data With Apples Sliced PowerPoint Slides And PPT Diagram Templates-These high quality, editable pre-designed powerpoint slides have been carefully created by our professional team to help you impress your audience. Each graphic in every slide is vector based and is 100% editable in powerpoint. Each and every property of any slide - color, size, shading etc can be modified to build an effective powerpoint presentation. Use these slides to convey complex business concepts in a simplified manner. Any text can be entered at any point in the powerpoint slide. Simply DOWNLOAD, TYPE and PRESENT! Branch out with our Slice Data With Apples Sliced PowerPoint Slides And Ppt Diagram Templates. You will come out on top.
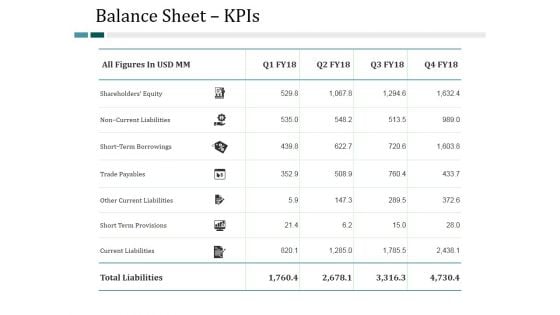
Balance Sheet Kpis Ppt PowerPoint Presentation Slides Slideshow
This is a balance sheet kpis ppt powerpoint presentation slides slideshow. This is a four stage process. The stages in this process are shareholders equity, non current liabilities, short term borrowings, trade payables, other current liabilities, short term provisions, current liabilities.
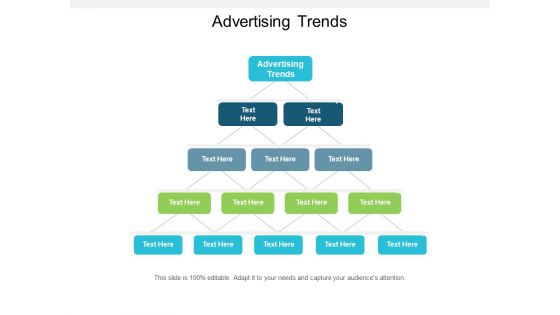
Advertising Trends Ppt PowerPoint Presentation Model Display Cpb
This is a advertising trends ppt powerpoint presentation model display cpb. This is a five stage process. The stages in this process are advertising trends.
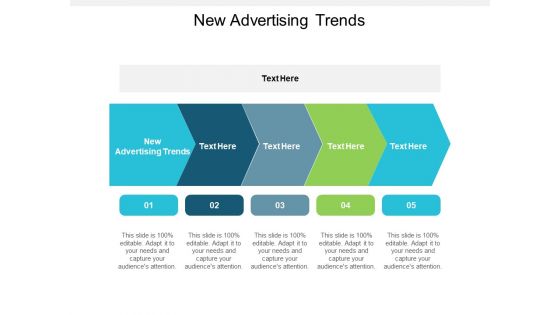
New Advertising Trends Ppt PowerPoint Presentation Gallery Graphic Tips Cpb
This is a new advertising trends ppt powerpoint presentation gallery graphic tips cpb. This is a five stage process. The stages in this process are new advertising trends.
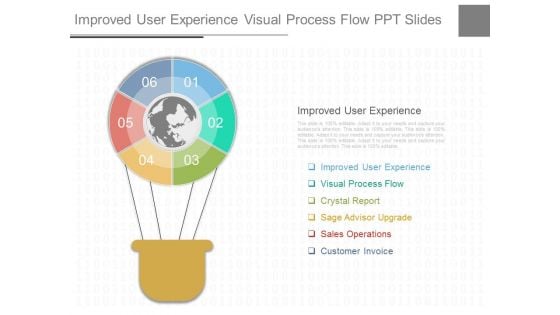
Improved User Experience Visual Process Flow Ppt Slides
This is a improved user experience visual process flow ppt slides. This is a six stage process. The stages in this process are improved user experience, visual process flow, crystal report, sage advisor upgrade, sales operations, customer invoice.
Business Diagram Zigzag Process Diagram With Six Icons Presentation Template
This business diagram has been designed with graphic of six staged zigzag process diagram and icons. This slide depicts concept of data and process flow. Use this diagram for data display in business presentations.
Business Analysis Report Vector Icon Ppt PowerPoint Presentation Outline Deck PDF
Presenting this set of slides with name business analysis report vector icon ppt powerpoint presentation outline deck pdf. This is a three stage process. The stages in this process are business analysis report vector icon. This is a completely editable PowerPoint presentation and is available for immediate download. Download now and impress your audience.
Financial Analysis Report Vector Icon Ppt PowerPoint Presentation Slides Designs Download PDF
Presenting this set of slides with name financial analysis report vector icon ppt powerpoint presentation slides designs download pdf. This is a three stage process. The stages in this process are financial analysis report vector icon. This is a completely editable PowerPoint presentation and is available for immediate download. Download now and impress your audience.
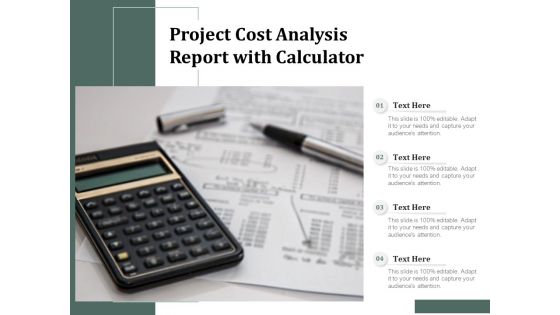
Project Cost Analysis Report With Calculator Ppt PowerPoint Presentation Ideas Summary PDF
Presenting this set of slides with name project cost analysis report with calculator ppt powerpoint presentation ideas summary pdf. This is a four stage process. The stages in this process are project cost analysis report with calculator. This is a completely editable PowerPoint presentation and is available for immediate download. Download now and impress your audience.
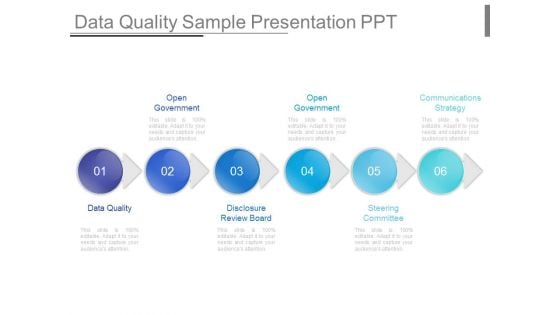
Data Quality Sample Presentation Ppt
This is a data quality sample presentation ppt. This is a six stage process. The stages in this process are open government, data quality, open government, communications strategy, disclosure review board, steering committee.
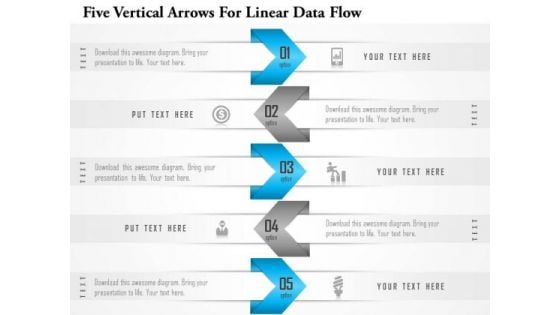
Business Diagram Five Vertical Arrows For Linear Data Flow Presentation Template
This business diagram displays graphic of five vertical arrows linear data flow. This business slide contains the concept of business data representation. Use this diagram to build professional presentation for your viewers.
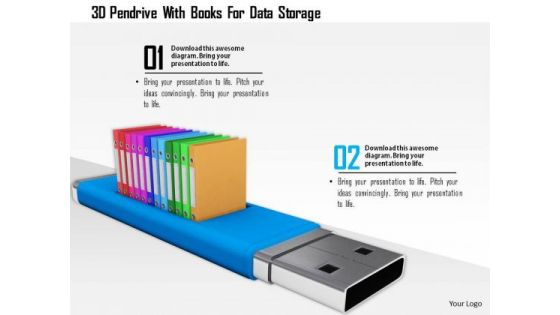
Stock Photo 3d Pendrive With Books For Data Storage PowerPoint Slide
This power point image template has been crafted with graphic of 3d pen drive and books. This PPT contains the concept of data storage. Use this image for your business data storage related topics in any presentations.
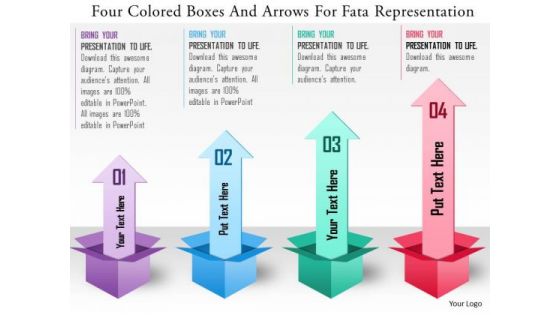
Business Diagram Four Colored Boxes And Arrows For Data Representation Presentation Template
Graphic of four colored boxes and arrows has been used to design this power point template. This PPT contains the concept of data representation. Use this PPT for data technology related topics in any presentation.
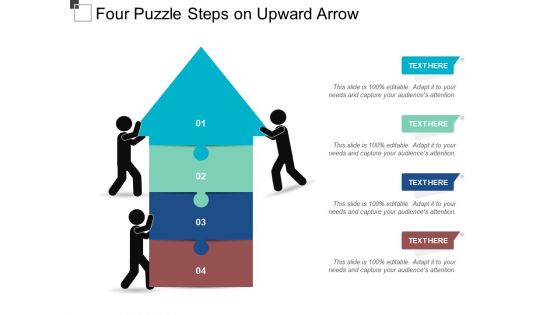
Four Puzzle Steps On Upward Arrow Ppt PowerPoint Presentation Pictures Outline
This is a four puzzle steps on upward arrow ppt powerpoint presentation pictures outline. This is a four stage process. The stages in this process are growth, upward trends, uptrends, upward arrow.

Advertisement Administration Content Ppt Layouts Background PDF
Presenting advertisement administration content ppt layouts background pdf to provide visual cues and insights. Share and navigate important information on eight stages that need your due attention. This template can be used to pitch topics like capture marketing insights, connect customers, build strong brands, shape market offerings, deliver value, communicate value, create successful long term growth, kpis and dashboard. In addition, this PPT design contains high-resolution images, graphics, etc, that are easily editable and available for immediate download.
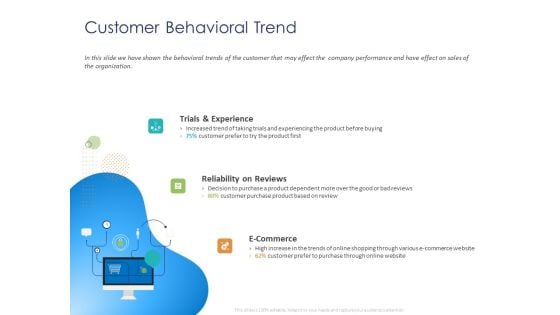
Customer 360 Overview Customer Behavioral Trend Ppt File Tips PDF
Presenting this set of slides with name customer 360 overview customer behavioral trend ppt file tips pdf. This is a three stage process. The stages in this process are trials and experience, reliability on reviews, e commerce, customer purchase, product based review. This is a completely editable PowerPoint presentation and is available for immediate download. Download now and impress your audience.
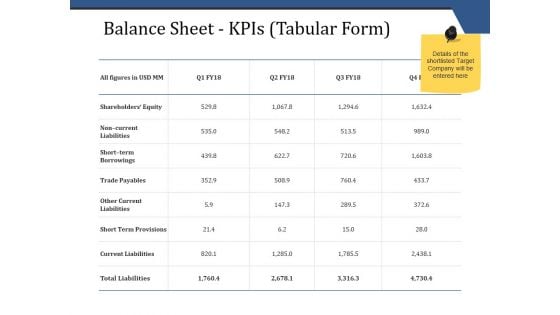
Balance Sheet Kpis Tabular Form Template 1 Ppt PowerPoint Presentation Infographics Picture
This is a balance sheet kpis tabular form template 1 ppt powerpoint presentation infographics picture. This is a four stage process. The stages in this process are business, finance, analysis, investment, strategy.
Balance Sheet Kpis Tabular Form Template 2 Ppt PowerPoint Presentation Icon Clipart
This is a balance sheet kpis tabular form template 2 ppt powerpoint presentation icon clipart. This is a four stage process. The stages in this process are business, finance, analysis, investment, strategy.
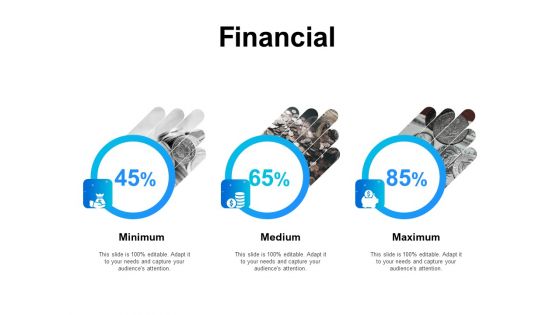
Gap Analysis Budgeting And Reporting Financial Ppt PowerPoint Presentation Portfolio Example File PDF
Presenting this set of slides with name gap analysis budgeting and reporting financial ppt powerpoint presentation portfolio example file pdf. This is a three stage process. The stages in this process are minimum, medium, maximum. This is a completely editable PowerPoint presentation and is available for immediate download. Download now and impress your audience.
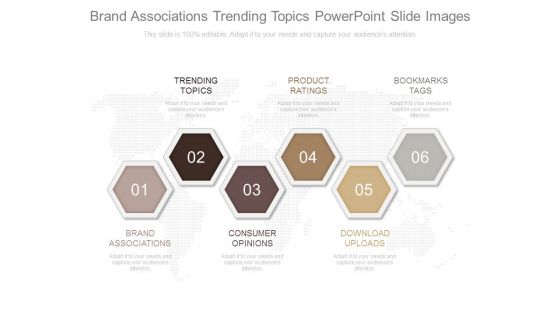
Brand Associations Trending Topics Powerpoint Slide Images
This is a brand associations trending topics powerpoint slide images. This is a six stage process. The stages in this process are trending topics, product ratings, bookmarks tags, brand associations, consumer opinions, download uploads.
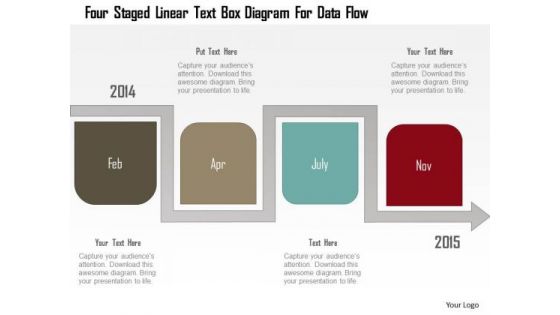
Business Diagram Four Staged Linear Text Box Diagram For Data Flow PowerPoint Template
Four staged linear text box diagram has been used to craft this power point template. This PPT diagram contains the concept of data flow representation. Use this PPT for education and technology related topics.
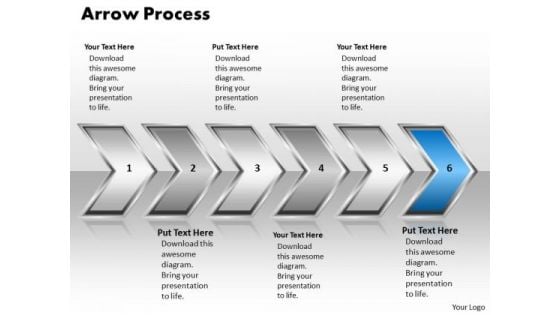
Ppt Pointing Even Arrow Forging Process PowerPoint Slides 6 Stage Templates
PPT pointing even arrow forging process powerpoint slides 6 stage Templates-Use this Arrow based PowerPoint Diagram to elaborate six interconnected issues which performs their actions in cycle. This diagram provides an overview of the interactions of different factors in a company. You can easily collaborate this PowerPoint diagram with colleagues to create detailed process diagrams and use them as a key element in streamlining your processes. -PPT pointing even arrow forging process powerpoint slides 6 stage Templates-Aim, Arrow, Arrowheads, Badge, Border, Click, Connection, Curve, Design, Direction, Download, Element, Fuchsia, Icon, Illustration, Indicator, Internet, Magenta, Mark, Object, Orientation, Pointer, Shadow, Shape, Sign Our Ppt Pointing Even Arrow Forging Process PowerPoint Slides 6 Stage Templates have a far reaching effect. Your ideas will bring cheer to many.
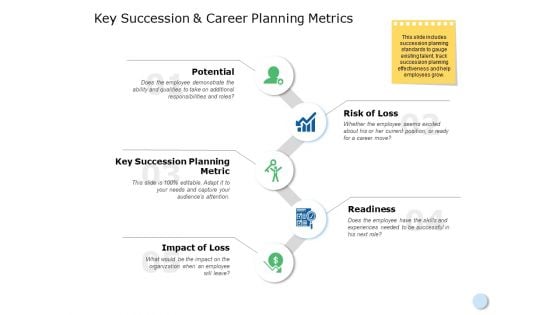
Key Succession And Career Planning Metrics Ppt PowerPoint Presentation Portfolio Slides
This is a key succession and career planning metrics ppt powerpoint presentation portfolio slides. This is a five stage process. The stages in this process are risk of loss, readiness, potential, planning, strategy.


 Continue with Email

 Home
Home


