Marketing Management Dashboard
Customer Satisfaction Metrics With NPR And Customer Effort Score Ppt Icon Graphics Tutorials PDF
The slide carries a dashboard to evaluate customer experience for bringing advancement in existing products. Various KPIs used to measure customer experience are NPS Net Promoter Score and CES Customer Effort Score. Showcasing this set of slides titled Customer Satisfaction Metrics With NPR And Customer Effort Score Ppt Icon Graphics Tutorials PDF. The topics addressed in these templates are Net Promoter Score, Customer Effort Score, Product Service Reviews. All the content presented in this PPT design is completely editable. Download it and make adjustments in color, background, font etc. as per your unique business setting.
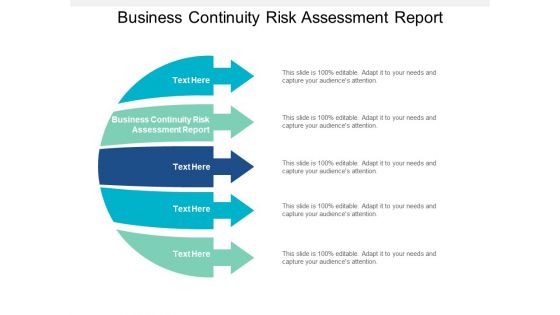
Business Continuity Risk Assessment Report Ppt PowerPoint Presentation Infographics Ideas Cpb
This is a business continuity risk assessment report ppt powerpoint presentation infographics ideas cpb. This is a five stage process. The stages in this process are business continuity risk assessment report.
Media Buying KPI Reporting Ppt PowerPoint Presentation Styles Visual Aids Cpb
This is a media buying kpi reporting ppt powerpoint presentation styles visual aids cpb. This is a two stage process. The stages in this process are media buying kpi reporting.
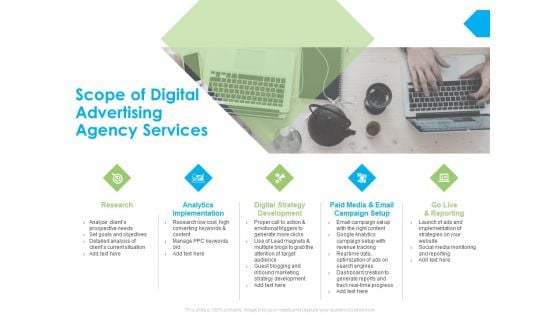
Scope Of Digital Advertising Agency Services Ppt PowerPoint Presentation Slides Vector
Presenting this set of slides with name scope of digital advertising agency services ppt powerpoint presentation slides vector. This is a five stage process. The stages in this process are research, analytics, implementation, digital strategy development, paid media and email campaign setup, go live and reporting. This is a completely editable PowerPoint presentation and is available for immediate download. Download now and impress your audience.
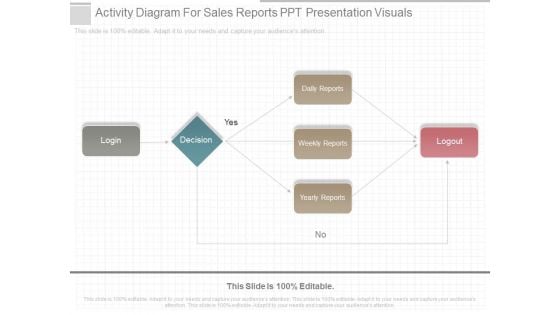
Activity Diagram For Sales Reports Ppt Presentation Visuals
This is a activity diagram for sales reports ppt presentation visuals. This is a one stage process. The stages in this process are login, decision, dally reports, weekly reports, yearly reports, logout, yes, no.

Nature Balance And Protection Powerpoint Templates
The above template contains diagram of circles Infographic. This diagram slide may be used to display nature, balance and protection concepts. Earn appreciation with our slide and your listeners will surely laud your performance.
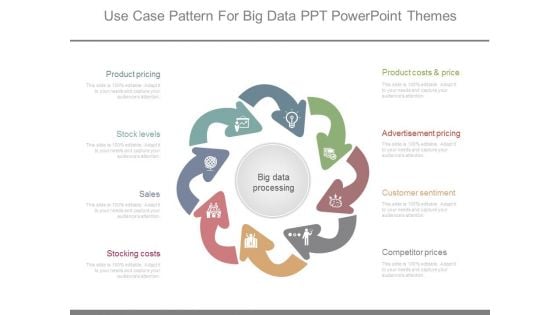
Use Case Pattern For Big Data Ppt Powerpoint Themes
This is a use case pattern for big data ppt powerpoint themes. This is a eight stage process. The stages in this process are product pricing, stock levels, sales, stocking costs, competitor prices, customer sentiment, advertisement pricing, product costs and price, big data processing.
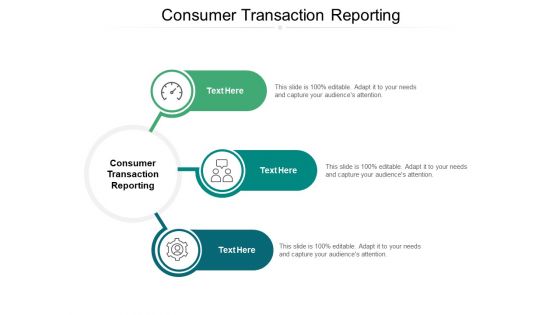
Consumer Transaction Reporting Ppt PowerPoint Presentation Infographic Template Graphics Template Cpb
Presenting this set of slides with name consumer transaction reporting ppt powerpoint presentation infographic template graphics template cpb. This is a three stage process. The stages in this process are consumer transaction reporting. This is a completely editable PowerPoint presentation and is available for immediate download. Download now and impress your audience.
Business Financial Trend Vector Icon Ppt PowerPoint Presentation Visual Aids Infographics
Presenting this set of slides with name business financial trend vector icon ppt powerpoint presentation visual aids infographics. This is a two stage process. The stages in this process are financial strategy, business financial trend, business strategy. This is a completely editable PowerPoint presentation and is available for immediate download. Download now and impress your audience.

Bar Graph Showing Negative Trend Ppt PowerPoint Presentation Summary Master Slide
Presenting this set of slides with name bar graph showing negative trend ppt powerpoint presentation summary master slide. This is a one stage process. The stages in this process are bar graph showing negative trend. This is a completely editable PowerPoint presentation and is available for immediate download. Download now and impress your audience.
Downward Arrow Trend Graph Vector Icon Ppt PowerPoint Presentation Pictures PDF
Presenting this set of slides with name downward arrow trend graph vector icon ppt powerpoint presentation pictures pdf. This is a three stage process. The stages in this process are downward arrow trend graph vector icon. This is a completely editable PowerPoint presentation and is available for immediate download. Download now and impress your audience.
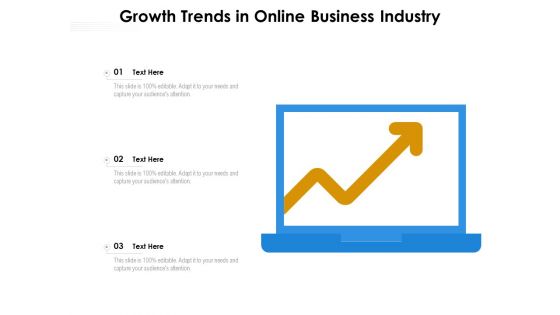
Growth Trends In Online Business Industry Ppt PowerPoint Presentation Infographics Infographics PDF
Presenting this set of slides with name growth trends in online business industry ppt powerpoint presentation infographics infographics pdf. This is a three stage process. The stages in this process are growth trends in online business industry. This is a completely editable PowerPoint presentation and is available for immediate download. Download now and impress your audience.

Territory Sales Trends Chart Image Ppt PowerPoint Presentation Visual Aids Infographic Template PDF
Presenting this set of slides with name territory sales trends chart image ppt powerpoint presentation visual aids infographic template pdf. This is a three stage process. The stages in this process are territory sales trends chart image. This is a completely editable PowerPoint presentation and is available for immediate download. Download now and impress your audience.
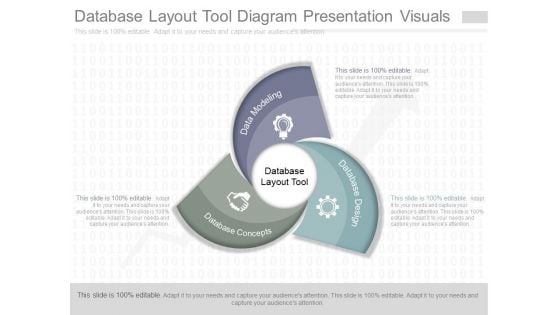
Database Layout Tool Diagram Presentation Visuals
This is a database layout tool diagram presentation visuals. This is a three stage process. The stages in this process are database concepts, data modeling, database layout tool, database design.\n\n\n\n
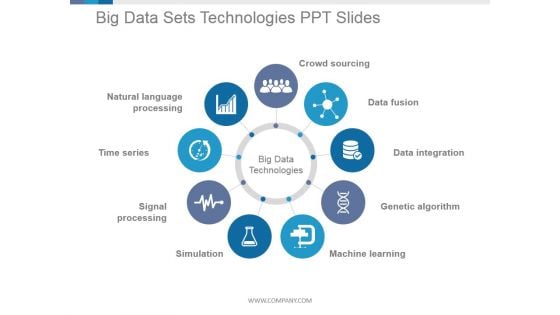
Big Data Sets Technologies Ppt PowerPoint Presentation Portfolio
This is a big data sets technologies ppt powerpoint presentation portfolio. This is a nine stage process. The stages in this process are big data technologies, crowd sourcing, data fusion, data integration, genetic algorithm, machine learning.

Key Findings Business Report Example Powerpoint Slide Clipart
This is a key findings business report example powerpoint slide clipart. This is a four stage process. The stages in this process are key problem, objective of the report, main findings and conclusions, crucial recommendations.
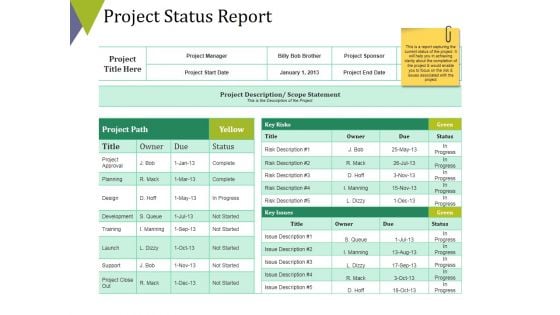
Project Status Report Ppt PowerPoint Presentation Portfolio Pictures
This is a project status report ppt powerpoint presentation portfolio pictures. This is a two stage process. The stages in this process are owner, due, project status report, business, table.

Sales Status Report Technology Innovation Ppt PowerPoint Presentation Slides Sample
This is a sales status report technology innovation ppt powerpoint presentation slides sample. This is a five stage process. The stages in this process are sales status report, technology innovation.

Website SEO Audit Report Financial Ppt Summary Design Templates PDF
This is a website seo audit report financial ppt summary design templates pdf template with various stages. Focus and dispense information on three stages using this creative set, that comes with editable features. It contains large content boxes to add your information on topics like minimum, medium, maximum. You can also showcase facts, figures, and other relevant content using this PPT layout. Grab it now.
Core Components Of Strategic Brand Administration Rebranding Performance Tracking Graphics PDF
This slide provides information regarding rebranding performance tracking dashboard in order to track renewed brand. It includes details about total spent, total link clicks, total conversations, etc. Want to ace your presentation in front of a live audience Our Core Components Of Strategic Brand Administration Rebranding Performance Tracking Graphics PDF can help you do that by engaging all the users towards you.. Slidegeeks experts have put their efforts and expertise into creating these impeccable powerpoint presentations so that you can communicate your ideas clearly. Moreover, all the templates are customizable, and easy-to-edit and downloadable. Use these for both personal and commercial use.
Business Diagram Five Icons With Circle Diagram Presentation Template
Five staged process flow diagram has been used to craft this power point template. This PPT diagram contains the concept of data and process flow .Use this PPT for business and data related presentations.
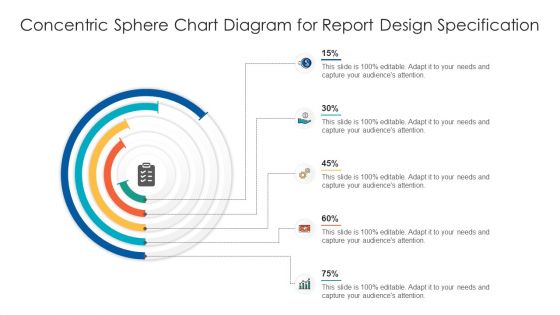
Concentric Sphere Chart Diagram For Report Design Specification Ppt Inspiration PDF
Presenting concentric sphere chart diagram for report design specification ppt inspiration pdf to dispense important information. This template comprises five stages. It also presents valuable insights into the topics including concentric sphere chart diagram for report design specification. This is a completely customizable PowerPoint theme that can be put to use immediately. So, download it and address the topic impactfully.
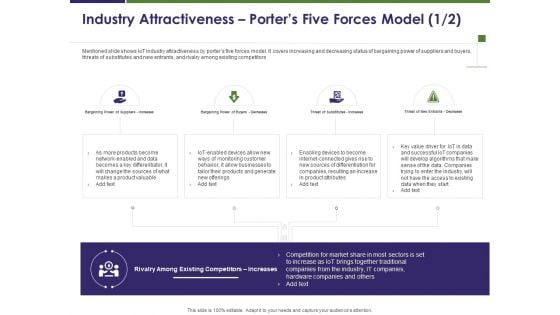
Business Intelligence Report Industry Attractiveness Porters Five Forces Model Increases Ppt Outline Infographics PDF
Presenting this set of slides with name business intelligence report industry attractiveness porters five forces model increases ppt outline infographics pdf. This is a four stage process. The stages in this process are bargaining power of suppliers increases, bargaining power of buyers decreases, threat of substitutes increases, threat of new entrants decreases. This is a completely editable PowerPoint presentation and is available for immediate download. Download now and impress your audience.

Business Intelligence Report Industry Attractiveness Porters Five Forces Model Ppt Diagrams PDF
Presenting this set of slides with name business intelligence report industry attractiveness porters five forces model ppt diagrams pdf. This is a five stage process. The stages in this process are bargaining power of suppliers increases, bargaining power of buyers decreases, threat of substitutes increases, threat of new entrants decreases. This is a completely editable PowerPoint presentation and is available for immediate download. Download now and impress your audience.
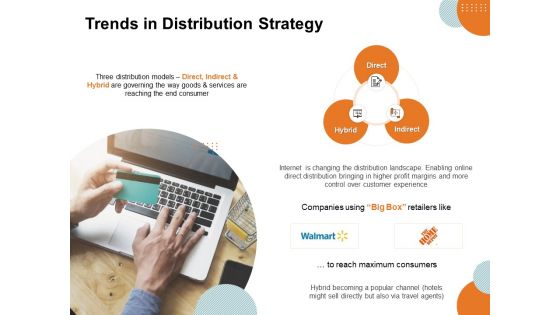
Key Product Distribution Channels Trends In Distribution Strategy Ppt Templates PDF
Presenting this set of slides with name key product distribution channels trends in distribution strategy ppt templates pdf. This is a three stage process. The stages in this process are direct, indirect, hybrid. This is a completely editable PowerPoint presentation and is available for immediate download. Download now and impress your audience.
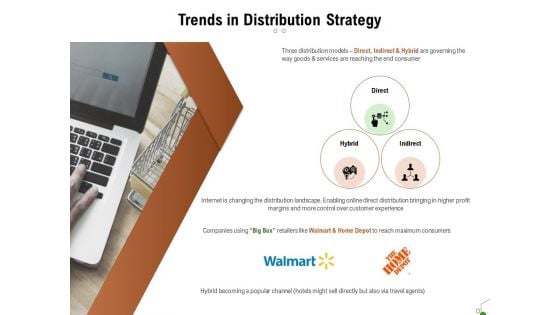
Selecting Appropriate Distribution Channel New Product Trends In Distribution Strategy Mockup PDF
Presenting this set of slides with name selecting appropriate distribution channel new product trends in distribution strategy mockup pdf. This is a three stage process. The stages in this process are direct, indirect, hybrid. This is a completely editable PowerPoint presentation and is available for immediate download. Download now and impress your audience.
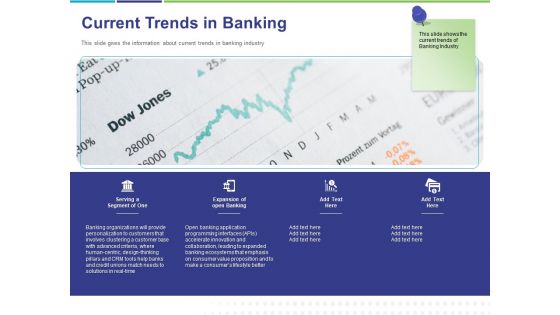
Commodity Up Selling Current Trends In Banking Ppt Outline Design Ideas PDF
Presenting this set of slides with name commodity up selling current trends in banking ppt outline design ideas pdf. This is a four stage process. The stages in this process are serving a segment of one, expansion of open banking. This is a completely editable PowerPoint presentation and is available for immediate download. Download now and impress your audience.
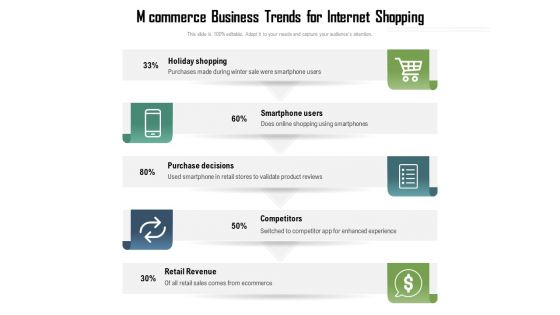
Mcommerce Business Trends For Internet Shopping Ppt PowerPoint Presentation Model Gallery PDF
Presenting this set of slides with name mcommerce business trends for internet shopping ppt powerpoint presentation model gallery pdf. This is a five stage process. The stages in this process are holiday shopping, smartphone users, purchase decisions, competitors, retail revenue. This is a completely editable PowerPoint presentation and is available for immediate download. Download now and impress your audience.
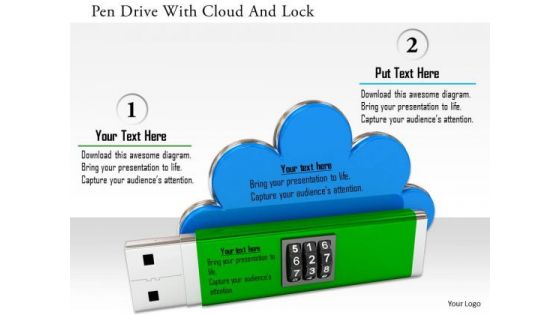
Stock Photo Pen Drive With Cloud And Lock PowerPoint Slide
Graphic of pen drive with cloud and lock has been used to craft this power point image template. This image contains the concept of data safety and cloud technology. Use this image for your data and cloud related topics in any presentation.
Consumer Demographic Data Ppt PowerPoint Presentation Infographic Template Sample Cpb
This is a consumer demographic data ppt powerpoint presentation infographic template sample cpb. This is a four stage process. The stages in this process are consumer demographic data.
Data Analyses Ppt PowerPoint Presentation Professional Example Cpb
This is a data analyses ppt powerpoint presentation professional example cpb. This is a five stage process. The stages in this process are data analyses.

Behavioural Data Ppt PowerPoint Presentation File Show Cpb
This is a behavioural data ppt powerpoint presentation file show cpb. This is a five stage process. The stages in this process are behavioural data.
Viewership Data Ppt PowerPoint Presentation Infographic Template Clipart Images Cpb
This is a viewership data ppt powerpoint presentation infographic template clipart images cpb. This is a seven stage process. The stages in this process are viewership data.
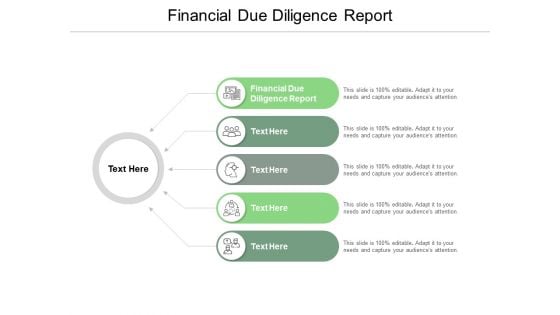
Financial Due Diligence Report Ppt PowerPoint Presentation Slides Graphic Tips Cpb
Presenting this set of slides with name financial due diligence report ppt powerpoint presentation slides graphic tips cpb. This is an editable Powerpoint five stages graphic that deals with topics like financial due diligence report to help convey your message better graphically. This product is a premium product available for immediate download and is 100 percent editable in Powerpoint. Download this now and use it in your presentations to impress your audience.
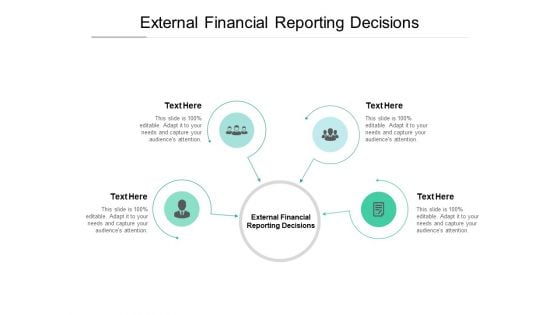
External Financial Reporting Decisions Ppt PowerPoint Presentation Infographic Template File Formats Cpb
Presenting this set of slides with name external financial reporting decisions ppt powerpoint presentation infographic template file formats cpb. This is an editable Powerpoint three stages graphic that deals with topics like external financial reporting decisions to help convey your message better graphically. This product is a premium product available for immediate download and is 100 percent editable in Powerpoint. Download this now and use it in your presentations to impress your audience.
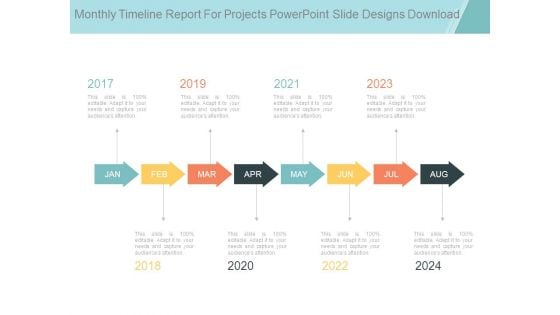
Monthly Timeline Report For Projects Powerpoint Slide Designs Download
This is a monthly timeline report for projects powerpoint slide designs download. This is a eight stage process. The stages in this process are jan, feb, mar, apr, may, jun, jul, aug.
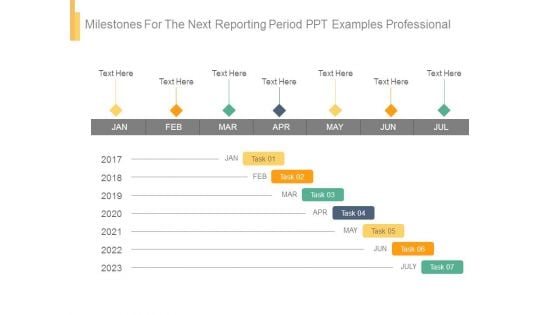
Milestones For The Next Reporting Period Ppt Examples Professional
This is a milestones for the next reporting period ppt examples professional. This is a seven stage process. The stages in this process are jan, feb, mar, apr, may, jun, jul.
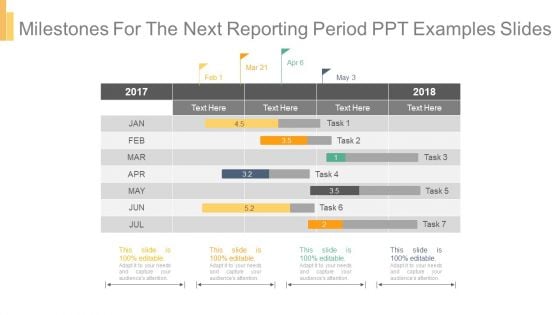
Milestones For The Next Reporting Period Ppt Examples Slides
This is a milestones for the next reporting period ppt examples slides. This is a five stage process. The stages in this process are jan, feb, apr, may, jun, jul.
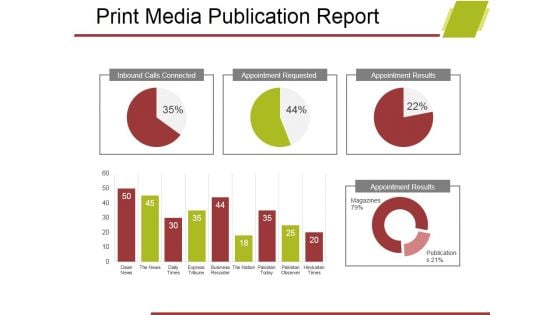
Print Media Publication Report Ppt PowerPoint Presentation Inspiration Design Inspiration
This is a print media publication report ppt powerpoint presentation inspiration design inspiration. This is a three stage process. The stages in this process are inbound calls connected, appointment requested, appointment results, magazines, publications.
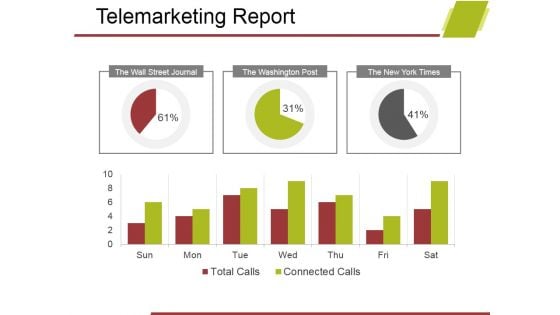
Telemarketing Report Template 2 Ppt PowerPoint Presentation Inspiration Graphics Design
This is a telemarketing report template 2 ppt powerpoint presentation inspiration graphics design. This is a three stage process. The stages in this process are the wall street journal, the washington post, the new york times.
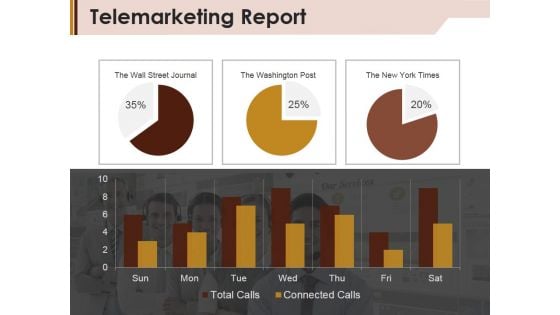
Telemarketing Report Template 1 Ppt PowerPoint Presentation Summary Example
This is a telemarketing report template 1 ppt powerpoint presentation summary example. This is a two stage process. The stages in this process are the wall street journal, the washington post, total calls, connected calls.
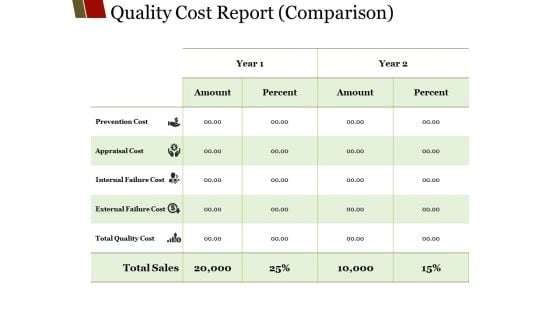
Quality Cost Report Comparison Ppt PowerPoint Presentation Visual Aids Model
This is a quality cost report comparison ppt powerpoint presentation visual aids model. This is a five stage process. The stages in this process are amount, percent, year, prevention cost, prevention cost.
Quality Cost Report Ppt PowerPoint Presentation Icon Information
This is a quality cost report ppt powerpoint presentation icon information. This is a three stage process. The stages in this process are types of cost, quality cost, percentage of sales, prevention cost business.
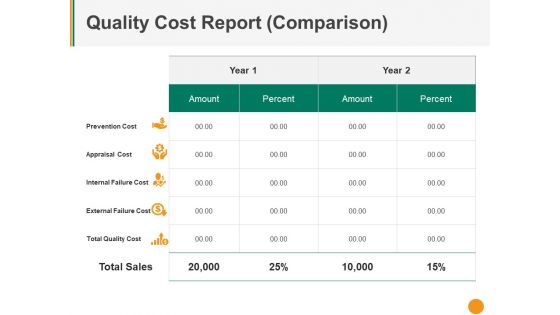
Quality Cost Report Comparison Ppt PowerPoint Presentation Model Portfolio
This is a quality cost report comparison ppt powerpoint presentation model portfolio. This is a two stage process. The stages in this process are prevention cost, appraisal cost, internal failure cost, external failure cost, total quality cost.
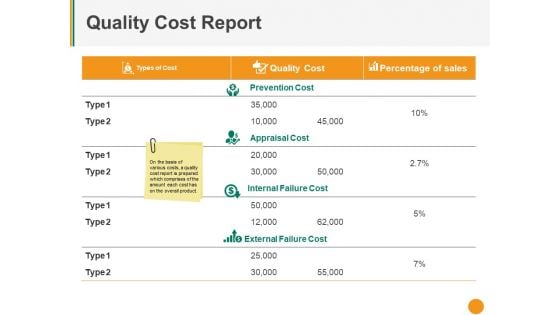
Quality Cost Report Ppt PowerPoint Presentation Model Portrait
This is a quality cost report ppt powerpoint presentation model portrait. This is a three stage process. The stages in this process are types of cost, quality cost, percentage of sales, prevention cost, appraisal cost.
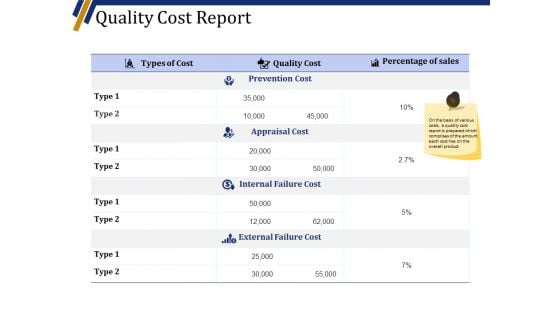
Quality Cost Report Ppt PowerPoint Presentation Portfolio Show
This is a quality cost report ppt powerpoint presentation portfolio show. This is a four stage process. The stages in this process are types of cost, quality cost, percentage of sales, prevention cost, appraisal cost.
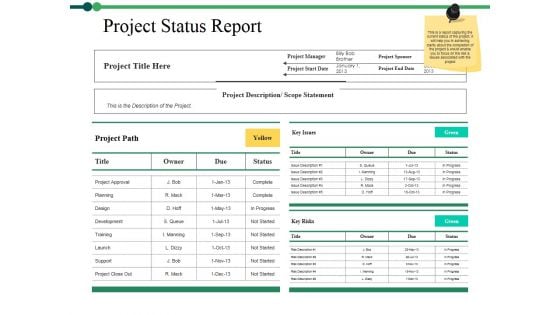
Project Status Report Ppt PowerPoint Presentation Infographics Graphics Example
This is a project status report ppt powerpoint presentation infographics graphics example. This is a three stage process. The stages in this process are project approval, planning, design, training, support.
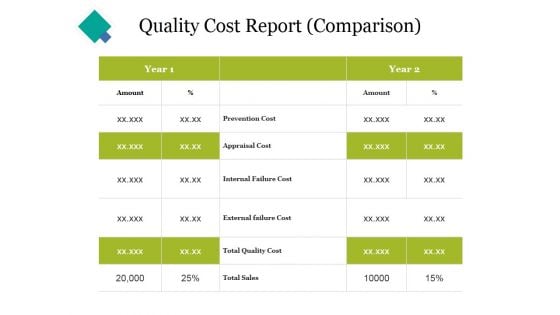
Quality Cost Report Comparison Ppt PowerPoint Presentation Portfolio Themes
This is a quality cost report comparison ppt powerpoint presentation portfolio themes. This is a two stage process. The stages in this process are prevention cost, appraisal cost, internal failure cost, external failure cost, total quality cost.
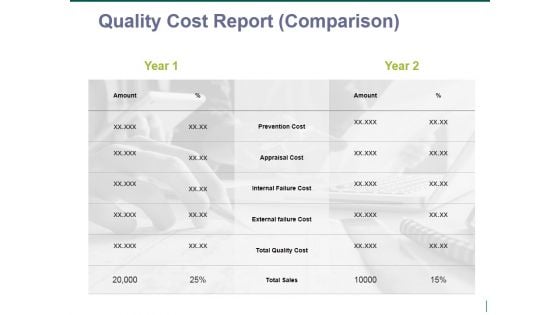
quality cost report comparison ppt powerpoint presentation portfolio information
This is a quality cost report comparison ppt powerpoint presentation portfolio information. This is a two stage process. The stages in this process are prevention cost, appraisal cost, internal failure cost, external failure cost, total quality cost.
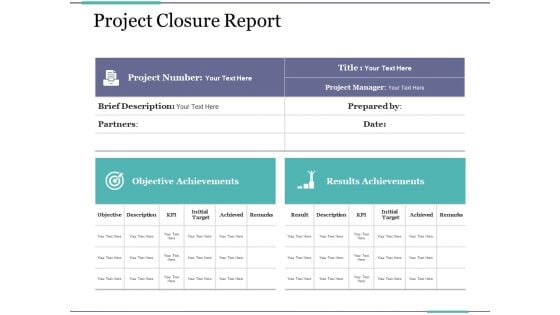
Project Closure Report Ppt PowerPoint Presentation Outline Professional
This is a project closure report ppt powerpoint presentation outline professional. This is a four stage process. The stages in this process are business, brief description, objective achievements, results achievements, project number.
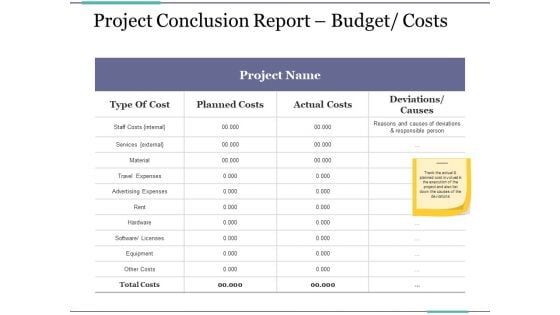
Project Conclusion Report Budget Costs Ppt PowerPoint Presentation Infographics Structure
This is a project conclusion report budget costs ppt powerpoint presentation infographics structure. This is a four stage process. The stages in this process are type of cost, planned costs, actual costs, deviations causes, business.
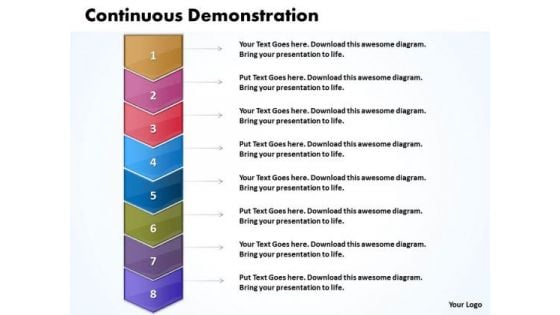
Ppt Vertical Scientific Method Steps PowerPoint Presentation 8 1 Templates
PPT vertical scientific method steps powerpoint presentation 8 1 Templates-Vertical Steps diagrams are usually used to represent a process as a list of steps.-PPT vertical scientific method steps powerpoint presentation 8 1 Templates-Advertising, Arrow, Background, Blue, Bookmark, Card, Choice, Concept, Corporate, Creative, Design, Flow, Illustration, Graphic, Instruction, Label, Layout, Manual, Modern, Number, Options, Order, Page, Paper, Product, Progress, Progress Concept, Progress Report, Promotion, Sequence, Special, Step, Symbol, Tab, Tutorial, Version Display world class operations with our Ppt Vertical Scientific Method Steps PowerPoint Presentation 8 1 Templates. They will make you look good.
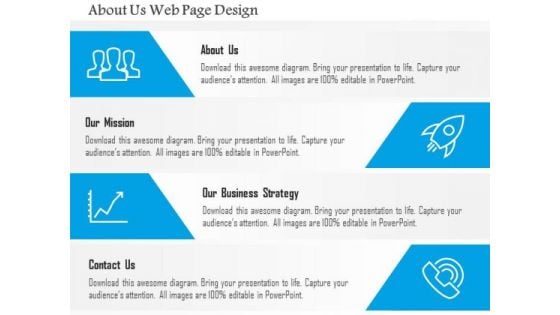
Business Diagram About Us Web Page Design Presentation Template
This power point template diagram has been designed with graphic of four icons. This PPT can represent the concept of building about us. This PPT is suitable for business and data related presentations.
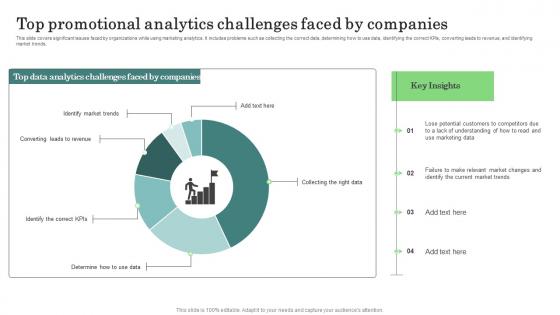
Major Promotional Analytics Future Trends Top Promotional Analytics Ideas Pdf
This slide covers significant issues faced by organizations while using marketing analytics. It includes problems such as collecting the correct data, determining how to use data, identifying the correct KPIs, converting leads to revenue, and identifying market trends. qSlidegeeks has constructed Major Promotional Analytics Future Trends Top Promotional Analytics Ideas Pdf after conducting extensive research and examination. These presentation templates are constantly being generated and modified based on user preferences and critiques from editors. Here, you will find the most attractive templates for a range of purposes while taking into account ratings and remarks from users regarding the content. This is an excellent jumping off point to explore our content and will give new users an insight into our top notch PowerPoint Templates. This slide covers significant issues faced by organizations while using marketing analytics. It includes problems such as collecting the correct data, determining how to use data, identifying the correct KPIs, converting leads to revenue, and identifying market trends.
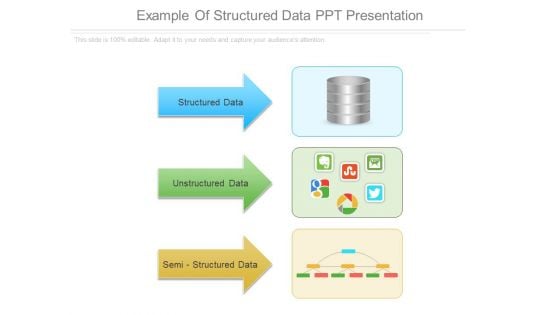
Example Of Structured Data Ppt Presentation
This is a example of structured data ppt presentation. This is a three stage process. The stages in this process are structured data, unstructured data, semi structured data.
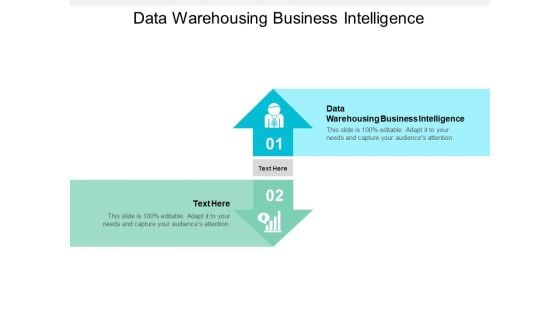
Data Warehousing Business Intelligence Ppt PowerPoint Presentation Inspiration Template Cpb
This is a data warehousing business intelligence ppt powerpoint presentation inspiration template cpb. This is a two stage process. The stages in this process are data warehousing business intelligence.
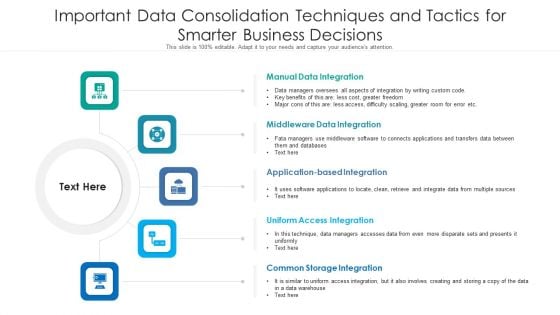
Important Data Consolidation Techniques And Tactics For Smarter Business Decisions Formats PDF
Presenting important data consolidation techniques and tactics for smarter business decisions formats pdf to dispense important information. This template comprises five stages. It also presents valuable insights into the topics including data integration, storage integration, application based integration. This is a completely customizable PowerPoint theme that can be put to use immediately. So, download it and address the topic impactfully.

Busines Diagram Multicolored Tags For Process Diagram Presentation Template
Multiple tags are used to decorate this business diagram. Use this professional slide for data representation. Deliver amazing presentations to mesmerize your audience.
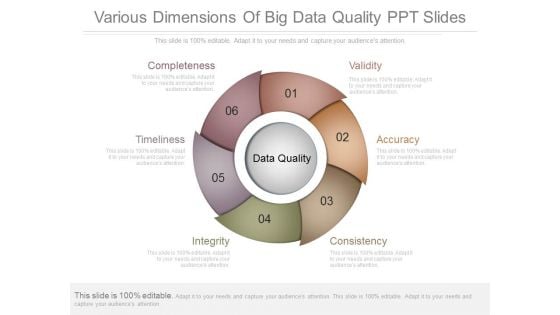
Various Dimensions Of Big Data Quality Ppt Slides
This is a various dimensions of big data quality ppt slides. This is a six stage process. The stages in this process are completeness, timeliness, integrity, consistency, accuracy, validity.
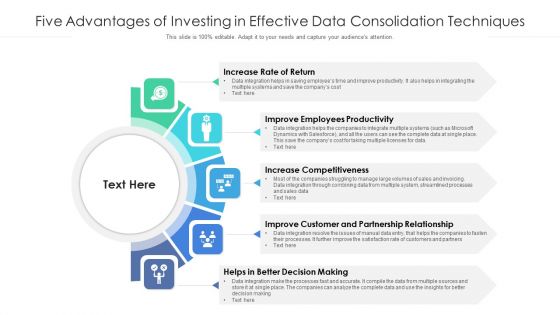
Five Advantages Of Investing In Effective Data Consolidation Techniques Pictures PDF
Persuade your audience using this five advantages of investing in effective data consolidation techniques pictures pdf. This PPT design covers five stages, thus making it a great tool to use. It also caters to a variety of topics including improve employees productivity, increase competitiveness, decision making. Download this PPT design now to present a convincing pitch that not only emphasizes the topic but also showcases your presentation skills.


 Continue with Email

 Home
Home


