Marketing Org Chart
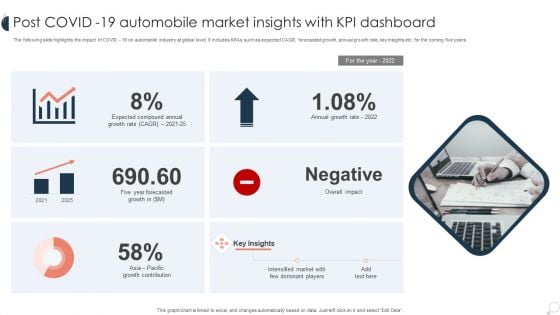
Post COVID 19 Automobile Market Insights With KPI Dashboard Ppt PowerPoint Presentation Slides Background Images PDF
The following slide highlights the impact of COVID 19 on automobile industry at global level. It includes KPAs such as expected CAGR, forecasted growth, annual growth rate, key insights etc. for the coming five years. Showcasing this set of slides titled Post COVID 19 Automobile Market Insights With KPI Dashboard Ppt PowerPoint Presentation Slides Background Images PDF. The topics addressed in these templates are Expected Compound, Annual Growth, Overall Impact. All the content presented in this PPT design is completely editable. Download it and make adjustments in color, background, font etc. as per your unique business setting.
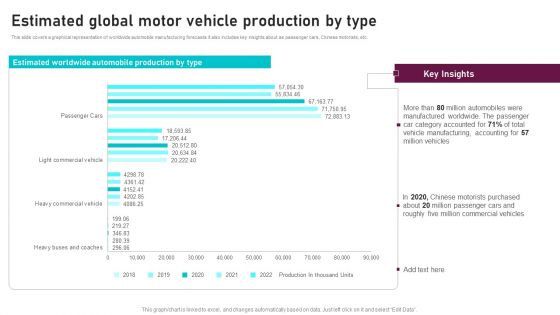
Estimated Global Motor Vehicle Production By Type Global Automotive Manufacturing Market Analysis Information PDF
This slide covers a graphical representation of worldwide automobile manufacturing forecasts. It also includes key insights about as passenger cars, Chinese motorists, etc. The Estimated Global Motor Vehicle Production By Type Global Automotive Manufacturing Market Analysis Information PDF is a compilation of the most recent design trends as a series of slides. It is suitable for any subject or industry presentation, containing attractive visuals and photo spots for businesses to clearly express their messages. This template contains a variety of slides for the user to input data, such as structures to contrast two elements, bullet points, and slides for written information. Slidegeeks is prepared to create an impression.
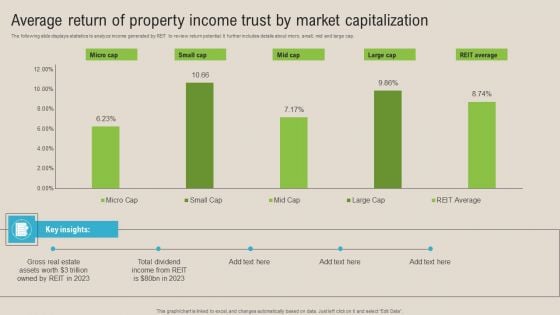
Average Return Of Property Income Trust By Market Capitalization Pictures PDF
The following slide displays statistics to analyze income generated by REIT to review return potential. It further includes details about micro, small, mid and large cap. Showcasing this set of slides titled Average Return Of Property Income Trust By Market Capitalization Pictures PDF. The topics addressed in these templates are Gross Real Estate Assets, Total Dividend, Micro Cap. All the content presented in this PPT design is completely editable. Download it and make adjustments in color, background, font etc. as per your unique business setting.
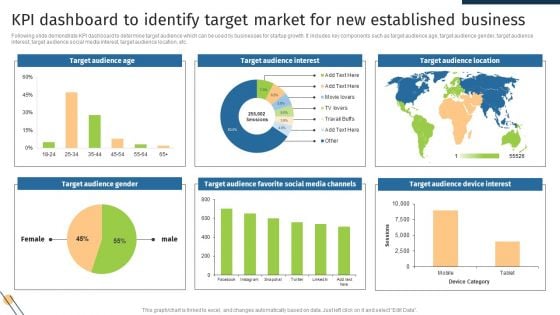
KPI Dashboard To Identify Target Market For New Established Business Formats PDF
Following slide demonstrate KPI dashboard to determine target audience which can be used by businesses for startup growth. It includes key components such as target audience age, target audience gender, target audience interest, target audience social media interest, target audience location, etc. Showcasing this set of slides titled KPI Dashboard To Identify Target Market For New Established Business Formats PDF. The topics addressed in these templates are Target Audience Age, Target Audience Interest, Target Audience Location. All the content presented in this PPT design is completely editable. Download it and make adjustments in color, background, font etc. as per your unique business setting.
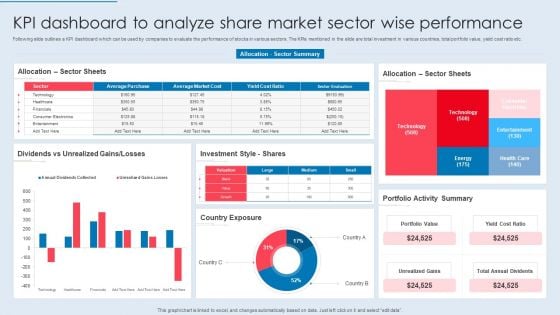
KPI Dashboard To Analyze Share Market Sector Wise Performance Summary PDF
Following slide outlines a KPI dashboard which can be used by companies to evaluate the performance of stocks in various sectors. The KPIs mentioned in the slide are total investment in various countries, total portfolio value, yield cost ratio etc. Pitch your topic with ease and precision using this KPI Dashboard To Analyze Share Market Sector Wise Performance Summary PDF. This layout presents information on Sector Sheets, Dividends Vs Unrealized, Investment Style. It is also available for immediate download and adjustment. So, changes can be made in the color, design, graphics or any other component to create a unique layout.
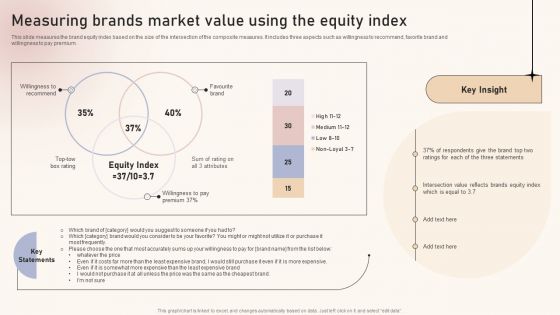
Optimizing Brand Equity Through Strategic Management Measuring Brands Market Value Using The Equity Index Microsoft PDF
This slide measures the brand equity index based on the size of the intersection of the composite measures. It includes three aspects such as willingness to recommend, favorite brand and willingness to pay premium. Retrieve professionally designed Optimizing Brand Equity Through Strategic Management Measuring Brands Market Value Using The Equity Index Microsoft PDF to effectively convey your message and captivate your listeners. Save time by selecting pre-made slideshows that are appropriate for various topics, from business to educational purposes. These themes come in many different styles, from creative to corporate, and all of them are easily adjustable and can be edited quickly. Access them as PowerPoint templates or as Google Slides themes. You do not have to go on a hunt for the perfect presentation because Slidegeeks got you covered from everywhere.
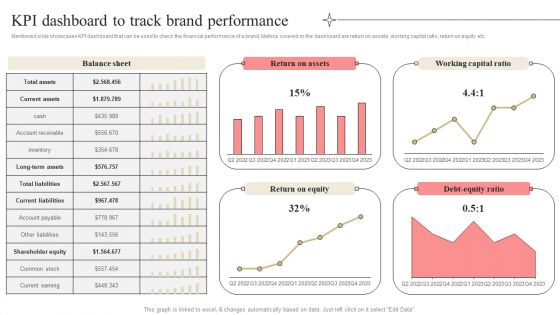
Developing Market Leading Businesses KPI Dashboard To Track Brand Performance Summary PDF
Mentioned slide showcases KPI dashboard that can be used to check the financial performance of a brand. Metrics covered in the dashboard are return on assets, working capital ratio, return on equity etc. Coming up with a presentation necessitates that the majority of the effort goes into the content and the message you intend to convey. The visuals of a PowerPoint presentation can only be effective if it supplements and supports the story that is being told. Keeping this in mind our experts created Developing Market Leading Businesses KPI Dashboard To Track Brand Performance Summary PDF to reduce the time that goes into designing the presentation. This way, you can concentrate on the message while our designers take care of providing you with the right template for the situation.
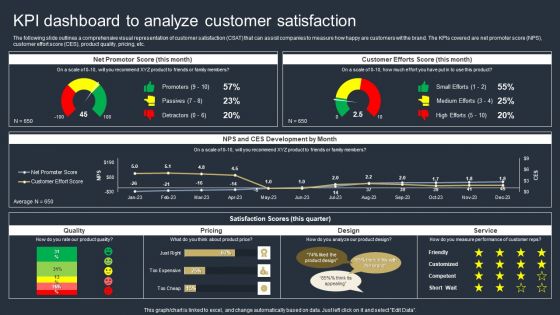
Comprehensive Market Research Guide KPI Dashboard To Analyze Customer Satisfaction Structure PDF
The following slide outlines a comprehensive visual representation of customer satisfaction CSAT that can assist companies to measure how happy are customers wit the brand. The KPIs covered are net promoter score NPS, customer effort score CES, product quality, pricing, etc. Retrieve professionally designed Comprehensive Market Research Guide KPI Dashboard To Analyze Customer Satisfaction Structure PDF to effectively convey your message and captivate your listeners. Save time by selecting pre-made slideshows that are appropriate for various topics, from business to educational purposes. These themes come in many different styles, from creative to corporate, and all of them are easily adjustable and can be edited quickly. Access them as PowerPoint templates or as Google Slides themes. You dont have to go on a hunt for the perfect presentation because Slidegeeks got you covered from everywhere.
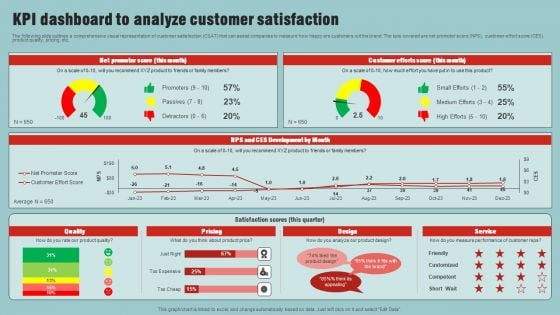
Market Analysis Overview And Different Categories KPI Dashboard To Analyze Customer Satisfaction Elements PDF
The following slide outlines a comprehensive visual representation of customer satisfaction CSAT that can assist companies to measure how happy are customers wit the brand. The kpis covered are net promoter score NPS, customer effort score CES, product quality, pricing, etc. Retrieve professionally designed Market Analysis Overview And Different Categories KPI Dashboard To Analyze Customer Satisfaction Elements PDF to effectively convey your message and captivate your listeners. Save time by selecting pre made slideshows that are appropriate for various topics, from business to educational purposes. These themes come in many different styles, from creative to corporate, and all of them are easily adjustable and can be edited quickly. Access them as PowerPoint templates or as Google Slides themes. You do not have to go on a hunt for the perfect presentation because Slidegeeks got you covered from everywhere.
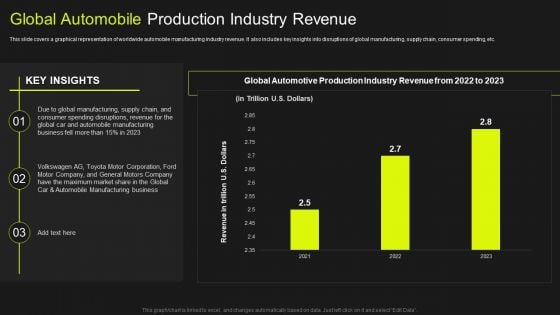
Global Automobile Market Analysis Global Automobile Production Industry Revenue Demonstration PDF
This slide covers a graphical representation of worldwide automobile manufacturing industry revenue. It also includes key insights into disruptions of global manufacturing, supply chain, consumer spending, etc. Do you know about Slidesgeeks Global Automobile Market Analysis Global Automobile Production Industry Revenue Demonstration PDF. These are perfect for delivering any kind od presentation. Using it, create PowerPoint presentations that communicate your ideas and engage audiences. Save time and effort by using our pre-designed presentation templates that are perfect for a wide range of topic. Our vast selection of designs covers a range of styles, from creative to business, and are all highly customizable and easy to edit. Download as a PowerPoint template or use them as Google Slides themes.
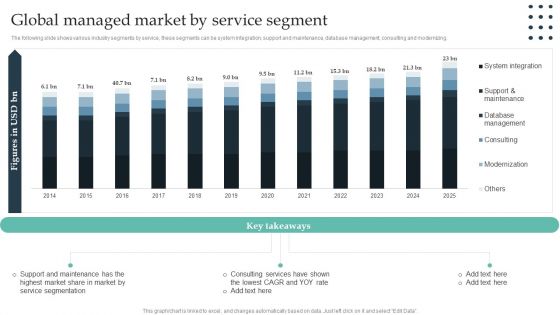
Enterprise Consumer Technology Management Global Managed Market By Service Segment Ideas PDF
The following slide shows various industry segments by service, these segments can be system integration, support and maintenance, database management, consulting and modernizing. Do you know about Slidesgeeks Enterprise Consumer Technology Management Global Managed Market By Service Segment Ideas PDF These are perfect for delivering any kind od presentation. Using it, create PowerPoint presentations that communicate your ideas and engage audiences. Save time and effort by using our pre designed presentation templates that are perfect for a wide range of topic. Our vast selection of designs covers a range of styles, from creative to business, and are all highly customizable and easy to edit. Download as a PowerPoint template or use them as Google Slides themes.
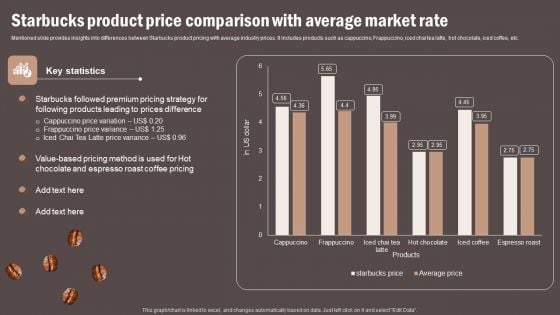
Coffee Cafe Company Profile Starbucks Product Price Comparison With Average Market Rate Introduction PDF
Mentioned slide provides insights into differences between Starbucks product pricing with average industry prices. It includes products such as cappuccino, Frappuccino, iced chai tea latte, hot chocolate, iced coffee, etc. Do you know about Slidesgeeks Coffee Cafe Company Profile Starbucks Product Price Comparison With Average Market Rate Introduction PDF. These are perfect for delivering any kind od presentation. Using it, create PowerPoint presentations that communicate your ideas and engage audiences. Save time and effort by using our pre designed presentation templates that are perfect for a wide range of topic. Our vast selection of designs covers a range of styles, from creative to business, and are all highly customizable and easy to edit. Download as a PowerPoint template or use them as Google Slides themes.

Electric Vehicle Sales Growth In California And The Us Global Automotive Manufacturing Market Analysis Structure PDF
This slide covers a graphical representation of EV sales in the United States and California. It also includes key insights about Californias 2022 Q1 sales in comparison to 2021 Q4, increased fuel costs and large super bowl EV ad, etc. Welcome to our selection of the Electric Vehicle Sales Growth In California And The Us Global Automotive Manufacturing Market Analysis Structure PDF. These are designed to help you showcase your creativity and bring your sphere to life. Planning and Innovation are essential for any business that is just starting out. This collection contains the designs that you need for your everyday presentations. All of our PowerPoints are 100 parcent editable, so you can customize them to suit your needs. This multi-purpose template can be used in various situations. Grab these presentation templates today.
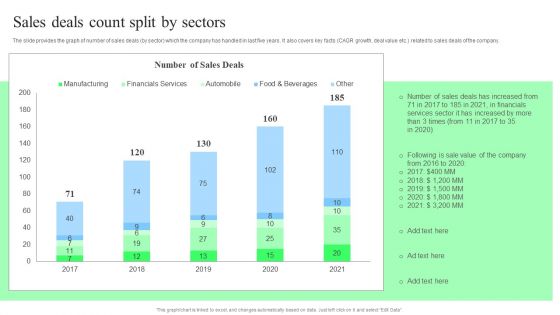
Target Consumers And Market Valuation Overview Sales Deals Count Split By Sectors Rules PDF
The slide provides the graph of number of sales deals by sector which the company has handled in last five years. It also covers key facts CAGR growth, deal value etc. related to sales deals of the company. Retrieve professionally designed Target Consumers And Market Valuation Overview Sales Deals Count Split By Sectors Rules PDF to effectively convey your message and captivate your listeners. Save time by selecting pre made slideshows that are appropriate for various topics, from business to educational purposes. These themes come in many different styles, from creative to corporate, and all of them are easily adjustable and can be edited quickly. Access them as PowerPoint templates or as Google Slides themes. You do not have to go on a hunt for the perfect presentation because Slidegeeks got you covered from everywhere.
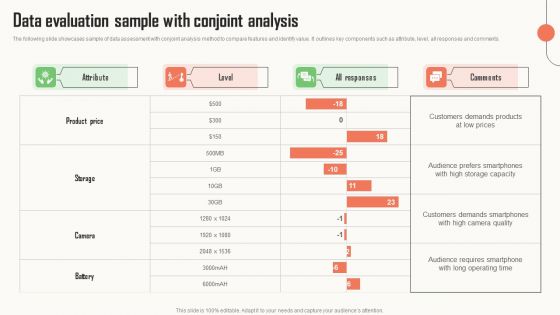
Strategic Market Insight Implementation Guide Data Evaluation Sample With Conjoint Analysis Background PDF
The following slide showcases sample of data assessment with conjoint analysis method to compare features and identify value. It outlines key components such as attribute, level, all responses and comments. Slidegeeks is here to make your presentations a breeze with Strategic Market Insight Implementation Guide Data Evaluation Sample With Conjoint Analysis Background PDF With our easy to use and customizable templates, you can focus on delivering your ideas rather than worrying about formatting. With a variety of designs to choose from, you are sure to find one that suits your needs. And with animations and unique photos, illustrations, and fonts, you can make your presentation pop. So whether you are giving a sales pitch or presenting to the board, make sure to check out Slidegeeks first.

Global Automotive Production Industry Revenue Global Automotive Manufacturing Market Analysis Rules PDF
This slide covers a graphical representation of worldwide automobile manufacturing industry revenue. It also includes key insights into disruptions of global manufacturing, supply chain, consumer spending, etc. This Global Automotive Production Industry Revenue Global Automotive Manufacturing Market Analysis Rules PDF from Slidegeeks makes it easy to present information on your topic with precision. It provides customization options, so you can make changes to the colors, design, graphics, or any other component to create a unique layout. It is also available for immediate download, so you can begin using it right away. Slidegeeks has done good research to ensure that you have everything you need to make your presentation stand out. Make a name out there for a brilliant performance.
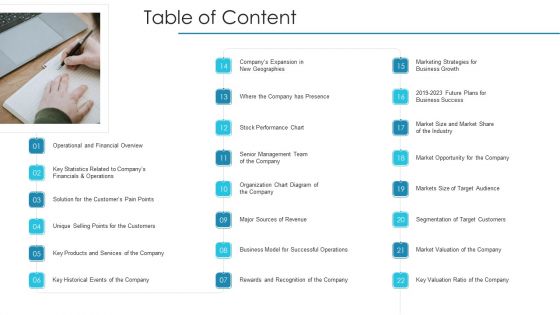
Post Initial Pubic Offering Market Pitch Deck Table Of Content Rules PDF
This is a post initial pubic offering market pitch deck table of content rules pdf. template with various stages. Focus and dispense information on one stage using this creative set, that comes with editable features. It contains large content boxes to add your information on topics like operational and financial overview, organization chart diagram of the company, market size and market share of the industry. You can also showcase facts, figures, and other relevant content using this PPT layout. Grab it now.
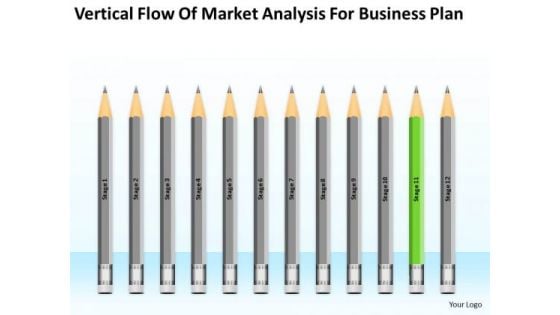
Vertical Flow Of Market Analysis For Business Plan Ppt 11 Startup Plans PowerPoint Slides
We present our vertical flow of market analysis for business plan ppt 11 startup plans PowerPoint Slides.Download and present our Education PowerPoint Templates because It will Raise the bar of your Thoughts. They are programmed to take you to the next level. Use our Process and Flows PowerPoint Templates because You have a driving passion to excel in your field. Our PowerPoint Templates and Slides will prove ideal vehicles for your ideas. Download and present our Flow Charts PowerPoint Templates because Your audience will believe you are the cats whiskers. Download and present our Business PowerPoint Templates because You aspire to touch the sky with glory. Let our PowerPoint Templates and Slides provide the fuel for your ascent. Download and present our Shapes PowerPoint Templates because It will let you Set new benchmarks with our PowerPoint Templates and Slides. They will keep your prospects well above par.Use these PowerPoint slides for presentations relating to Mark, corporate, business, plan, concept, bright, symbol, diagram, crayon, stack, graphic, finance, stock,analysis, drawing, paint, calculation, accounting, creative, economic, creativity, chart, forecast, design, color, objects, stationary, pencil, education,profit, information, background, investment, figures, ten, business, business process. The prominent colors used in the PowerPoint template are Green, Black, Gray. Expand your horizons with our Vertical Flow Of Market Analysis For Business Plan Ppt 11 Startup Plans PowerPoint Slides. Download without worries with our money back guaranteee.
Vertical Flow Of Market Analysis For Business Plan Ppt 6 Write PowerPoint Slides
We present our vertical flow of market analysis for business plan ppt 6 write PowerPoint Slides.Use our Flow Charts PowerPoint Templates because It can Conjure up grand ideas with our magical PowerPoint Templates and Slides. Leave everyone awestruck by the end of your presentation. Download and present our Business PowerPoint Templates because Our PowerPoint Templates and Slides has conjured up a web of all you need with the help of our great team. Use them to string together your glistening ideas. Use our Shapes PowerPoint Templates because It can Conjure up grand ideas with our magical PowerPoint Templates and Slides. Leave everyone awestruck by the end of your presentation. Present our Education PowerPoint Templates because Our PowerPoint Templates and Slides are aesthetically designed to attract attention. We gaurantee that they will grab all the eyeballs you need. Download our Process and Flows PowerPoint Templates because Our PowerPoint Templates and Slides offer you the needful to organise your thoughts. Use them to list out your views in a logical sequence.Use these PowerPoint slides for presentations relating to Mark, corporate, business, plan, concept, bright, symbol, diagram, crayon, stack, graphic, finance, stock,analysis, drawing, paint, calculation, accounting, creative, economic, creativity, chart, forecast, design, color, objects, stationary, pencil, education,profit, information, background, investment, figures, ten, business, business process. The prominent colors used in the PowerPoint template are Blue, White, Gray. Get your approach right with our Vertical Flow Of Market Analysis For Business Plan Ppt 6 Write PowerPoint Slides. They will make a definite difference.
Flow Of Market Analysis For Business Plan Ppt Building PowerPoint Templates
We present our flow of market analysis for business plan ppt building PowerPoint templates.Use our Education PowerPoint Templates because Our PowerPoint Templates and Slides are like the strings of a tennis racquet. Well strung to help you serve aces. Use our Process and Flows PowerPoint Templates because Our PowerPoint Templates and Slides come in all colours, shades and hues. They help highlight every nuance of your views. Use our Business PowerPoint Templates because They will Put your wonderful verbal artistry on display. Our PowerPoint Templates and Slides will provide you the necessary glam and glitter. Use our Shapes PowerPoint Templates because you can Add colour to your speech with our PowerPoint Templates and Slides. Your presentation will leave your audience speechless. Download our Flow Charts PowerPoint Templates because You can safely bank on our PowerPoint Templates and Slides. They will provide a growth factor to your valuable thoughts.Use these PowerPoint slides for presentations relating to Pencil, mark, corporate, business, plan, concept, bright, symbol, diagram, crayon, stack, graphic, finance, stock,analysis, drawing, paint, calculation, accounting, creative, economic, creativity, chart, design, color, objects, stationary, education,profit, information, background, investment, figures, business, business process. The prominent colors used in the PowerPoint template are Gray, Blue, Black. Addsome spice with our Flow Of Market Analysis For Business Plan Ppt Building PowerPoint Templates. Give your thoughts the right flavour.
Vertical Flow Of Market Analysis For Business Plan Ppt 10 Sales PowerPoint Templates
We present our vertical flow of market analysis for business plan ppt 10 sales PowerPoint templates.Download our Flow Charts PowerPoint Templates because Our PowerPoint Templates and Slides have the Brilliant backdrops. Guaranteed to illuminate the minds of your audience. Use our Business PowerPoint Templates because Our PowerPoint Templates and Slides will let you Illuminate the road ahead to Pinpoint the important landmarks along the way. Present our Shapes PowerPoint Templates because Your audience will believe you are the cats whiskers. Use our Education PowerPoint Templates because Our PowerPoint Templates and Slides are the chords of your song. String them along and provide the lilt to your views. Present our Process and Flows PowerPoint Templates because Our PowerPoint Templates and Slides are the chords of your song. String them along and provide the lilt to your views.Use these PowerPoint slides for presentations relating to Mark, corporate, business, plan, concept, bright, symbol, diagram, crayon, stack, graphic, finance, stock,analysis, drawing, paint, calculation, accounting, creative, economic, creativity, chart, forecast, design, color, objects, stationary, pencil, education,profit, information, background, investment, figures, ten, business, business process. The prominent colors used in the PowerPoint template are Gray, Red, Black. Whatever the fare, add on our Vertical Flow Of Market Analysis For Business Plan Ppt 10 Sales PowerPoint Templates. They go down well with everything.
Vertical Flow Of Market Analysis For Business Plan Ppt 8 Fashion PowerPoint Slides
We present our vertical flow of market analysis for business plan ppt 8 fashion PowerPoint Slides.Download and present our Business PowerPoint Templates because Our PowerPoint Templates and Slides will provide weight to your words. They will bring out the depth of your thought process. Download our Education PowerPoint Templates because Our PowerPoint Templates and Slides will definately Enhance the stature of your presentation. Adorn the beauty of your thoughts with their colourful backgrounds. Download and present our Process and Flows PowerPoint Templates because You aspire to touch the sky with glory. Let our PowerPoint Templates and Slides provide the fuel for your ascent. Use our Flow Charts PowerPoint Templates because Our PowerPoint Templates and Slides help you pinpoint your timelines. Highlight the reasons for your deadlines with their use. Download our Shapes PowerPoint Templates because Your ideas provide food for thought. Our PowerPoint Templates and Slides will help you create a dish to tickle the most discerning palate.Use these PowerPoint slides for presentations relating to Mark, corporate, business, plan, concept, bright, symbol, diagram, crayon, stack, graphic, finance, stock,analysis, drawing, paint, calculation, accounting, creative, economic, creativity, chart, forecast, design, color, objects, stationary, pencil, education,profit, information, background, investment, figures, ten, business, business process. The prominent colors used in the PowerPoint template are Gray, Black, Green. Our Vertical Flow Of Market Analysis For Business Plan Ppt 8 Fashion PowerPoint Slides need no amendments. You will find them just apt for use.
Vertical Flow Of Market Analysis For Business Plan Ppt 9 Need PowerPoint Slides
We present our vertical flow of market analysis for business plan ppt 9 need PowerPoint Slides.Download our Education PowerPoint Templates because Our PowerPoint Templates and Slides are a sure bet. Gauranteed to win against all odds. Present our Process and Flows PowerPoint Templates because Our PowerPoint Templates and Slides have the Brilliant backdrops. Guaranteed to illuminate the minds of your audience. Download our Flow Charts PowerPoint Templates because You canTake a leap off the starting blocks with our PowerPoint Templates and Slides. They will put you ahead of the competition in quick time. Use our Business PowerPoint Templates because You should Bet on your luck with our PowerPoint Templates and Slides. Be assured that you will hit the jackpot. Download and present our Shapes PowerPoint Templates because Our PowerPoint Templates and Slides provide you with a vast range of viable options. Select the appropriate ones and just fill in your text. Use these PowerPoint slides for presentations relating to Mark, corporate, business, plan, concept, bright, symbol, diagram, crayon, stack, graphic, finance, stock,analysis, drawing, paint, calculation, accounting, creative, economic, creativity, chart, forecast, design, color, objects, stationary, pencil, education,profit, information, background, investment, figures, ten, business, business process. The prominent colors used in the PowerPoint template are Blue, Gray, Black. Blow out your competition with our Vertical Flow Of Market Analysis For Business Plan Ppt 9 Need PowerPoint Slides. Just download, type and present.
Flow Of Market Analysis For Business Plan Ppt Outline PowerPoint Slides
We present our flow of market analysis for business plan ppt outline PowerPoint Slides.Present our Education PowerPoint Templates because Our PowerPoint Templates and Slides will effectively help you save your valuable time. They are readymade to fit into any presentation structure. Present our Process and Flows PowerPoint Templates because You are well armed with penetrative ideas. Our PowerPoint Templates and Slides will provide the gunpowder you need. Use our Business PowerPoint Templates because It can Bubble and burst with your ideas. Use our Shapes PowerPoint Templates because Our PowerPoint Templates and Slides will let you Illuminate the road ahead to Pinpoint the important landmarks along the way. Present our Flow Charts PowerPoint Templates because Your success is our commitment. Our PowerPoint Templates and Slides will ensure you reach your goal.Use these PowerPoint slides for presentations relating to Pencil, mark, corporate, business, plan, concept, bright, symbol, diagram, crayon, stack, graphic, finance, stock,analysis, drawing, paint, calculation, accounting, creative, economic, creativity, chart, design, color, objects, stationary, education,profit, information, background, investment, figures, business, business process. The prominent colors used in the PowerPoint template are Red, Black, Gray. Our Flow Of Market Analysis For Business Plan Ppt Outline PowerPoint Slides will elevate the experience. Lift your thoughts to a higher plane.
Flow Of Market Analysis For Business Plan Ppt How Do Write PowerPoint Slides
We present our flow of market analysis for business plan ppt how do write PowerPoint Slides.Present our Education PowerPoint Templates because Our PowerPoint Templates and Slides will definately Enhance the stature of your presentation. Adorn the beauty of your thoughts with their colourful backgrounds. Present our Process and Flows PowerPoint Templates because You can Inspire your team with our PowerPoint Templates and Slides. Let the force of your ideas flow into their minds. Present our Business PowerPoint Templates because Our PowerPoint Templates and Slides are conceived by a dedicated team. Use them and give form to your wondrous ideas. Download and present our Shapes PowerPoint Templates because Our PowerPoint Templates and Slides will effectively help you save your valuable time. They are readymade to fit into any presentation structure. Download our Flow Charts PowerPoint Templates because It is Aesthetically crafted by artistic young minds. Our PowerPoint Templates and Slides are designed to display your dexterity.Use these PowerPoint slides for presentations relating to Pencil, mark, corporate, business, plan, concept, bright, symbol, diagram, crayon, stack, graphic, finance, stock,analysis, drawing, paint, calculation, accounting, creative, economic, creativity, chart, design, color, objects, stationary, education,profit, information, background, investment, figures, business, business process. The prominent colors used in the PowerPoint template are Red, Black, Gray.
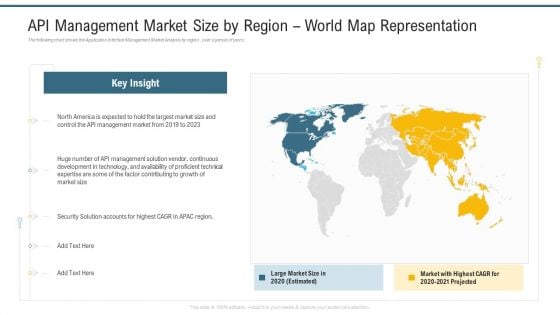
API Management Market Size By Region World Map Representation Ppt Model Design Inspiration PDF
The following chart shows the Application Interface Management Market Analysis by region , over a period of years. This is a api management market size by region world map representation ppt model design inspiration pdf template with various stages. Focus and dispense information on one stage using this creative set, that comes with editable features. It contains large content boxes to add your information on topics like growth of market size, continuous development, market size. You can also showcase facts, figures, and other relevant content using this PPT layout. Grab it now.
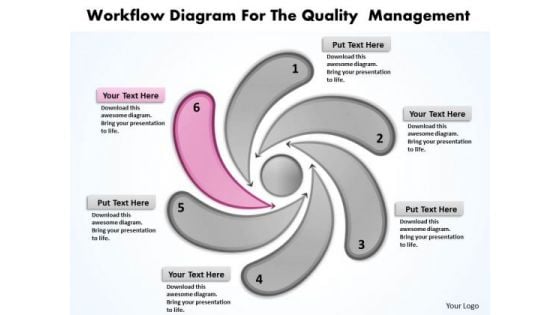
Business Charts Examples Workflow Diagram For The Quality Management PowerPoint Templates
We present our business charts examples workflow diagram for the quality management PowerPoint templates.Download our Advertising PowerPoint Templates because you know the path so show the way. Download and present our Business PowerPoint Templates because you can Flutter your wings and enchant the world. Impress them with the innate attractiveness of your thoughts and words. Use our Marketing PowerPoint Templates because you can blaze a brilliant trail from point to point. Use our Finance PowerPoint Templates because you should take your team soaring to the pinnacle they crave. Download and present our Shapes PowerPoint Templates because you have the ability to judge Which out of late have been proving to be a hassle.Use these PowerPoint slides for presentations relating to Abstract, Background, Buttons, Clean, Color, Communication, Concept, Conceptual, Design, Diagram, Direction, Elements, Exchange, Flow, Flowchart, Graph, Graphic, Icon, Illustration, Internet, Pointing, Precise, Process, Red, Sign, Simple, Symbol, Template, Web Graphics, Web Icons. The prominent colors used in the PowerPoint template are Pink, Gray, Black. PowerPoint presentation experts tell us our business charts examples workflow diagram for the quality management PowerPoint templates will make the presenter successul in his career/life. Professionals tell us our Communication PowerPoint templates and PPT Slides are Festive. People tell us our business charts examples workflow diagram for the quality management PowerPoint templates are Pretty. We assure you our Clean PowerPoint templates and PPT Slides are Chic. PowerPoint presentation experts tell us our business charts examples workflow diagram for the quality management PowerPoint templates are Delightful. Professionals tell us our Clean PowerPoint templates and PPT Slides are Bright. Restructure your organization with our Business Charts Examples Workflow Diagram For The Quality Management PowerPoint Templates. Download without worries with our money back guaranteee.
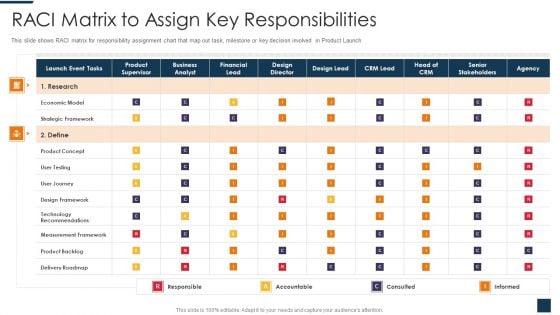
Go To Market Strategy For New Product RACI Matrix To Assign Key Responsibilities Microsoft PDF
This slide shows RACI matrix for responsibility assignment chart that map out task, milestone or key decision involved in Product Launch. Deliver an awe inspiring pitch with this creative go to market strategy for new product raci matrix to assign key responsibilities microsoft pdf bundle. Topics like research, economic model, design framework, technology, measurement framework can be discussed with this completely editable template. It is available for immediate download depending on the needs and requirements of the user.
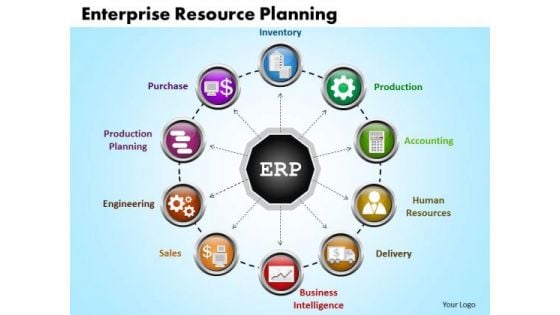
Business Circle Charts PowerPoint Templates Business Enterprise Resource Planning Ppt Slides
Business Circle Charts PowerPoint Templates Business Enterprise Resource Planning PPT Slides-A wonderful graphics to make a PowerPoint presentation on Enterprise Resource Planning-Business Circle Charts PowerPoint Templates Business Enterprise Resource Planning PPT Slides-This template can be used for presentations relating to 3d, Arrow, Blueprint, Business, Circle, Cleverness, Commerce, Company, Competence, Concept, Constructive, Corporate, Create, Creative, Creativity, Decision, Design, Develop, Device, Discover, Earn, Enterprise, Finance, Goal, Idea, Imaginative, Ingenious, Innovative, Inspiration, Inspire, Inventive, Job, Management, Market Convince your customers that you care. Express your commitment through our Business Circle Charts PowerPoint Templates Business Enterprise Resource Planning Ppt Slides.
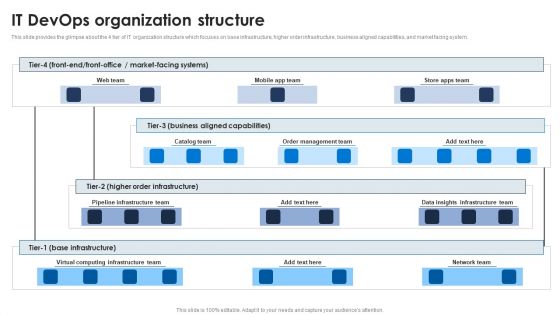
It Devops Organization Structure Ppt PowerPoint Presentation Diagram Graph Charts PDF
This slide provides the glimpse about the 4 tier of IT organization structure which focuses on base infrastructure, higher order infrastructure, business aligned capabilities, and market facing system. Do you have an important presentation coming up Are you looking for something that will make your presentation stand out from the rest Look no further than It Devops Organization Structure Ppt PowerPoint Presentation Diagram Graph Charts PDF. With our professional designs, you can trust that your presentation will pop and make delivering it a smooth process. And with Slidegeeks, you can trust that your presentation will be unique and memorable. So why wait Grab It Devops Organization Structure Ppt PowerPoint Presentation Diagram Graph Charts PDF today and make your presentation stand out from the rest.
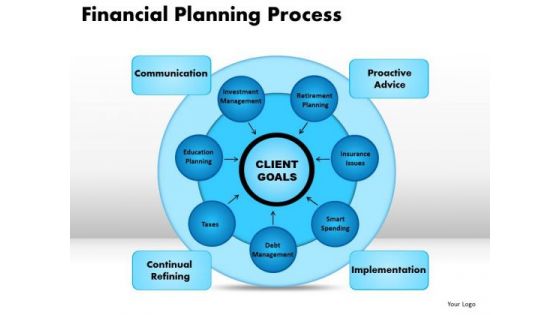
Business Circle Charts PowerPoint Templates Business Financial Planning Process Ppt Slides
Business Circle Charts PowerPoint Templates Business Financial Planning Process PPT Slides-This PowerPoint diagram shows transformations from one stage to others stage of Financial Planning Process-Business Circle Charts PowerPoint Templates Business Financial Planning Process PPT Slides-This template can be used for presentations relating to Abstract, Action, Business, Chart, Commerce, Competitor, Components, Concept, Conceptual, Design, Diagram, Executive, Financial, Goals, Guide, Guidelines, Hierarchy, Icon, Idea, Illustration, Manage, Management, Marketing, Mind, Mission, Model, Operations, Organization, Performance, Plan, Planning, Process Our Business Circle Charts PowerPoint Templates Business Financial Planning Process Ppt Slides team love fact finding missions. They enjoy bringing the truth to you.
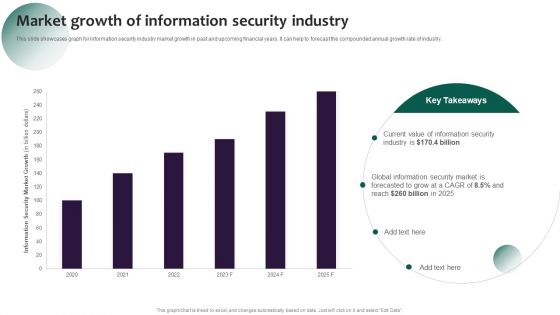
Information Systems Security And Risk Management Plan Market Growth Of Information Security Industry Designs PDF
This slide showcases graph for information security industry market growth in past and upcoming financial years. It can help to forecast the compounded annual growth rate of industry. Formulating a presentation can take up a lot of effort and time, so the content and message should always be the primary focus. The visuals of the PowerPoint can enhance the presenters message, so our Information Systems Security And Risk Management Plan Market Growth Of Information Security Industry Designs PDF was created to help save time. Instead of worrying about the design, the presenter can concentrate on the message while our designers work on creating the ideal templates for whatever situation is needed. Slidegeeks has experts for everything from amazing designs to valuable content, we have put everything into Information Systems Security And Risk Management Plan Market Growth Of Information Security Industry Designs PDF
Bar Graph And Pie Charts For Business Reports Vector Icon Ppt PowerPoint Presentation Show Graphics Tutorials PDF
Pitch your topic with ease and precision using this bar graph and pie charts for business reports vector icon ppt powerpoint presentation show graphics tutorials pdf. This layout presents information on bar graph and pie charts for business reports vector icon. It is also available for immediate download and adjustment. So, changes can be made in the color, design, graphics or any other component to create a unique layout.
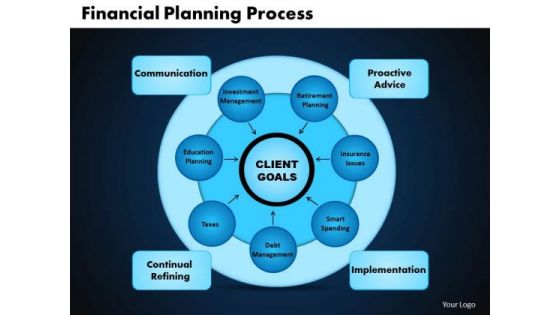
Business Circle Charts PowerPoint Templates Leadership Financial Planning Process Ppt Slides
Business Circle Charts PowerPoint Templates Leadership Financial Planning Process PPT Slides-This PowerPoint diagram shows transformations from one stage to others stage of Financial Planning Process-Business Circle Charts PowerPoint Templates Leadership Financial Planning Process PPT Slides-This template can be used for presentations relating to Abstract, Action, Business, Chart, Commerce, Competitor, Components, Concept, Conceptual, Design, Diagram, Executive, Financial, Goals, Guide, Guidelines, Hierarchy, Icon, Idea, Illustration, Manage, Management, Marketing, Mind, Mission, Model, Operations, Organization, Performance, Plan, Planning, Process The colour contrasts of our Business Circle Charts PowerPoint Templates Leadership Financial Planning Process Ppt Slides are aesthetically designed. They put the focus on key factors.
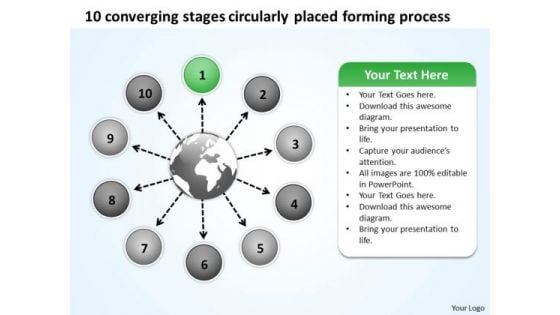
10 Converging Stages Circularly Placed Forming Process Charts And PowerPoint Slides
We present our 10 converging stages circularly placed forming process Charts and PowerPoint Slides.Download our Process and flows PowerPoint Templates because different people with differing ideas and priorities perform together to score. Download and present our Shapes PowerPoint Templates because this is a good example of the strength of teamwork. Present our Circle charts PowerPoint Templates because all for one and one for all. Download our Arrows PowerPoint Templates because you can Adorn them with your ideas and thoughts. Download our Ring charts PowerPoint Templates because the fruit of your labour is about to ripen.Use these PowerPoint slides for presentations relating to Arrow, blank, business, chart, circle, concept, connection, cycle, development, diagram, direction, element, environment, exchange, finance, financial, flow, graph, graphic, graphic presentation, group, icon, illustration, investment, isolated, isometric, market, motion, movement, organization, passive income, perspective, process, process chart, recycle, report, ring, sign, step, stock, success, symbol. The prominent colors used in the PowerPoint template are Blue light, Gray, Black. You can be sure our 10 converging stages circularly placed forming process Charts and PowerPoint Slides are Fun. Presenters tell us our connection PowerPoint templates and PPT Slides are Youthful. We assure you our 10 converging stages circularly placed forming process Charts and PowerPoint Slides are Fantastic. Customers tell us our cycle PowerPoint templates and PPT Slides are Clever. Presenters tell us our 10 converging stages circularly placed forming process Charts and PowerPoint Slides are the best it can get when it comes to presenting. You can be sure our chart PowerPoint templates and PPT Slides are Fun. Our 10 Converging Stages Circularly Placed Forming Process Charts And PowerPoint Slides team are exceedingly good. They have a clear assessment of what you need.
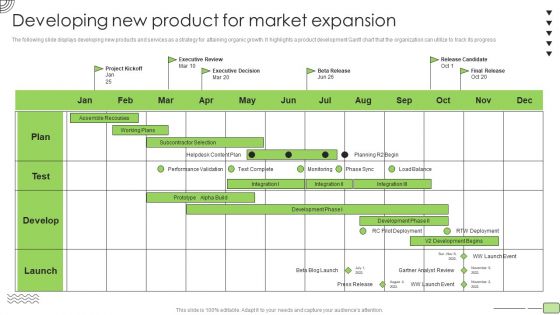
Organic Business Growth Strategies Developing New Product For Market Expansion Designs PDF
The following slide displays developing new products and services as a strategy for attaining organic growth. It highlights a product development Gantt chart that the organization can utilize to track its progress. Deliver and pitch your topic in the best possible manner with this Organic Business Growth Strategies Developing New Product For Market Expansion Designs PDF. Use them to share invaluable insights on Working Plans, Assemble Recourses, Development and impress your audience. This template can be altered and modified as per your expectations. So, grab it now.
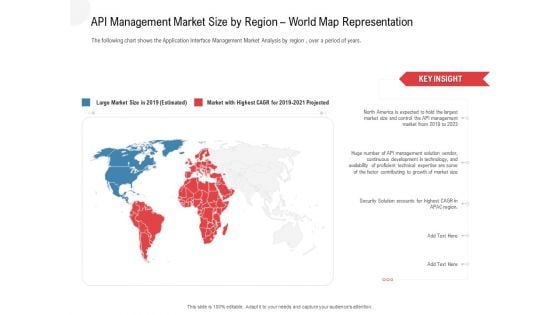
API Outline API Management Market Size By Region World Map Representation Themes PDF
The following chart shows the Application Interface Management Market Analysis by region, over a period of years. Presenting api outline api management market size by region world map representation themes pdf to provide visual cues and insights. Share and navigate important information on two stages that need your due attention. This template can be used to pitch topics like large market size in 2019, market with highest cagr for 2019 to 2021 projected. In addition, this PPT design contains high-resolution images, graphics, etc, that are easily editable and available for immediate download.

Competitor Market Share And Sales Revenues Ppt PowerPoint Presentation Professional Design Inspiration
This is a competitor market share and sales revenues ppt powerpoint presentation professional design inspiration. This is a four stage process. The stages in this process are your figures, development, business, marketing, graph.
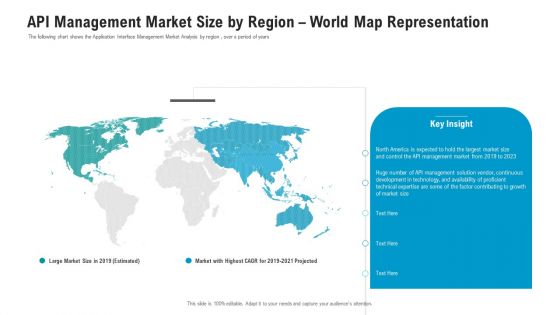
API Ecosystem API Management Market Size By Region World Map Representation Background PDF
The following chart shows the Application Interface Management Market Analysis by region , over a period of years. Presenting api ecosystem api management market size by region world map representation background pdf to provide visual cues and insights. Share and navigate important information on one stages that need your due attention. This template can be used to pitch topics like development, management, market, growth. In addtion, this PPT design contains high resolution images, graphics, etc, that are easily editable and available for immediate download.
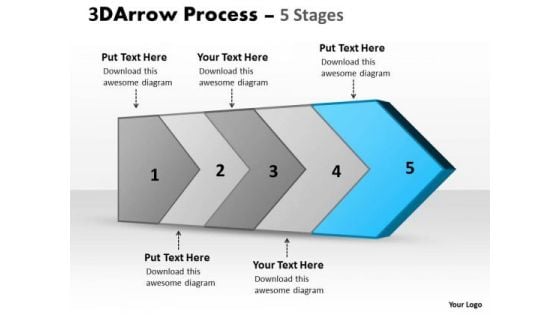
Ppt Background Five Stages Of Successful Free Enterprise PowerPoint Charts Plan 6 Image
We present our PPT Background five stages of successful free enterprise PowerPoint charts plan 6 Image. Use our Arrows PowerPoint Templates because, to your team you always raise a toast. Use our Business PowerPoint Templates because, There are various viable propositions available to further your commercial interests. Use our Shapes PowerPoint Templates because, the vision of being the market leader is clear to you. Use our Finance PowerPoint Templates because; Use them to help you organize the logic of your views. Use our Process and Flows PowerPoint Templates because, Brainstorming Light Bulbs:- The atmosphere in the workplace is electric. Use these PowerPoint slides for presentations relating to 3d, arrow, background, bullet, business, chart, checkmark, chevron, diagram, drop, eps10, financial, five, glass, graphic, gray, icon, illustration, management, point, process, project, reflection, set, shadow, stage, text, transparency, vector, white. The prominent colors used in the PowerPoint template are Blue, Gray, and Black Keep it coming with our Ppt Background Five Stages Of Successful Free Enterprise PowerPoint Charts Plan 6 Image. Your thoughts will continue ad infinitum.
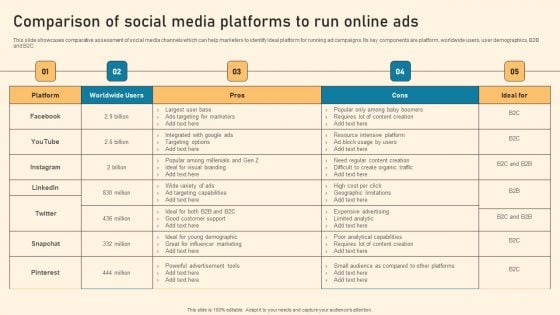
Comparison Of Social Media Platforms To Run Online Ads Ppt PowerPoint Presentation Diagram Graph Charts PDF
This slide showcases comparative assessment of social media channels which can help marketers to identify ideal platform for running ad campaigns. Its key components are platform, worldwide users, user demographics, B2B and B2C Slidegeeks is here to make your presentations a breeze with Comparison Of Social Media Platforms To Run Online Ads Ppt PowerPoint Presentation Diagram Graph Charts PDF With our easy to use and customizable templates, you can focus on delivering your ideas rather than worrying about formatting. With a variety of designs to choose from, you are sure to find one that suits your needs. And with animations and unique photos, illustrations, and fonts, you can make your presentation pop. So whether you are giving a sales pitch or presenting to the board, make sure to check out Slidegeeks first.
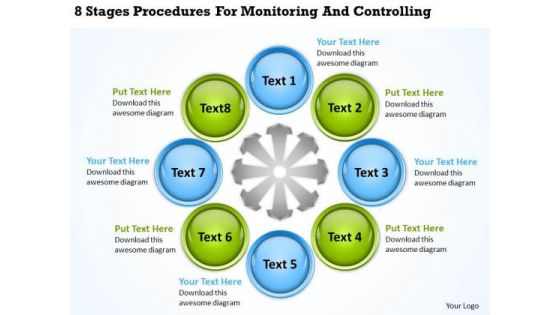
Business Charts 8 Stages Procedures For Monitoring And Controlling PowerPoint Slides
We present our business charts 8 stages procedures for monitoring and controlling PowerPoint Slides.Present our Circle Charts PowerPoint Templates because Our PowerPoint Templates and Slides will let your words and thoughts hit bullseye everytime. Present our Ring Charts PowerPoint Templates because Our PowerPoint Templates and Slides are created with admirable insight. Use them and give your group a sense of your logical mind. Use our Circle Charts PowerPoint Templates because It will get your audience in sync. Use our Process and Flows PowerPoint Templates because Our PowerPoint Templates and Slides will give you great value for your money. Be assured of finding the best projection to highlight your words. Download our Ring Charts PowerPoint Templates because Our PowerPoint Templates and Slides will let Your superior ideas hit the target always and everytime.Use these PowerPoint slides for presentations relating to Action, analysis, attitude, brainstorming, business, chart, classroom, concept,conceptual, conference, connection, corporate, design, diagram, direction,eight, employee, enhance, financial, formula, future, goal, graphic, guidelines,idea, link, management, market, marketing, mind, mindmap, organization,organize, plan, process, product, relation, render, solutions, strategy, success, successful, tactic, target, training, unity, vision. The prominent colors used in the PowerPoint template are Green lime, Blue, Gray. Our Business Charts 8 Stages Procedures For Monitoring And Controlling PowerPoint Slides capture the attention of your audience. With our money back guarantee you have nothing to lose.
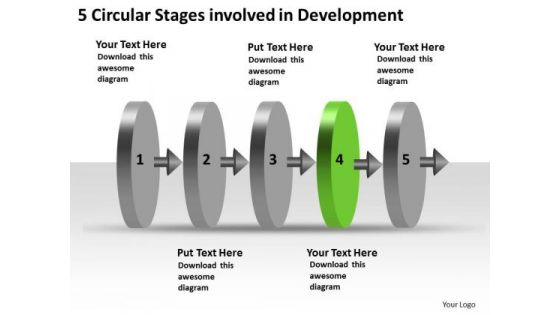
5 Circular Stages Involved Development What Is Flow Charts PowerPoint Templates
We present our 5 circular stages involved development what is flow charts PowerPoint templates.Download our Arrows PowerPoint Templates because getting it done may not be enough. Use our Process and Flows PowerPoint Templates because it shows to your group how they mesh together to drive the whole. Download and present our Shapes PowerPoint Templates because you have good reasons to back up the strength of your belief. Download our Business PowerPoint Templates because you have churned your mind and come upwith solutions. Present our Circle Charts PowerPoint Templates because Our Template designs are State of the Art.Use these PowerPoint slides for presentations relating to Abstract, Arrows, blank, business, chart, circular, circulation, concept, conceptual, design, diagram, empty, executive, icon, idea, illustration, management, map, mapping, model, numbers, organization, procedure, process, progression, resource, sequence, sequential, seven, stages, steps, strategy. The prominent colors used in the PowerPoint template are Green, Black, Gray. The feedback we get is that our 5 circular stages involved development what is flow charts PowerPoint templates are designed to make your presentations professional. People tell us our concept PowerPoint templates and PPT Slides are Nostalgic. We assure you our 5 circular stages involved development what is flow charts PowerPoint templates will help them to explain complicated concepts. Presenters tell us our chart PowerPoint templates and PPT Slides are designed by a team of presentation professionals. We assure you our 5 circular stages involved development what is flow charts PowerPoint templates are Multicolored. Use our blank PowerPoint templates and PPT Slides are Efficient. Give our 5 Circular Stages Involved Development What Is Flow Charts PowerPoint Templates catalogue a good look through. You will be enthralled by their appeal.

SEO Trend Charts With On Site Optimization Ppt PowerPoint Presentation Gallery Inspiration PDF
Pitch your topic with ease and precision using this seo trend charts with on site optimization ppt powerpoint presentation gallery inspiration pdf. This layout presents information on social media marketing, content creation, site optimization, local search optimization. It is also available for immediate download and adjustment. So, changes can be made in the color, design, graphics or any other component to create a unique layout.
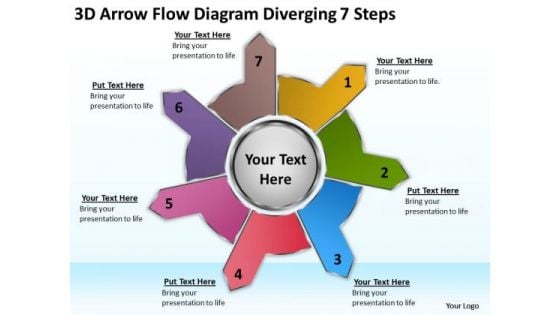
3d Arrow Flow Diagram Diverging 7 Steps Charts And Diagrams PowerPoint Templates
We present our 3d arrow flow diagram diverging 7 steps Charts and Diagrams PowerPoint templates.Use our Arrows PowerPoint Templates because you can Adorn them with your ideas and thoughts. Download and present our Business PowerPoint Templates because you are ready to flap your wings and launch off. All poised are you to touch the sky with glory. Download our Shapes PowerPoint Templates because all elements of the venture are equally critical. Use our Circle Charts PowerPoint Templates because you can Grab the attention of your team with this eye catching template signifying . Download and present our Flow Charts PowerPoint Templates because you have the right arrows in your quiver.Use these PowerPoint slides for presentations relating to 3d, abstract, arrow, art, background, blank, business, chart, circle, concept, connection, cycle, development, diagram, direction, element, environment, exchange, finance, flow, graph, graphic, group, icon, illustration, investment, isolated, isometric, market, motion, movement, organization, passive income, perspective, presentation, process, process chart, recycle, report, ring, sign, step, stock, success, symbol, teamwork, text, vector. The prominent colors used in the PowerPoint template are Yellow, Green, Blue. Customers tell us our 3d arrow flow diagram diverging 7 steps Charts and Diagrams PowerPoint templates are Adorable. PowerPoint presentation experts tell us our arrow PowerPoint templates and PPT Slides are specially created by a professional team with vast experience. They diligently strive to come up with the right vehicle for your brilliant Ideas. People tell us our 3d arrow flow diagram diverging 7 steps Charts and Diagrams PowerPoint templates are Great. People tell us our arrow PowerPoint templates and PPT Slides are Tranquil. Customers tell us our 3d arrow flow diagram diverging 7 steps Charts and Diagrams PowerPoint templates provide great value for your money. Be assured of finding the best projection to highlight your words. People tell us our business PowerPoint templates and PPT Slides are Graceful. Your audience will be absolutely attentive. Fascinate them with our 3d Arrow Flow Diagram Diverging 7 Steps Charts And Diagrams PowerPoint Templates.
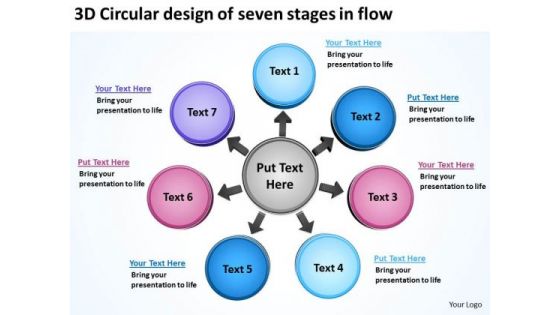
3d Circular Design Of Seven Stages In Flow Charts And Diagrams PowerPoint Templates
We present our 3d circular design of seven stages in flow Charts and Diagrams PowerPoint templates.Download our Circle Charts PowerPoint Templates because using our templates for your colleagues will impart knowledge to feed. Download our Arrows PowerPoint Templates because you have developed a vision of where you want to be a few years from now. Present our Business PowerPoint Templates because the great Bald headed Eagle embodies your personality. the eagle eye to seize upon the smallest of opportunities. Use our Shapes PowerPoint Templates because using our templates for your colleagues will impart knowledge to feed. Use our Flow Charts PowerPoint Templates because you can blaze a brilliant trail from point to point.Use these PowerPoint slides for presentations relating to 7, abstract, blank, business, central, centralized, chart, circular, circulation, concept, conceptual, converging, design, diagram, empty, executive, icon, idea, illustration, management, map, mapping, mba, model, numbers, organization, procedure, process, radial, relationship, resource, sequence, sequential, seven, strategy, template. The prominent colors used in the PowerPoint template are Pink, Blue, Purple. Customers tell us our 3d circular design of seven stages in flow Charts and Diagrams PowerPoint templates are Cheerful. PowerPoint presentation experts tell us our circulation PowerPoint templates and PPT Slides are Versatile. People tell us our 3d circular design of seven stages in flow Charts and Diagrams PowerPoint templates are Glamorous. People tell us our centralized PowerPoint templates and PPT Slides are Adorable. Customers tell us our 3d circular design of seven stages in flow Charts and Diagrams PowerPoint templates are Vintage. People tell us our business PowerPoint templates and PPT Slides will impress their bosses and teams. Get rid of banality with our 3d Circular Design Of Seven Stages In Flow Charts And Diagrams PowerPoint Templates. Take any boredom out of the equation.
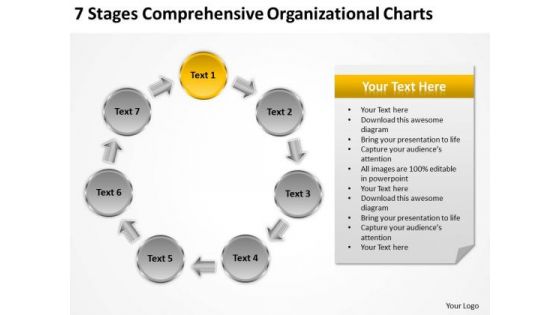
7 Stages Comprehensive Organizational Charts Business Plan Cover Page PowerPoint Slides
We present our 7 stages comprehensive organizational charts business plan cover page PowerPoint Slides.Use our Business PowerPoint Templates because Our PowerPoint Templates and Slides help you meet the demand of the Market. Just browse and pick the slides that appeal to your intuitive senses. Present our Arrows PowerPoint Templates because You have a driving passion to excel in your field. Our PowerPoint Templates and Slides will prove ideal vehicles for your ideas. Download our Circle Charts PowerPoint Templates because You are well armed with penetrative ideas. Our PowerPoint Templates and Slides will provide the gunpowder you need. Download and present our Process and Flows PowerPoint Templates because It will let you Set new benchmarks with our PowerPoint Templates and Slides. They will keep your prospects well above par. Download and present our Flow Charts PowerPoint Templates because It can be used to Set your controls for the heart of the sun. Our PowerPoint Templates and Slides will be the propellant to get you there.Use these PowerPoint slides for presentations relating to Act, arrow, blue, business, chart, check, circle, concept, control, cycle, design, development, diagram, do, engineering, evaluate, flow, flow-chart, flowchart, graphic,green, idea, infographic, iterative, life, life-cycle, lifecycle, management, method, model, pdca, plan, process, quality, research, schema,software, spiral, step, strategy, success, system, vector, white, work, workflow . The prominent colors used in the PowerPoint template are Orange, Gray, Black. Get them to applaud you with our 7 Stages Comprehensive Organizational Charts Business Plan Cover Page PowerPoint Slides. You will come out on top.
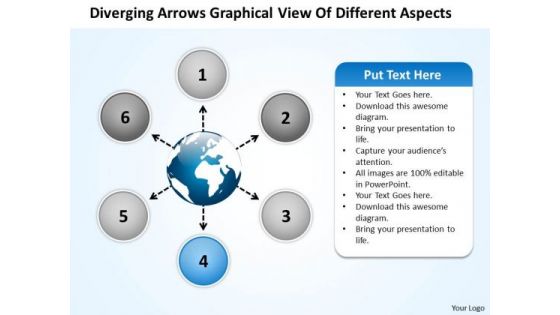
Arrows Graphical View Of Different Aspects Arrow Charts And Diagrams PowerPoint Templates
We present our arrows graphical view of different aspects arrow Charts and Diagrams PowerPoint templates.Download our Business PowerPoint Templates because the great Bald headed Eagle embodies your personality. the eagle eye to seize upon the smallest of opportunities. Download our Arrows PowerPoint Templates because it helps you to get your team in the desired sequence into the bracket. Download our Shapes PowerPoint Templates because the graphic is a symbol of growth and success. Present our Flow Charts PowerPoint Templates because this helps you to comprehend your plan to get the entire act together. Download and present our Process and Flows PowerPoint Templates because it can illustrate your chain of ideas focusing on that aspect or resource in order to enhance the quality of your product.Use these PowerPoint slides for presentations relating to Arrow, Business, Button, Chart, Circle, Company, Cross, Data, Design, Diagram, Direction, Document, Financial, Management, Marketing, Multiple, Plan, Presentation, Process, Results, Sphere, Template, Website, Wheel. The prominent colors used in the PowerPoint template are Blue, White, Gray. Presenters tell us our arrows graphical view of different aspects arrow Charts and Diagrams PowerPoint templates are Exuberant. We assure you our Cross PowerPoint templates and PPT Slides are Amazing. Presenters tell us our arrows graphical view of different aspects arrow Charts and Diagrams PowerPoint templates are the best it can get when it comes to presenting. Use our Circle PowerPoint templates and PPT Slides are Graceful. We assure you our arrows graphical view of different aspects arrow Charts and Diagrams PowerPoint templates are Second to none. You can be sure our Circle PowerPoint templates and PPT Slides are Delightful. Our Arrows Graphical View Of Different Aspects Arrow Charts And Diagrams PowerPoint Templates define the standards. Like you they excel at what they do.

Circular Interpretation Of 5 Steps Involved Procedure System Flow Charts PowerPoint Slides
We present our circular interpretation of 5 steps involved procedure system flow charts PowerPoint Slides.Use our Advertising PowerPoint Templates because,It depicts Rolling along while gathering profits along the way is the aim. Use our Circle Charts PowerPoint Templates because, This Diagram pinpoints the critical paths and areas in your process and set the timelines for their completion Use our Arrows PowerPoint Templates because,You can present your opinions in this field using our impressive templates. Use our Business PowerPoint Templates because,The fruits of your labour are beginning to show.Enlighten them on the great plans you have for their enjoyment Use our Shapes PowerPoint Templates because,Using this Ideas will roll along in your mind like billiard balls.Use these PowerPoint slides for presentations relating to Advertising, arrow, background, banner, bookmark, card, choice, concept, creative, design, direction, flow, idea, illustration, infographic, instruction, label, layout, manual, marketing, modern, next, number, offer, options, order, paper, process, product, promotion, sequence, simple, step, symbol, template, triangle, tutorial, vector, version, web. The prominent colors used in the PowerPoint template are Blue, Black, Gray Continue growing with our Circular Interpretation Of 5 Steps Involved Procedure System Flow Charts PowerPoint Slides. Download without worries with our money back guaranteee.
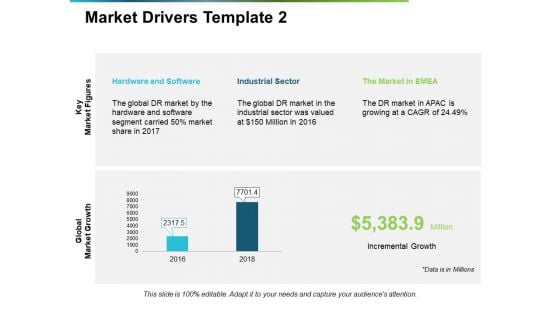
Market Drivers Hardware And Software Ppt PowerPoint Presentation Inspiration Graphics Design
This is a market drivers hardware and software ppt powerpoint presentation inspiration graphics design. This is a two stage process. The stages in this process are key market drivers, forecast, growth, bar graph, business.

Platforms To Run Paid Search Engine Campaign Ppt PowerPoint Presentation Diagram Graph Charts PDF
This slide showcases various platforms that can be leveraged by marketers for running paid search engine campaigns. Three major platforms for paid search engine ads are - Google, Bing and Yahoo Welcome to our selection of the Platforms To Run Paid Search Engine Campaign Ppt PowerPoint Presentation Diagram Graph Charts PDF. These are designed to help you showcase your creativity and bring your sphere to life. Planning and Innovation are essential for any business that is just starting out. This collection contains the designs that you need for your everyday presentations. All of our PowerPoints are 100 percent editable, so you can customize them to suit your needs. This multi purpose template can be used in various situations. Grab these presentation templates today.
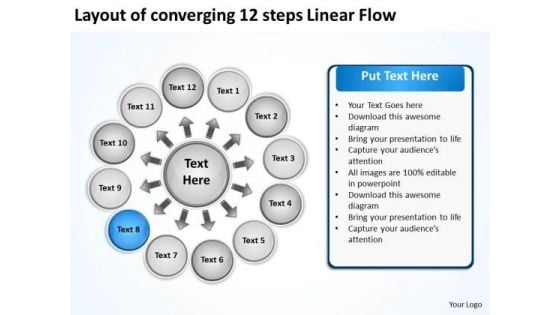
Layout Of Converging 12 Steps Linear Flow Charts And PowerPoint Templates
We present our layout of converging 12 steps linear flow Charts and PowerPoint templates.Download and present our Symbol PowerPoint Templates because our cleverly selected background hues are guaranteed to achieve this aim. Download our Business PowerPoint Templates because the fruits of your labour are beginning to show.Enlighten them on the great plans you have for their enjoyment. Download and present our Arrows PowerPoint Templates because it transmits this clarity of purpose onto the eager minds of your team. Use our Shapes PowerPoint Templates because with the help of our Slides you can Illustrate how each element flows seamlessly onto the next stage. Present our Process and Flows PowerPoint Templates because the lessons have been analyzed, studied and conclusions drawn.Use these PowerPoint slides for presentations relating to Arrows, Business, Central, Centralized, Chart, Circle, Circular, Circulation, Concept, Conceptual, Converging, Design, Diagram, Executive, Icon, Idea, Illustration, Management, Mapping, Model, Numbers, Organization, Outwards, Pointing, Procedure, Process, Radial, Radiating, Relationship, Resource, Sequence, Sequential, Square. The prominent colors used in the PowerPoint template are Blue, Gray, White. Use our layout of converging 12 steps linear flow Charts and PowerPoint templates are Fashionable. We assure you our Centralized PowerPoint templates and PPT Slides effectively help you save your valuable time. People tell us our layout of converging 12 steps linear flow Charts and PowerPoint templates are Breathtaking. PowerPoint presentation experts tell us our Circulation PowerPoint templates and PPT Slides are readymade to fit into any presentation structure. PowerPoint presentation experts tell us our layout of converging 12 steps linear flow Charts and PowerPoint templates are designed by a team of presentation professionals. Use our Chart PowerPoint templates and PPT Slides are Tasteful. Our designs are a colossal help. Maximize your gains with our Layout Of Converging 12 Steps Linear Flow Charts And PowerPoint Templates. Dont pass up this opportunity to shine.
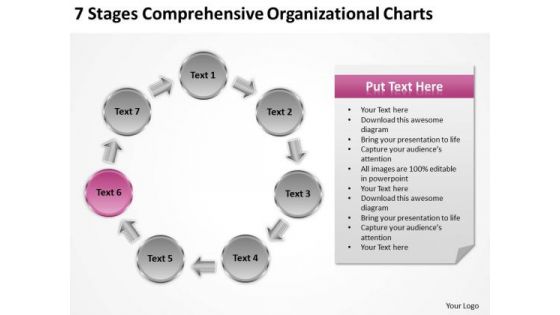
7 Stages Comprehensive Organizational Charts What Is Business Plan PowerPoint Slides
We present our 7 stages comprehensive organizational charts what is business plan PowerPoint Slides.Download our Circle Charts PowerPoint Templates because You can Connect the dots. Fan expectations as the whole picture emerges. Present our Business PowerPoint Templates because It can be used to Set your controls for the heart of the sun. Our PowerPoint Templates and Slides will be the propellant to get you there. Download and present our Process and Flows PowerPoint Templates because Our PowerPoint Templates and Slides will embellish your thoughts. See them provide the desired motivation to your team. Download and present our Shapes PowerPoint Templates because You have the co-ordinates for your destination of success. Let our PowerPoint Templates and Slides map out your journey. Download and present our Arrows PowerPoint Templates because It can Bubble and burst with your ideas.Use these PowerPoint slides for presentations relating to Act, arrow, blue, business, chart, check, circle, concept, control, cycle, design, development, diagram, do, engineering, evaluate, flow, flow-chart, flowchart, graphic,green, idea, infographic, iterative, life, life-cycle, lifecycle, management, method, model, pdca, plan, process, quality, research, schema,software, spiral, step, strategy, success, system, vector, white, work, workflow . The prominent colors used in the PowerPoint template are Pink, Gray, Black. Enliven the event with our 7 Stages Comprehensive Organizational Charts What Is Business Plan PowerPoint Slides. Create an atmosphere of festivity.
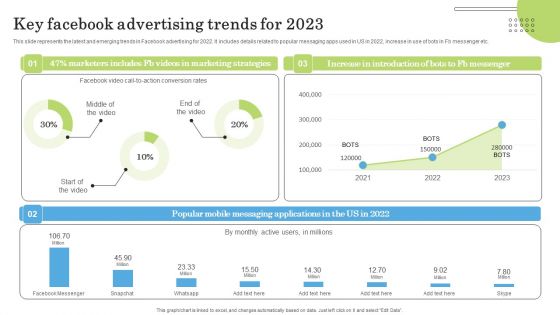
Key Facebook Advertising Trends For 2023 Ppt PowerPoint Presentation Diagram Graph Charts PDF
This slide represents the latest and emerging trends in Facebook advertising for 2022. It includes details related to popular messaging apps used in US in 2022, increase in use of bots in Fb messenger etc. Welcome to our selection of the Key Facebook Advertising Trends For 2023 Ppt PowerPoint Presentation Diagram Graph Charts PDF. These are designed to help you showcase your creativity and bring your sphere to life. Planning and Innovation are essential for any business that is just starting out. This collection contains the designs that you need for your everyday presentations. All of our PowerPoints are 100 percent editable, so you can customize them to suit your needs. This multi purpose template can be used in various situations. Grab these presentation templates today.
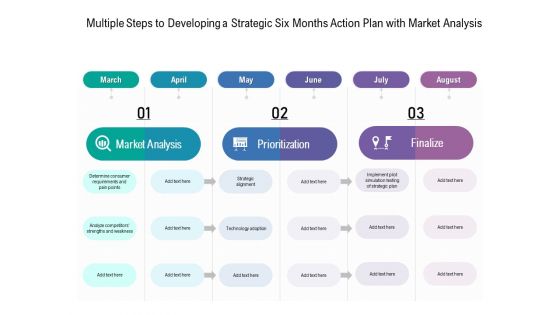
Multiple Steps To Developing A Strategic Six Months Action Plan With Market Analysis Inspiration
We present our multiple steps to developing a strategic six months action plan with market analysis inspiration. This PowerPoint layout is easy to edit so you can change the font size, font type, color, and shape conveniently. In addition to this, the PowerPoint layout is Google Slides compatible, so you can share it with your audience and give them access to edit it. Therefore, download and save this well researched multiple steps to developing a strategic six months action plan with market analysis inspiration in different formats like PDF, PNG, and JPG to smoothly execute your business plan.
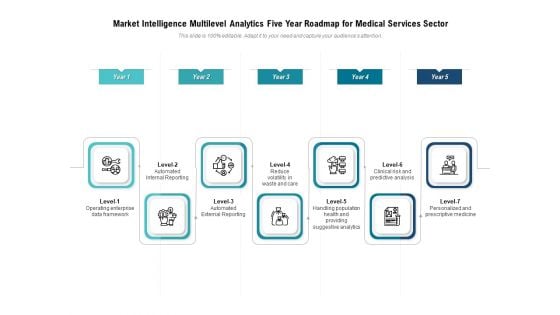
Market Intelligence Multilevel Analytics Five Year Roadmap For Medical Services Sector Introduction
We present our market intelligence multilevel analytics five year roadmap for medical services sector introduction. This PowerPoint layout is easy to edit so you can change the font size, font type, color, and shape conveniently. In addition to this, the PowerPoint layout is Google Slides compatible, so you can share it with your audience and give them access to edit it. Therefore, download and save this well researched market intelligence multilevel analytics five year roadmap for medical services sector introduction in different formats like PDF, PNG, and JPG to smoothly execute your business plan.
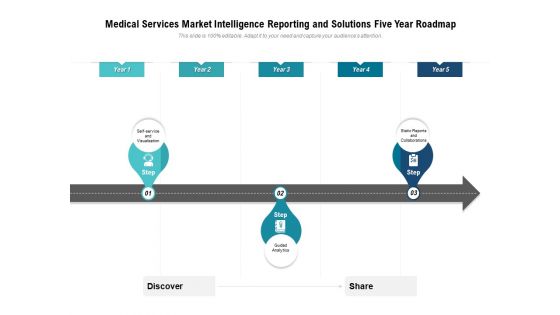
Medical Services Market Intelligence Reporting And Solutions Five Year Roadmap Formats
We present our medical services market intelligence reporting and solutions five year roadmap formats. This PowerPoint layout is easy to edit so you can change the font size, font type, color, and shape conveniently. In addition to this, the PowerPoint layout is Google Slides compatible, so you can share it with your audience and give them access to edit it. Therefore, download and save this well researched medical services market intelligence reporting and solutions five year roadmap formats in different formats like PDF, PNG, and JPG to smoothly execute your business plan.
Medical Services Market Intelligence Reporting And Solutions Half Yearly Roadmap Icons
Introducing our medical services market intelligence reporting and solutions half yearly roadmap icons. This PPT presentation is Google Slides compatible, therefore, you can share it easily with the collaborators for measuring the progress. Also, the presentation is available in both standard screen and widescreen aspect ratios. So edit the template design by modifying the font size, font type, color, and shapes as per your requirements. As this PPT design is fully editable it can be presented in PDF, JPG and PNG formats.
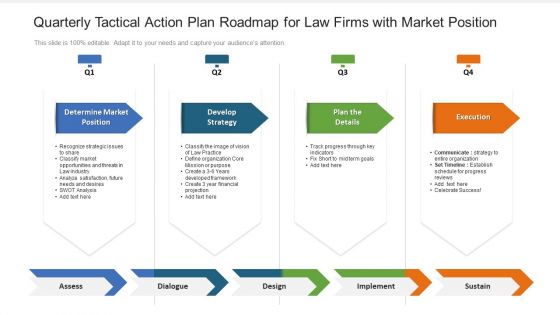
Quarterly Tactical Action Plan Roadmap For Law Firms With Market Position Ideas
Introducing our quarterly tactical action plan roadmap for law firms with market position ideas. This PPT presentation is Google Slides compatible, therefore, you can share it easily with the collaborators for measuring the progress. Also, the presentation is available in both standard screen and widescreen aspect ratios. So edit the template design by modifying the font size, font type, color, and shapes as per your requirements. As this PPT design is fully editable it can be presented in PDF, JPG and PNG formats.
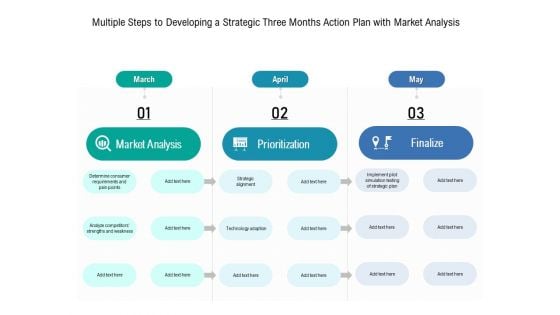
Multiple Steps To Developing A Strategic Three Months Action Plan With Market Analysis Summary
Presenting our innovatively structured multiple steps to developing a strategic three months action plan with market analysis summary Template. Showcase your roadmap process in different formats like PDF, PNG, and JPG by clicking the download button below. This PPT design is available in both Standard Screen and Widescreen aspect ratios. It can also be easily personalized and presented with modified font size, font type, color, and shapes to measure your progress in a clear way.


 Continue with Email

 Home
Home


