Marketing Plan Process
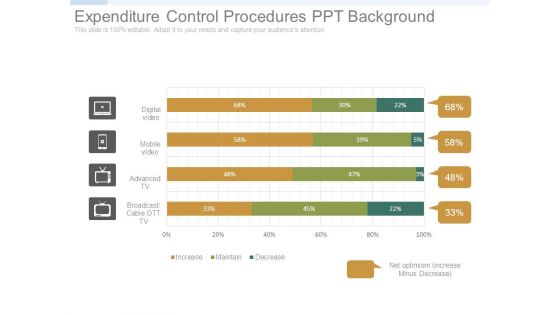
Expenditure Control Procedures Ppt Background
This is a expenditure control procedures ppt background. This is a four stage process. The stages in this process are digital video, mobile video, advanced tv, broadcast cable ott tv, increase, maintain, decrease, net optimism increase minus decrease.
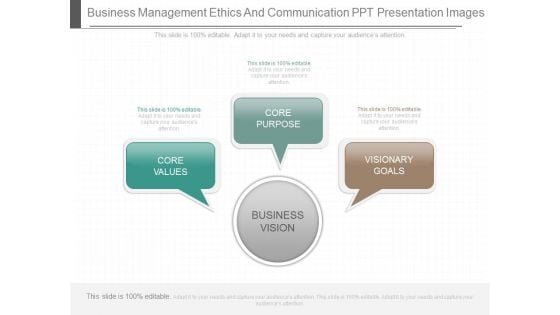
Business Management Ethics And Communication Ppt Presentation Images
This is a business management ethics and communication ppt presentation images. This is a three stage process. The stages in this process are business vision, core values, core purpose, visionary goals.
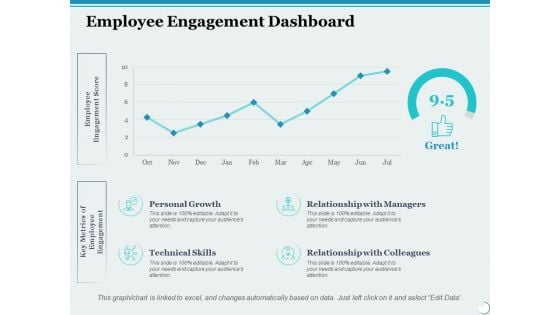
Employee Engagement Dashboard Ppt PowerPoint Presentation Inspiration Format
This is a employee engagement dashboard ppt powerpoint presentation inspiration format. This is a four stage process. The stages in this process are personal growth, relationship with managers, business, management, marketing.
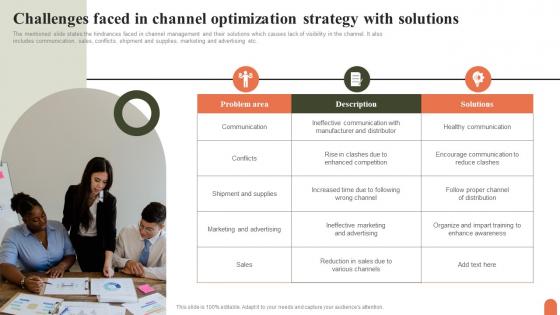
Challenges Faced In Channel Optimization Strategy With Solutions Slides Pdf
The mentioned slide states the hindrances faced in channel management and their solutions which causes lack of visibility in the channel. It also includes communication, sales, conflicts, shipment and supplies, marketing and advertising etc. Showcasing this set of slides titled Challenges Faced In Channel Optimization Strategy With Solutions Slides Pdf. The topics addressed in these templates are Communication, Shipment And Supplies, Marketing And Advertising. All the content presented in this PPT design is completely editable. Download it and make adjustments in color, background, font etc. as per your unique business setting. The mentioned slide states the hindrances faced in channel management and their solutions which causes lack of visibility in the channel. It also includes communication, sales, conflicts, shipment and supplies, marketing and advertising etc.

Critical Path Method Network Diagram Ppt PowerPoint Presentation Show Demonstration Cpb
This is a critical path method network diagram ppt powerpoint presentation show demonstration cpb. This is a five stage process. The stages in this process are critical path method network diagram.
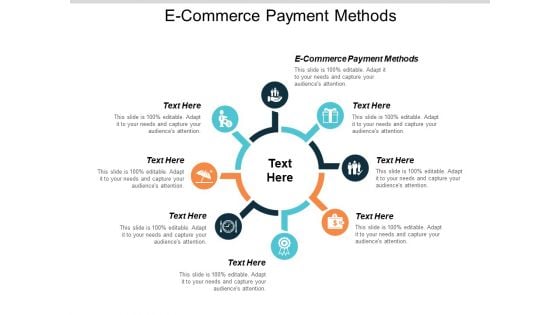
E Commerce Payment Methods Ppt PowerPoint Presentation Inspiration Example Topics Cpb
This is a e commerce payment methods ppt powerpoint presentation inspiration example topics cpb. This is a eight stage process. The stages in this process are ecommerce payment methods.
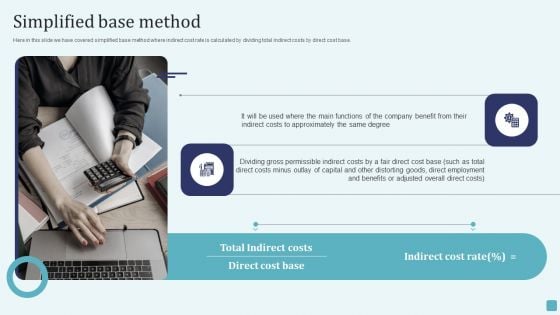
Simplified Base Method Stages Of Cost Allocation Procedure Background PDF
Here in this slide we have covered simplified base method where indirect cost rate is calculated by dividing total indirect costs by direct cost base. This Simplified Base Method Stages Of Cost Allocation Procedure Background PDF is perfect for any presentation, be it in front of clients or colleagues. It is a versatile and stylish solution for organizing your meetings. The Simplified Base Method Stages Of Cost Allocation Procedure Background PDF features a modern design for your presentation meetings. The adjustable and customizable slides provide unlimited possibilities for acing up your presentation. Slidegeeks has done all the homework before launching the product for you. So, do not wait, grab the presentation templates today.
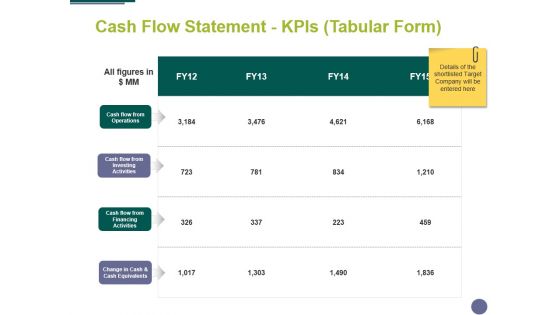
Cash Flow Statement Kpis Tabular Form Ppt PowerPoint Presentation Styles Design Inspiration
This is a cash flow statement kpis tabular form ppt powerpoint presentation styles design inspiration. This is a four stage process. The stages in this process are finance, analysis, management, business, marketing.
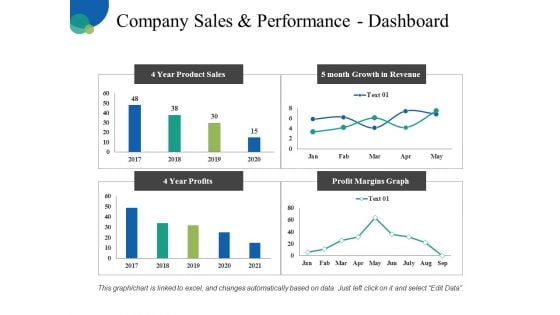
Company Sales And Performance Dashboard Ppt PowerPoint Presentation Pictures Infographic Template
This is a company sales and performance dashboard ppt powerpoint presentation pictures infographic template. This is a four stage process. The stages in this process are business, finance, analysis, management, marketing.
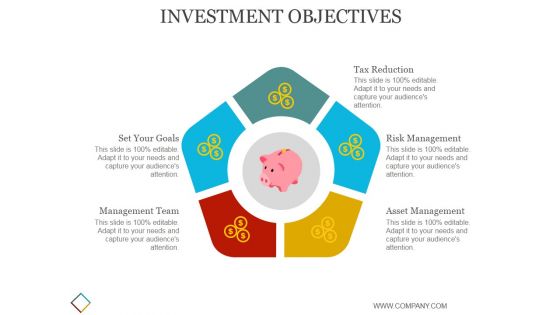
Investment Objectives Template 2 Ppt PowerPoint Presentation Topics
This is a investment objectives template 2 ppt powerpoint presentation topics. This is a five stage process. The stages in this process are tax reduction, risk management, asset management, set your goals, management team.
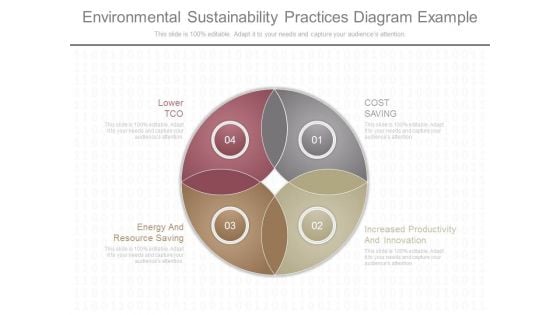
Environmental Sustainability Practices Diagram Example
This is a environmental sustainability practices diagram example. This is a four stage process. The stages in this process are lower tco, energy and resource saving, cost saving, increased productivity and innovation.
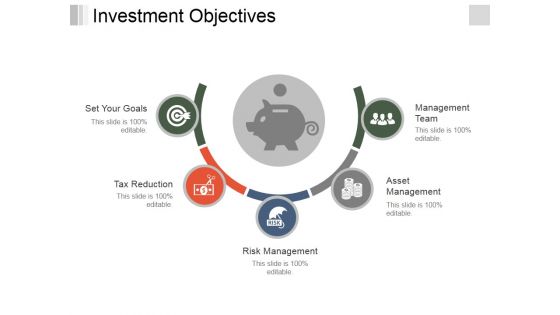
Investment Objectives Template 1 Ppt PowerPoint Presentation Styles Shapes
This is a investment objectives template 1 ppt powerpoint presentation styles shapes. This is a five stage process. The stages in this process are set your goals, tax reduction, risk management, asset management, management team.
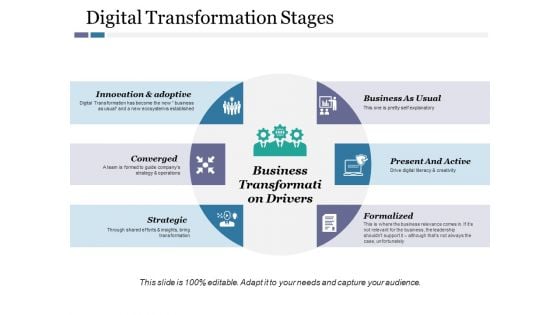
Digital Transformation Stages Ppt PowerPoint Presentation Layouts Templates
This is a digital transformation stages ppt powerpoint presentation layouts templates. This is a six stage process. The stages in this process are innovation and adoptive, converged, strategic, formalized, present and active, business as usual.
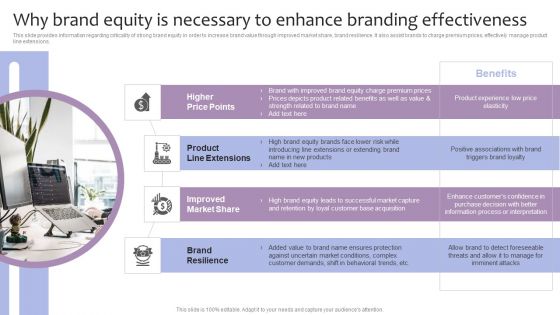
Strategic Brand Management Why Brand Equity Is Necessary To Enhance Branding Effectiveness Brochure PDF
This slide provides information regarding criticality of strong brand equity in order to increase brand value through improved market share, brand resilience. It also assist brands to charge premium prices, effectively manage product line extensions. This is a Strategic Brand Management Why Brand Equity Is Necessary To Enhance Branding Effectiveness Brochure PDF template with various stages. Focus and dispense information on four stages using this creative set, that comes with editable features. It contains large content boxes to add your information on topics like Higher Price Points, Product Line Extensions, Improved Market Share, Brand Resilience. You can also showcase facts, figures, and other relevant content using this PPT layout. Grab it now.
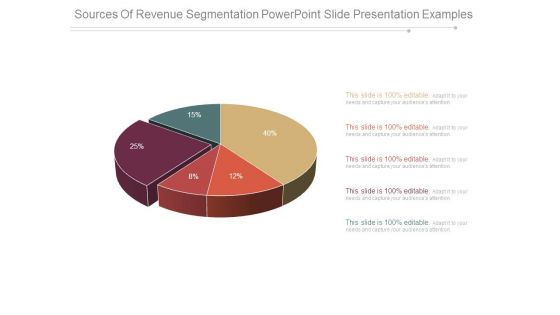
Sources Of Revenue Segmentation Powerpoint Slide Presentation Examples
This is a sources of revenue segmentation powerpoint slide presentation examples. This is a five stage process. The stages in this process are finance, success, business, marketing, percentage, pie chart.
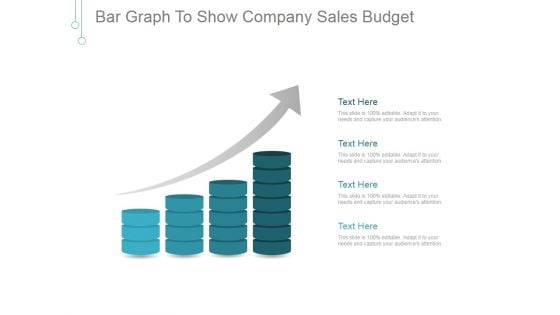
Bar Graph To Show Company Sales Budget Ppt PowerPoint Presentation Sample
This is a bar graph to show company sales budget ppt powerpoint presentation sample. This is a four stage process. The stages in this process are business, finance, growth, success, marketing, arrow.
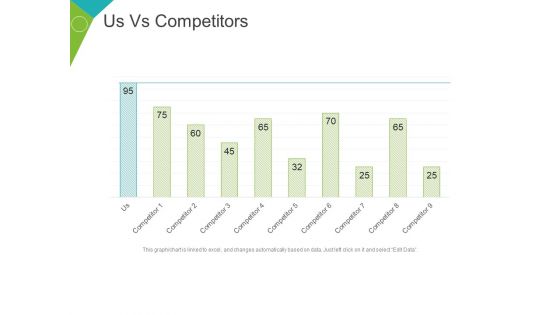
Us Vs Competitors Template 2 Ppt PowerPoint Presentation File Show
This is a us vs competitors template 2 ppt powerpoint presentation file show. This is a nine stage process. The stages in this process are competitor, graph, business, marketing, finance.
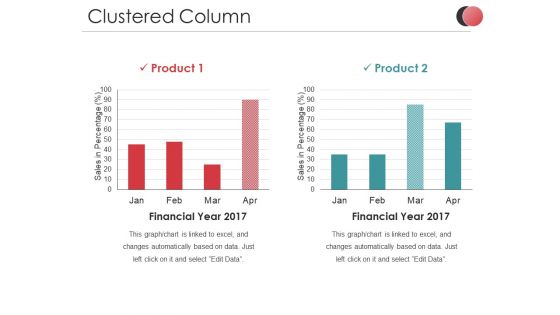
Clustered Column Ppt PowerPoint Presentation Slides Ideas
This is a clustered column ppt powerpoint presentation slides ideas. This is a two stage process. The stages in this process are sales in percentage, business, marketing, finance, graph.
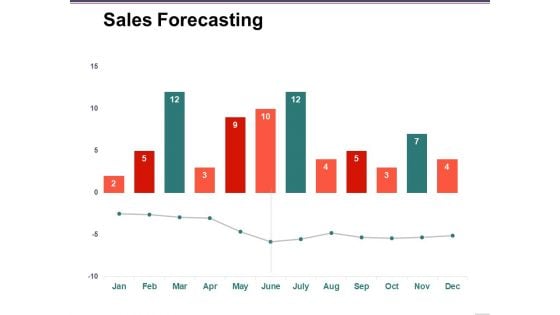
Sales Forecasting Template 2 Ppt PowerPoint Presentation Infographic Template Examples
This is a sales forecasting template 2 ppt powerpoint presentation infographic template examples. This is a two stage process. The stages in this process are forecasting, business, marketing, finance, graph.
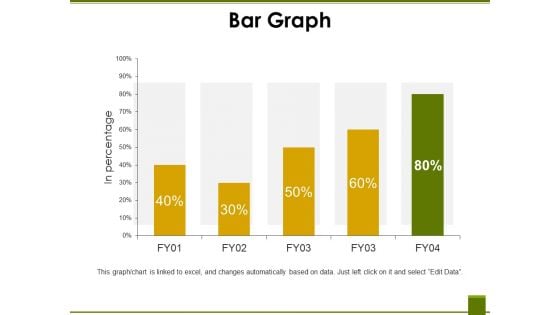
Bar Graph Template 2 Ppt PowerPoint Presentation Ideas Files
This is a bar graph template 2 ppt powerpoint presentation ideas files. This is a five stage process. The stages in this process are in percentage, business, marketing, finance, graph.
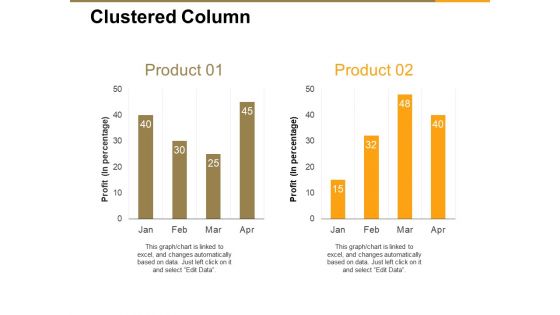
Clustered Column Ppt PowerPoint Presentation Inspiration Shapes
This is a clustered column ppt powerpoint presentation inspiration shapes. This is a two stage process. The stages in this process are profit in percentage, business, marketing, graph, finance.
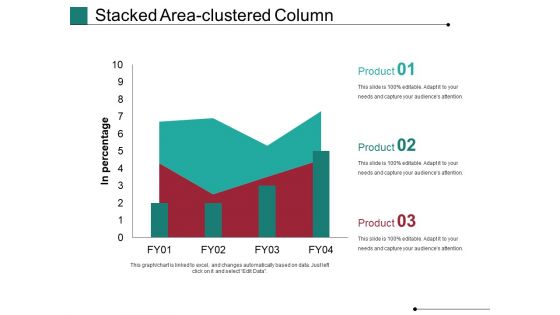
Stacked Area Clustered Column Ppt PowerPoint Presentation Ideas Show
This is a stacked area clustered column ppt powerpoint presentation ideas show. This is a three stage process. The stages in this process are in percentage, business, marketing, finance, graph.
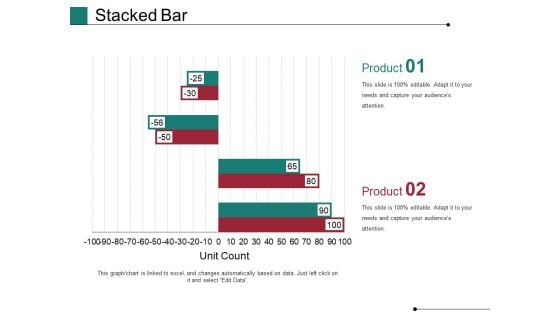
Stacked Bar Template 1 Ppt PowerPoint Presentation Show Slides
This is a stacked bar template 1 ppt powerpoint presentation show slides. This is a two stage process. The stages in this process are Unit Count, Business, Marketing, Graph, Finance.
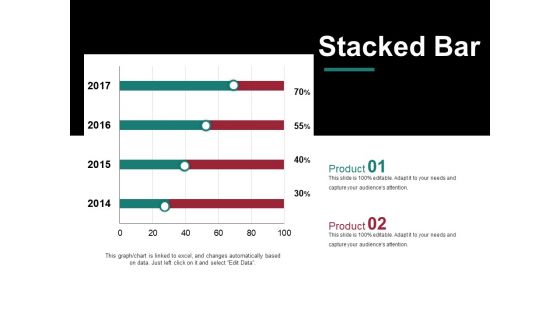
Stacked Bar Template 2 Ppt PowerPoint Presentation Model Graphic Images
This is a stacked bar template 2 ppt powerpoint presentation model graphic images. This is a two stage process. The stages in this process are business, years, marketing, percentage, finance.
Stacked Area Clustered Column Ppt PowerPoint Presentation Icon Aids
This is a stacked area clustered column ppt powerpoint presentation icon aids. This is a three stage process. The stages in this process are business, marketing, finance, bar, graph.
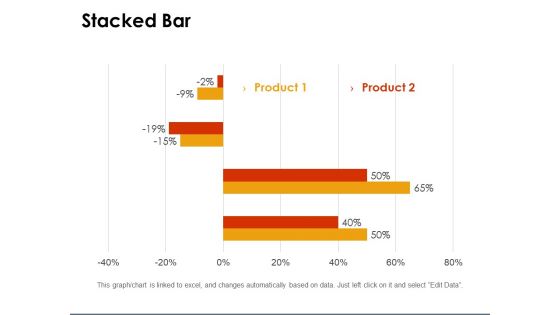
Stacked Bar Template 1 Ppt PowerPoint Presentation Gallery Clipart
This is a stacked bar template 1 ppt powerpoint presentation gallery clipart. This is a two stage process. The stages in this process are percentage, graph, business, marketing, finance.
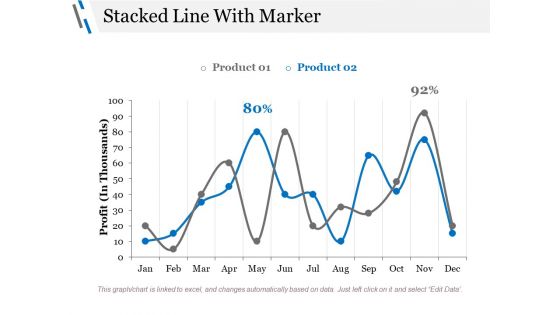
Stacked Line With Marker Ppt PowerPoint Presentation Styles Graphics Design
This is a stacked line with marker ppt powerpoint presentation styles graphics design. This is a three stage process. The stages in this process are profit, business, marketing, finance, percentage.
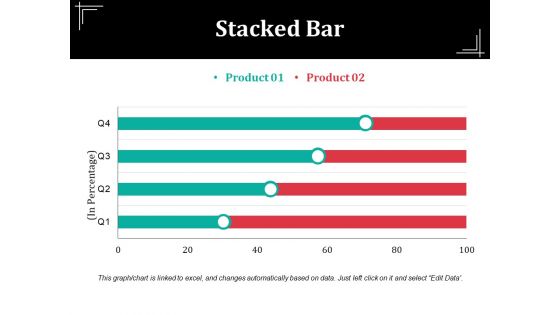
Stacked Bar Template Ppt PowerPoint Presentation Summary Visual Aids
This is a stacked bar template ppt powerpoint presentation summary visual aids. This is a three stage process. The stages in this process are unit count, business, marketing, finance, graph.
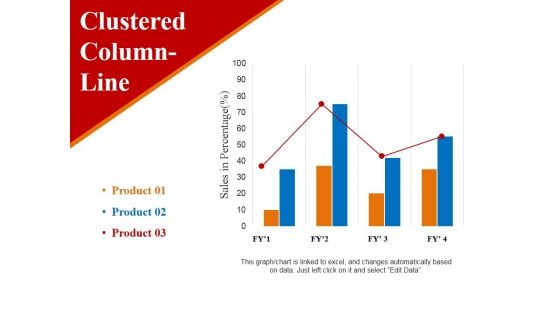
clustered column line ppt powerpoint presentation ideas example
This is a clustered column line ppt powerpoint presentation ideas example. This is a three stage process. The stages in this process are sales in percentage, business, marketing, finance, graph.
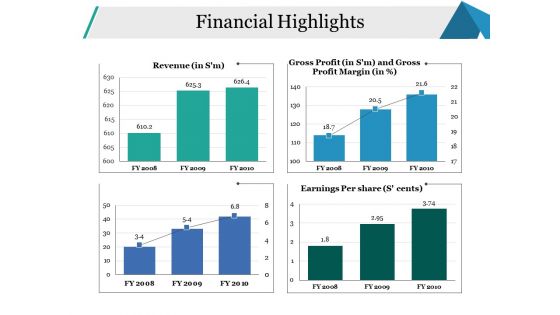
Financial Highlights Ppt PowerPoint Presentation File Background Designs
This is a financial highlights ppt powerpoint presentation file background designs. This is a four stage process. The stages in this process are revenue, earnings per share, financial, business, marketing.
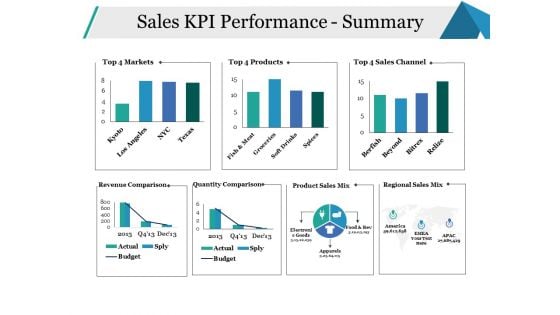
Sales KPI Performance Summary Ppt PowerPoint Presentation Infographics Model
This is a sales kpi performance summary ppt powerpoint presentation infographics model. This is a seven stage process. The stages in this process are sales channel, revenue comparison, quantity comparison, business, marketing.
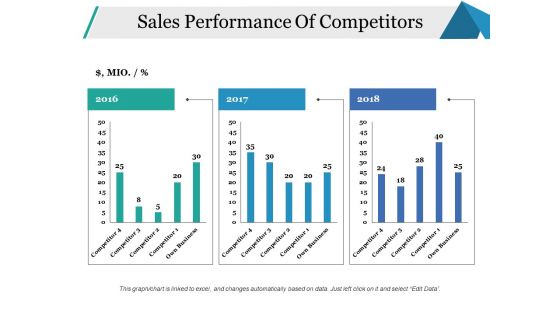
Sales Performance Of Competitors Ppt PowerPoint Presentation Portfolio Sample
This is a sales performance of competitors ppt powerpoint presentation portfolio sample. This is a three stage process. The stages in this process are business, marketing, finance, graph, years.
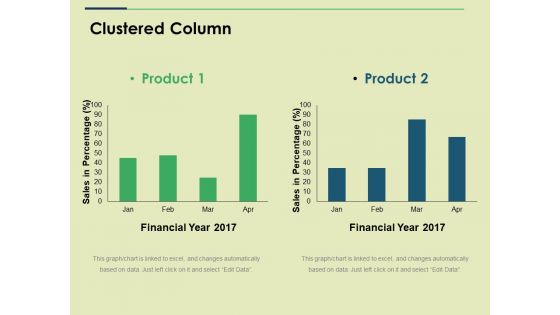
Clustered Column Ppt PowerPoint Presentation Show Graphics
This is a clustered column ppt powerpoint presentation show graphics. This is a two stage process. The stages in this process are financial year, sales in percentage, business, marketing, graph.
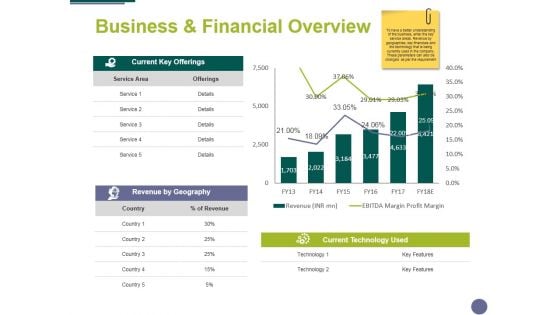
Business And Financial Overview Ppt PowerPoint Presentation Summary Format
This is a business and financial overview ppt powerpoint presentation summary format. This is a two stage process. The stages in this process are finance, analysis, marketing, business, compere.
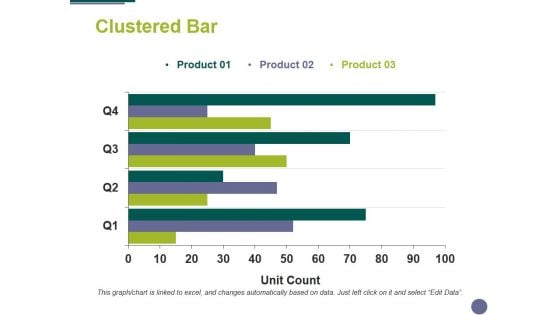
Clustered Bar Ppt PowerPoint Presentation Show Background Designs
This is a clustered bar ppt powerpoint presentation show background designs. This is a three stage process. The stages in this process are clustered bar, finance, analysis, business, marketing.
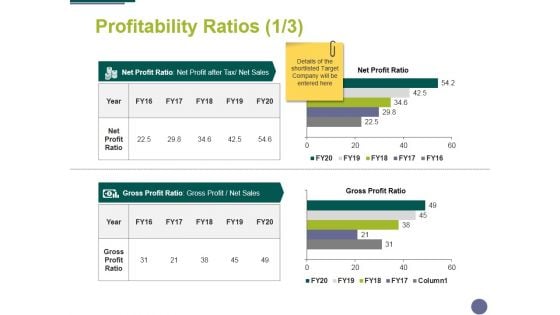
Profitability Ratios Template 1 Ppt PowerPoint Presentation Professional Skills
This is a profitability ratios template 1 ppt powerpoint presentation professional skills. This is a two stage process. The stages in this process are compere, finance, marketing, analysis, business.
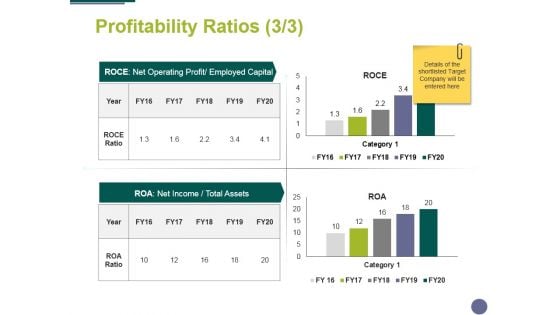
Profitability Ratios Template 3 Ppt PowerPoint Presentation Ideas Skills
This is a profitability ratios template 3 ppt powerpoint presentation ideas skills. This is a two stage process. The stages in this process are compere, finance, marketing, analysis, business.
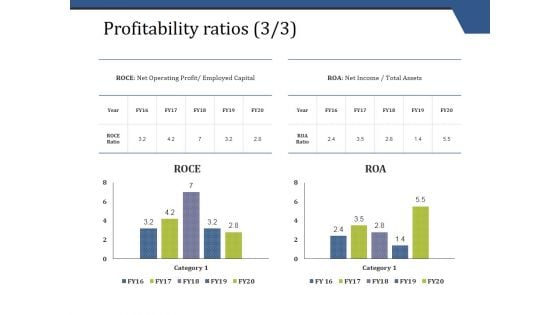
Profitability Ratios Template 3 Ppt PowerPoint Presentation Infographic Template Visual Aids
This is a profitability ratios template 3 ppt powerpoint presentation infographic template visual aids. This is a two stage process. The stages in this process are business, finance, marketing, analysis, investment.
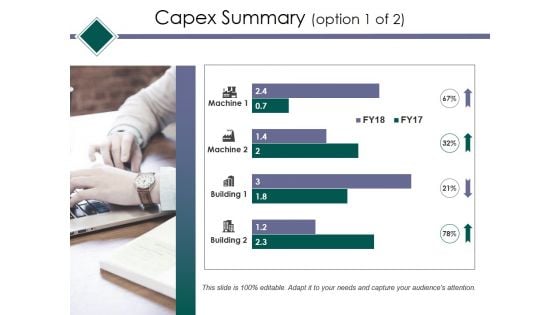
Capex Summary Template 1 Ppt PowerPoint Presentation Layouts Examples
This is a capex summary template 1 ppt powerpoint presentation layouts examples. This is a four stage process. The stages in this process are business, finance, marketing, analysis, investment.
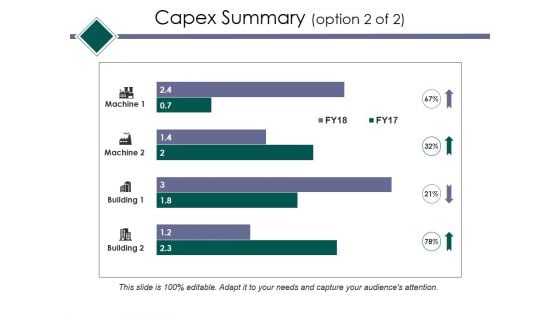
Capex Summary Template 2 Ppt PowerPoint Presentation Slides Template
This is a capex summary template 2 ppt powerpoint presentation slides template. This is a four stage process. The stages in this process are business, finance, marketing, analysis, investment.
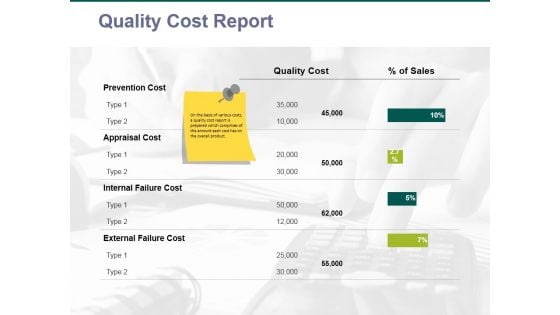
quality cost report ppt powerpoint presentation inspiration images
This is a quality cost report ppt powerpoint presentation inspiration images. This is a five stage process. The stages in this process are business, finance, marketing, analysis, quality cost.
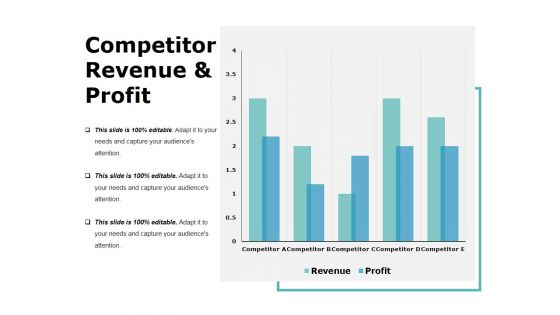
Competitor Revenue And Profit Template 1 Ppt PowerPoint Presentation Layouts Display
This is a competitor revenue and profit template 1 ppt powerpoint presentation layouts display. This is a five stage process. The stages in this process are business, bar graph, finance, marketing, analysis.
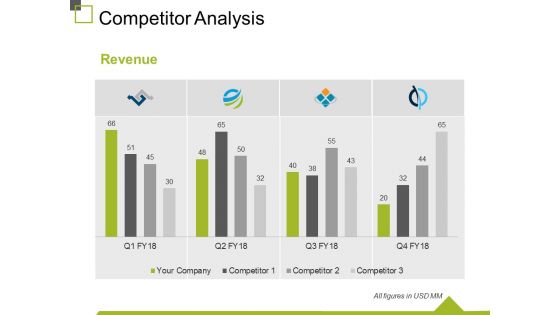
Competitor Analysis Template 1 Ppt PowerPoint Presentation File Grid
This is a competitor analysis template 1 ppt powerpoint presentation file grid. This is a four stage process. The stages in this process are finance, marketing, business, graph, analysis, revenue.
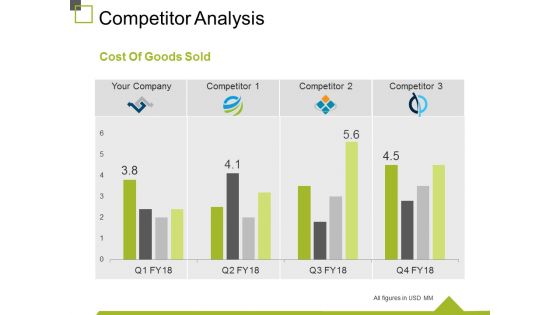
Competitor Analysis Template 3 Ppt PowerPoint Presentation Inspiration Visuals
This is a competitor analysis template 3 ppt powerpoint presentation inspiration visuals. This is a four stage process. The stages in this process are business, marketing, cost of goods sold, analysis, graph.
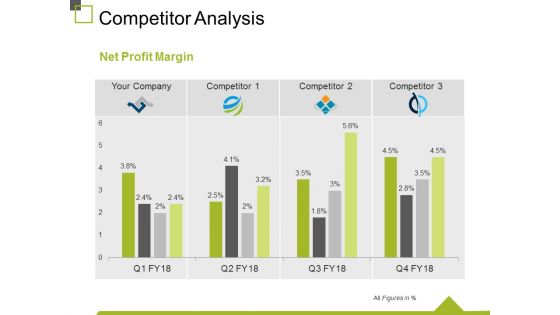
Competitor Analysis Template 4 Ppt PowerPoint Presentation Gallery Design Templates
This is a competitor analysis template 4 ppt powerpoint presentation gallery design templates. This is a four stage process. The stages in this process are business, marketing, analysis, graph, net profit margin.
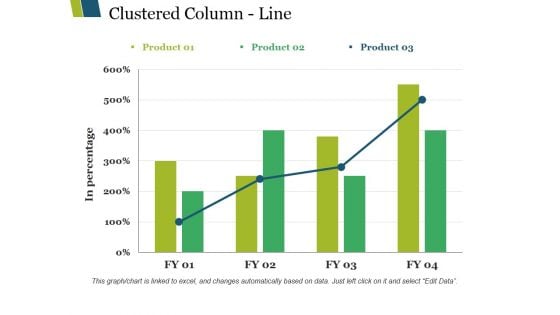
Clustered Column Line Ppt PowerPoint Presentation Infographics Background Images
This is a clustered column line ppt powerpoint presentation infographics background images. This is a three stage process. The stages in this process are clustered column line, finance, analysis, marketing, business.
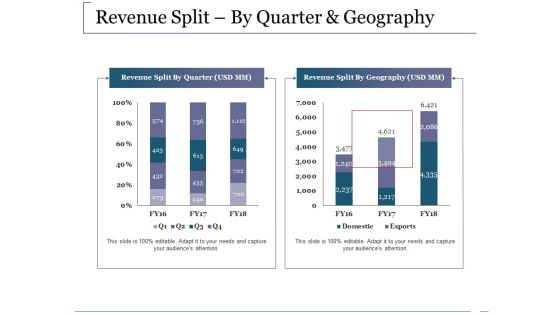
Revenue Split By Quarter And Geography Ppt PowerPoint Presentation Gallery Deck
This is a revenue split by quarter and geography ppt powerpoint presentation gallery deck. This is a two stage process. The stages in this process are business, marketing, graph, revenue split by quarter, revenue split by geography.
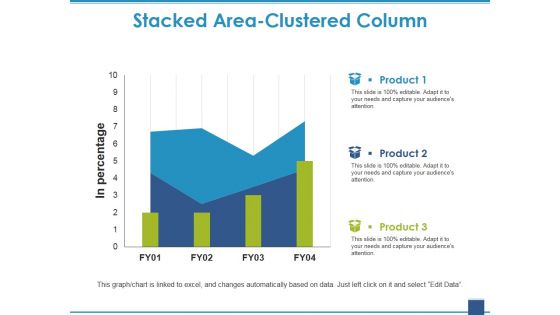
Stacked Area Clustered Column Ppt PowerPoint Presentation Slides Information
This is a stacked area clustered column ppt powerpoint presentation slides information. This is a three stage process. The stages in this process are stacked area, clustered column, growth, finance, marketing, business.
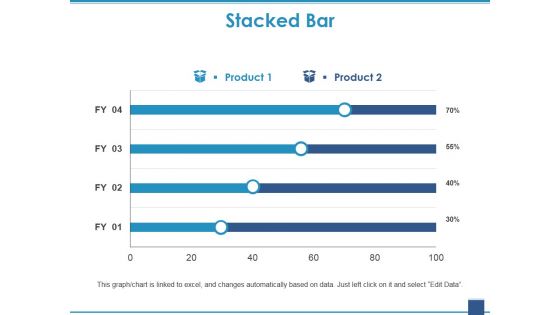
Stacked Bar Template 1 Ppt PowerPoint Presentation Gallery Deck
This is a stacked bar template 1 ppt powerpoint presentation gallery deck. This is a two stage process. The stages in this process are stacked bar, growth, finance, marketing, business.
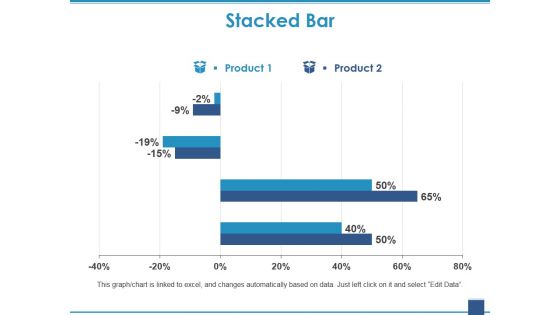
Stacked Bar Template 2 Ppt PowerPoint Presentation Show Clipart
This is a stacked bar template 2 ppt powerpoint presentation show clipart. This is a two stage process. The stages in this process are stacked bar, growth, finance, marketing, business, investment.
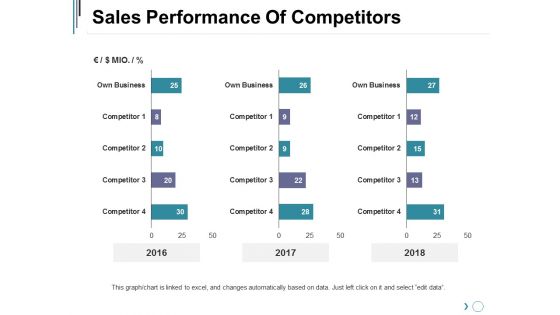
Sales Performance Of Competitors Ppt PowerPoint Presentation Inspiration Slideshow
This is a sales performance of competitors ppt powerpoint presentation inspiration slideshow. This is a three stage process. The stages in this process are business, marketing, graph, finance, years.
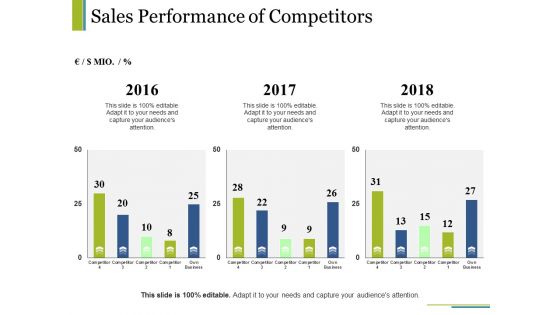
Sales Performance Of Competitors Ppt PowerPoint Presentation Portfolio Templates
This is a sales performance of competitors ppt powerpoint presentation portfolio templates. This is a three stage process. The stages in this process are business, marketing, percentage, graph, finance.
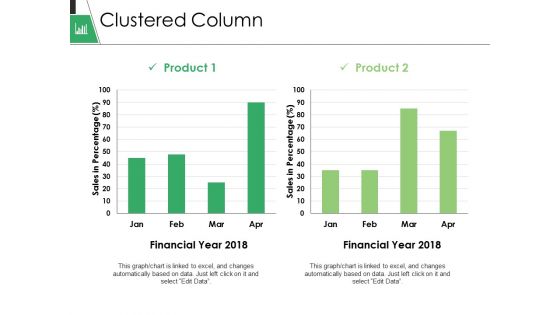
Clustered Column Ppt PowerPoint Presentation Gallery Format
This is a clustered column ppt powerpoint presentation gallery format. This is a two stage process. The stages in this process are business, marketing, graph, financial year, sales in percentage.
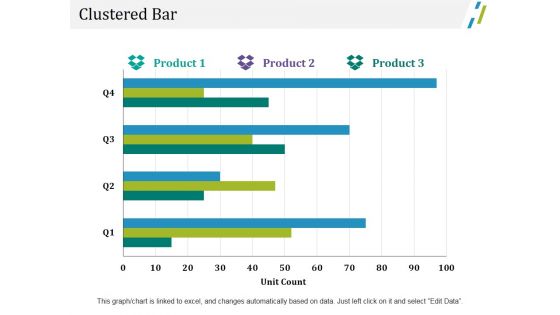
Clustered Bar Ppt PowerPoint Presentation Portfolio Graphic Images
This is a clustered bar ppt powerpoint presentation portfolio graphic images. This is a three stage process. The stages in this process are business, unit count, finance, marketing, graph.
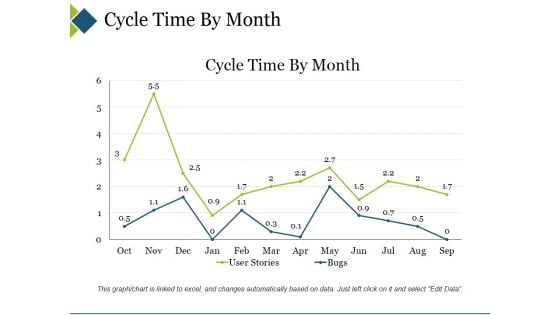
Cycle Time By Month Ppt PowerPoint Presentation Slides Ideas
This is a cycle time by month ppt powerpoint presentation slides ideas. This is a two stage process. The stages in this process are business, marketing, cycle time by month, finance, graph.
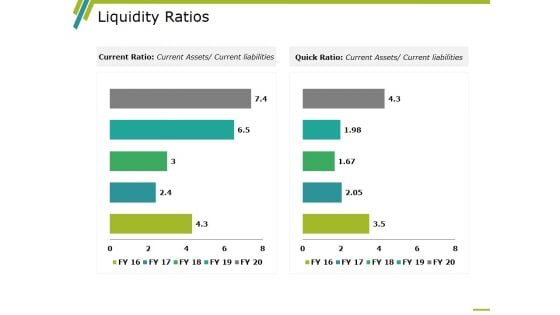
Liquidity Ratios Template 2 Ppt PowerPoint Presentation Ideas Microsoft
This is a liquidity ratios template 2 ppt powerpoint presentation ideas microsoft. This is a two stage process. The stages in this process are business, marketing, graph, year, current ratio, quick ratio.
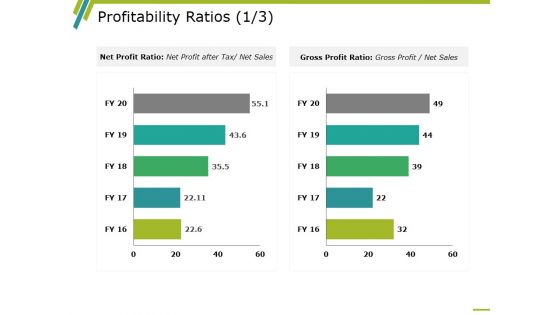
Profitability Ratios Template 1 Ppt PowerPoint Presentation Ideas Master Slide
This is a profitability ratios template 1 ppt powerpoint presentation ideas master slide. This is a two stage process. The stages in this process are business, net profit ratio, gross profit ratio, marketing, graph.
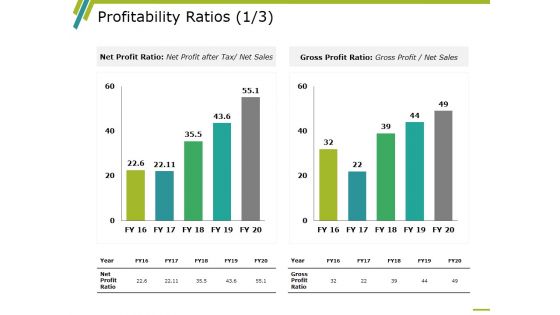
Profitability Ratios Template 2 Ppt PowerPoint Presentation Show Portfolio
This is a profitability ratios template 2 ppt powerpoint presentation show portfolio. This is a two stage process. The stages in this process are business, marketing, graph, net profit ratio, gross profit ratio, year.
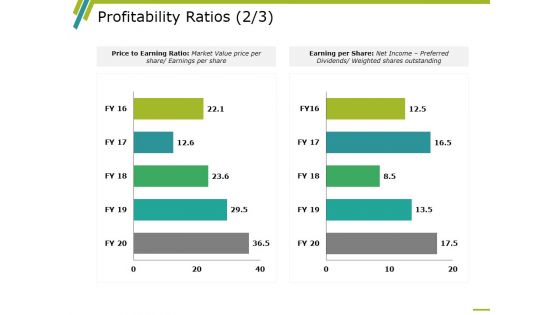
Profitability Ratios Template 3 Ppt PowerPoint Presentation Inspiration Backgrounds
This is a profitability ratios template 3 ppt powerpoint presentation inspiration backgrounds. This is a two stage process. The stages in this process are business, marketing, graph, price to earning ratio, earning per share.
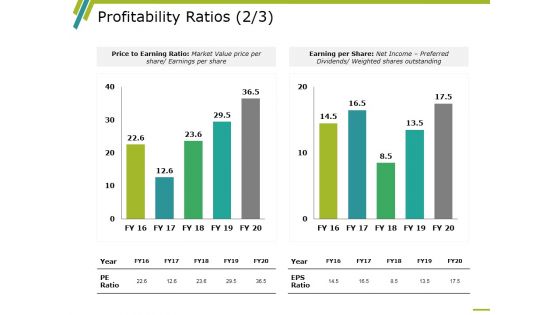
Profitability Ratios Template 4 Ppt PowerPoint Presentation Infographics Rules
This is a profitability ratios template 4 ppt powerpoint presentation infographics rules. This is a two stage process. The stages in this process are business, marketing, graph, price to earning ratio, earning per share.


 Continue with Email

 Home
Home


