Marketing Table
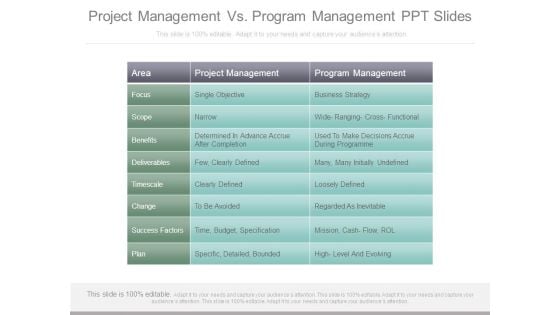
Project Management Vs Program Management Ppt Slides
This is a project management vs program management ppt slides. This is a three stage process. The stages in this process are area, project management, program management, scope, focus, benefits, success factors, deliverables, timescale, plan, single objective, narrow, determined in advance accrue after completion, few, clearly defined, clearly defined, to be avoided, time, budget, specification, specific, detailed, bounded, business strategy, wide ranging cross functional, used to make decisions accrue during programme, many, many initially undefined, loosely defined, regarded as inevitable, mission, cash flow, rol, high level and evolving.
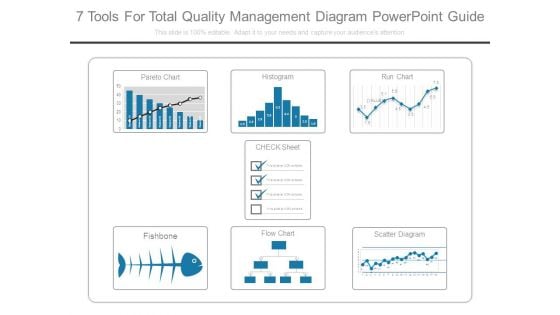
7 Tools For Total Quality Management Diagram Powerpoint Guide
This is a 7 tools for total quality management diagram powerpoint guide. This is a six stage process. The stages in this process are pareto chart, histogram, run chart, check sheet, fishbone, flow chart, scatter diagram.
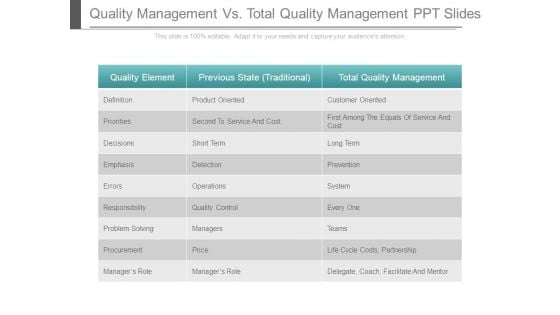
Quality Management Vs Total Quality Management Ppt Slides
This is a quality management vs total quality management ppt slides. This is a three stage process. The stages in this process are quality element, definition, priorities, decisions, emphasis, errors, responsibility, problem solving, procurement, manager role, product oriented, second to service and cost, short term, detection, operations, quality control, managers, price, customer oriented, first among the equals of service and cost, long term, prevention, system, every one, teams, life cycle costs, partnership, delegate, coach, facilitate and mentor.
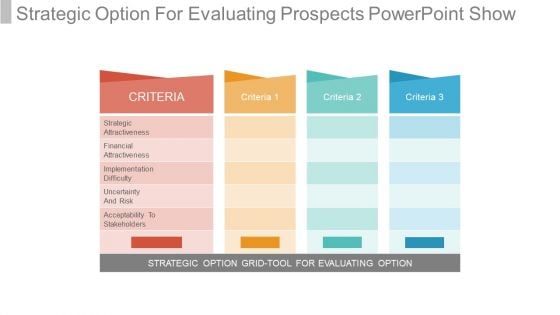
Strategic Option For Evaluating Prospects Powerpoint Show
This is a strategic option for evaluating prospects powerpoint show. This is a three stage process. The stages in this process are criteria, strategic attractiveness, financial attractiveness, implementation difficulty, uncertainty and risk, acceptability to stakeholders, strategic option grid tool for evaluating option.

Competition Competitor Identification Plan Powerpoint Ideas
This is a competition competitor identification plan powerpoint ideas. This is a four stage process. The stages in this process are key national competitors, key national competitors, substitutes, new entrants.
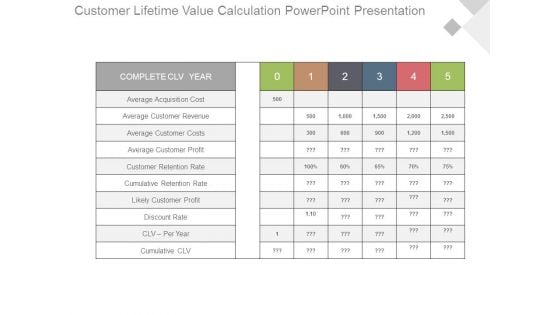
Customer Lifetime Value Calculation Powerpoint Presentation
This is a customer lifetime value calculation powerpoint presentation. This is a five stage process. The stages in this process are complete clv year, average acquisition cost, average customer revenue, average customer costs, average customer profit, customer retention rate, cumulative retention rate, likely customer profit, discount rate, clv per year, cumulative clv.
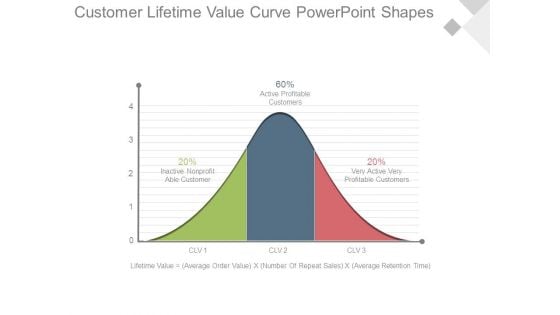
Customer Lifetime Value Curve Powerpoint Shapes
This is a customer lifetime value curve powerpoint shapes. This is a three stage process. The stages in this process are 20 percent inactive non profitable customer, 60 percent active profitable customers, 20 percent very active very profitable customers, clv.
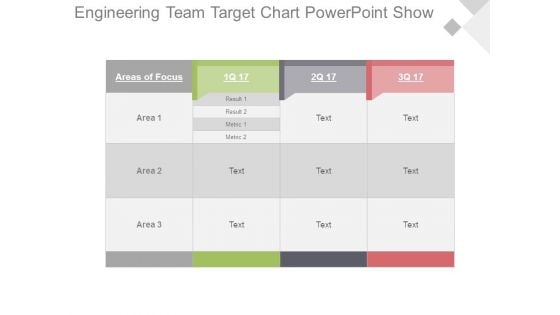
Engineering Team Target Chart Powerpoint Show
This is a engineering team target chart powerpoint show. This is a four stage process. The stages in this process are areas of focus, result, metric, area.

Financials Stretch Plan Kpi Analysis Powerpoint Slide Show
This is a financials stretch plan kpi analysis powerpoint slide show. This is a five stage process. The stages in this process are kpi1, kpi1, kpi3, revenue, cost of sales, gross profit, customer acquisition cost, other operating cost expense, operating profit, change in cash, ending cash, employees ftes.
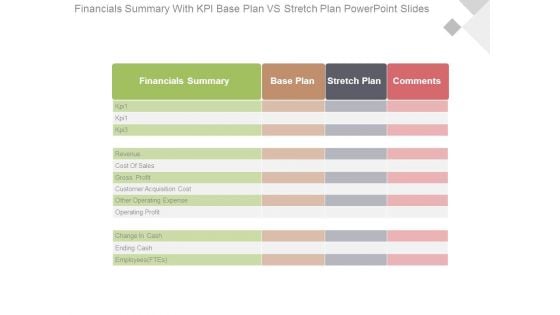
Financials Summary With Kpi Base Plan Vs Stretch Plan Powerpoint Slides
This is a financials summary with kpi base plan vs stretch plan powerpoint slides. This is a four stage process. The stages in this process are financials summary, base plan, stretch plan, comments, kpi 1, kpi 3, revenue, cost of sales, gross profit, customer acquisition cost, other operating expense, operating profit, change in cash, ending cash, employees ftes.
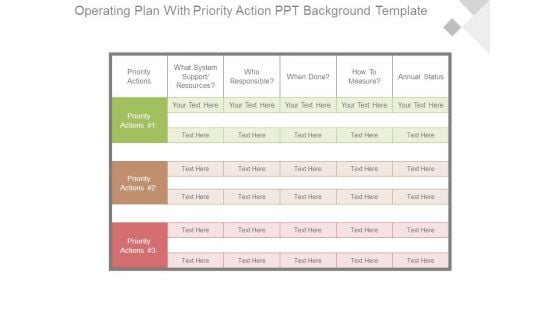
Operating Plan With Priority Action Ppt Background Template
This is a operating plan with priority action ppt background template. This is a three stage process. The stages in this process are objective, what system support resources, who responsible, when done, how to measure, annual status, priority actions.

Product Roadmap With Launch Planning Ppt Diagrams
This is a product roadmap with launch planning ppt diagrams. This is a three stage process. The stages in this process are product family, product.
Team Goals With Introduction Ppt Icon
This is a team goals with introduction ppt icon. This is a five stage process. The stages in this process are team goals, name, john smith, jessica smith, mariya smith, tom smith, carol smith, objective, jan, feb, mar, apr, may, jun, jul, aug.
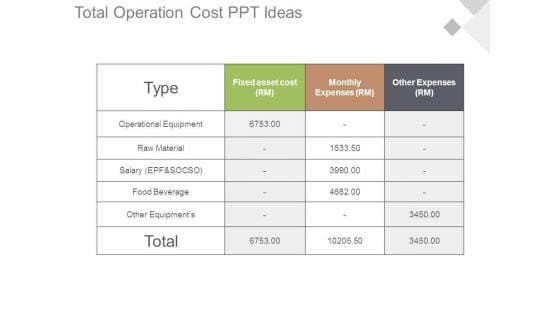
Total Operation Cost Ppt Ideas
This is a total operation cost ppt ideas. This is a three stage process. The stages in this process are type, fixed asset cost rm, monthly expenses rm, other expenses rm, operational equipment, raw material, salary epf and socso, food beverage, other equipments, total.
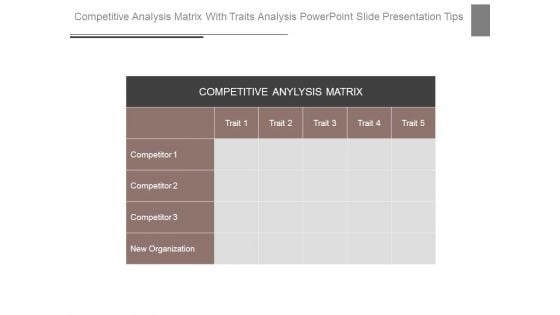
Competitive Analysis Matrix With Traits Analysis Powerpoint Slide Presentation Tips
This is a competitive analysis matrix with traits analysis powerpoint slide presentation tips. This is a five stage process. The stages in this process are competitive analysis matrix, competitor, new organization, trait.
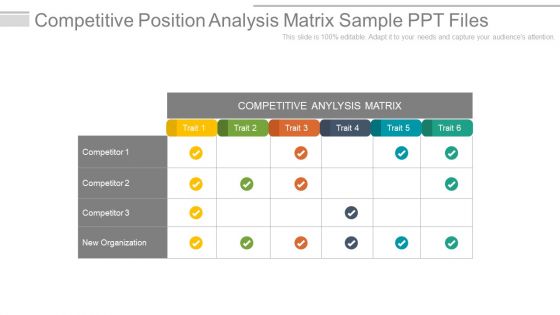
Competitive Position Analysis Matrix Sample Ppt Files
This is a competitive position analysis matrix sample ppt files. This is a six stage process. The stages in this process are competitive analysis matrix, trait, competitor, new organization.
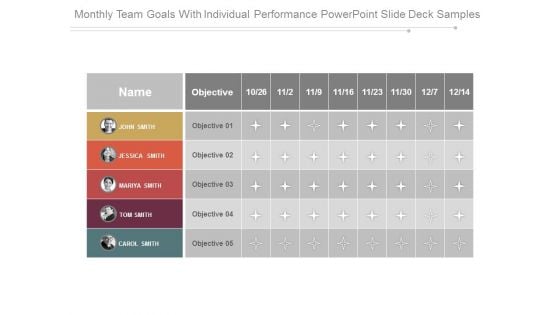
Monthly Team Goals With Individual Performance Powerpoint Slide Deck Samples
This is a monthly team goals with individual performance powerpoint slide deck samples. This is a five stage process. The stages in this process are name, objective, john smith, jessica smith, mariya smith, tom smith, carol smith.
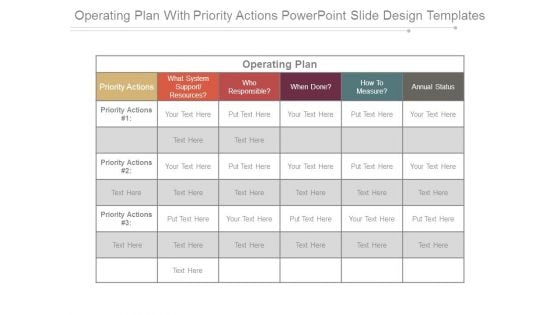
Operating Plan With Priority Actions Powerpoint Slide Design Templates
This is a operating plan with priority actions powerpoint slide design templates. This is a six stage process. The stages in this process are priority actions, what system support resources, who responsible, when done, how to measure, annual status, operating plan.
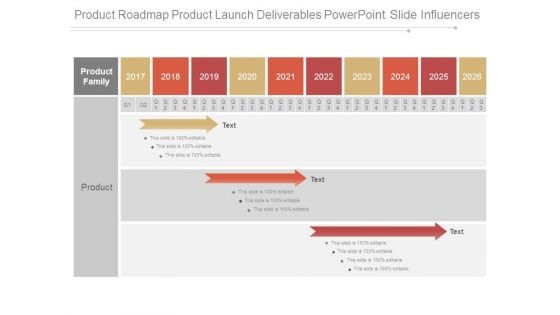
Product Roadmap Product Launch Deliverables Powerpoint Slide Influencers
This is a product roadmap product launch deliverables powerpoint slide influencers. This is a ten stage process. The stages in this process are product family, product.
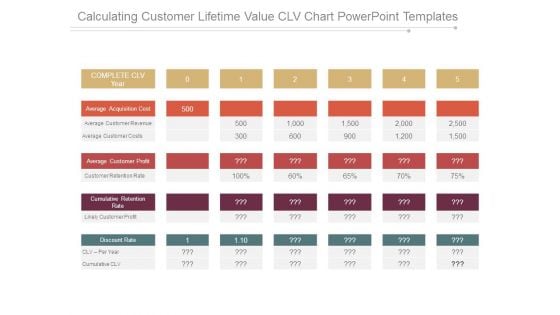
Calculating Customer Lifetime Value Clv Chart Powerpoint Templates
This is a calculating customer lifetime value clv chart powerpoint templates. This is a five stage process. The stages in this process are complete clv year, average acquisition cost, average customer revenue, average customer costs, average customer profit, customer retention rate, cumulative retention rate, likely customer profit, discount rate, clv per year, cumulative clv.
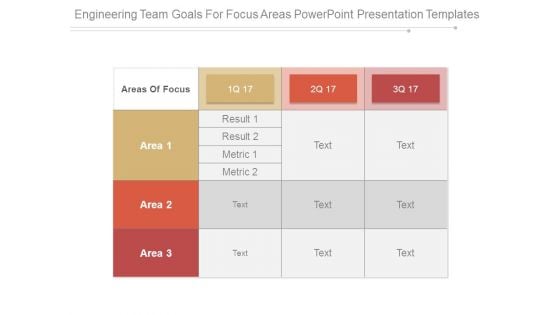
Engineering Team Goals For Focus Areas Powerpoint Presentation Templates
This is a engineering team goals for focus areas powerpoint presentation templates. This is a three stage process. The stages in this process are areas of focus, area, result, metric.
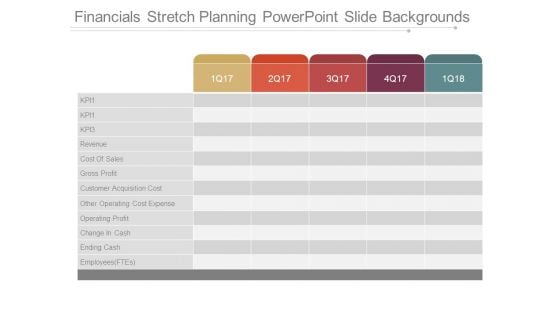
Financials Stretch Planning Powerpoint Slide Backgrounds
This is a financials stretch planning powerpoint slide backgrounds. This is a five stage process. The stages in this process are kp, revenue, cost of sales, gross profit, customer acquisition cost, other operating cost expense, operating profit, change in cash, ending cash, employees ftes.
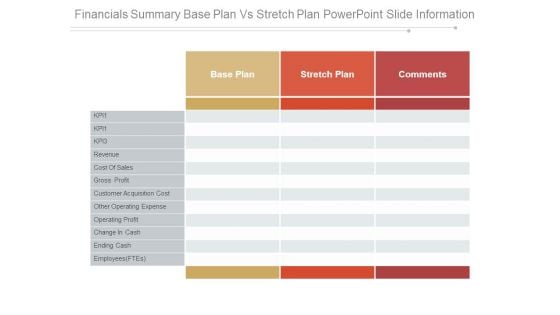
Financials Summary Base Plan Vs Stretch Plan Powerpoint Slide Information
This is a financials summary base plan vs stretch plan powerpoint slide information. This is a three stage process. The stages in this process are base plan, stretch plan, comments, kp, revenue, cost of sales, gross profit, customer acquisition cost, other operating expense, operating profit, change in cash, ending cash, employees ftes.
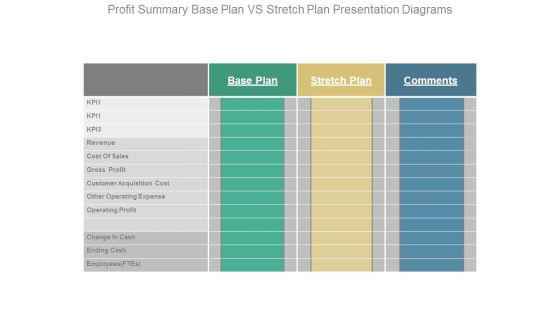
Profit Summary Base Plan Vs Stretch Plan Presentation Diagrams
This is a profit summary base plan vs stretch plan presentation diagrams. This is a three stage process. The stages in this process are base plan, stretch plan, comments, kpi, cost of sales, revenue, gross profit, customer acquisition cost, other operating expense, operating profit, change in cash, ending cash, employees ftes.
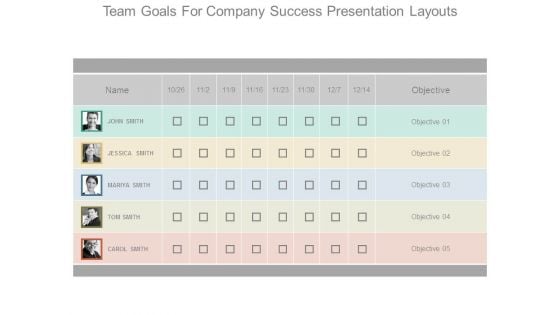
Team Goals For Company Success Presentation Layouts
This is a team goals for company success presentation layouts. This is a five stage process. The stages in this process are name, objective, john smith, jessica smith, mariya smith, tom smith, carol smith.
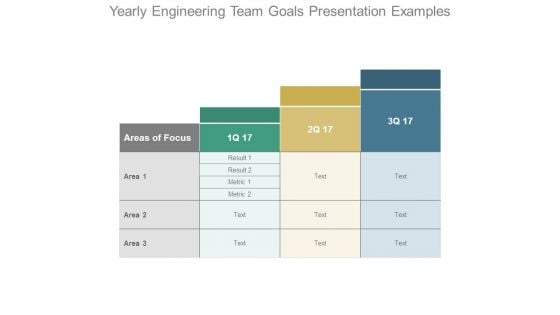
Yearly Engineering Team Goals Presentation Examples
This is a yearly engineering team goals presentation examples. This is a three stage process. The stages in this process are areas of focus, result, matric, area.
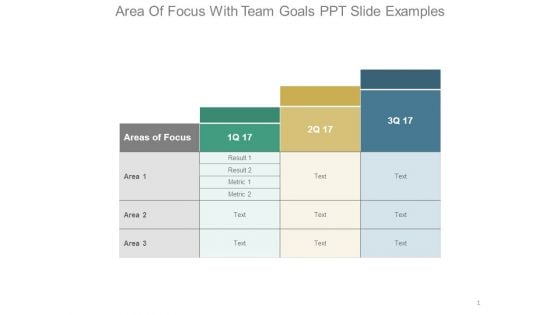
Area Of Focus With Team Goals Ppt Slide Examples
This is a area of focus with team goals ppt slide examples. This is a three stage process. The stages in this process are areas of focus, area, result, matric, text.
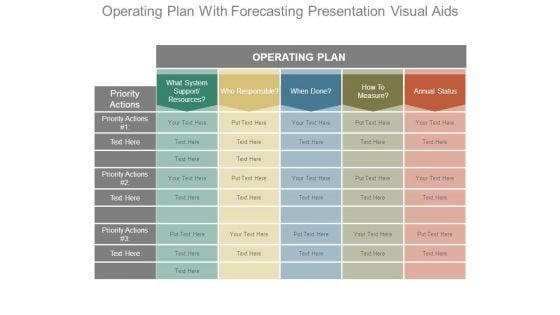
Operating Plan With Forecasting Presentation Visual Aids
This is a operating plan with forecasting presentation visual aids. This is a five stage process. The stages in this process are operating plan, what system support resources, who responsible, when done, how to measure, annual status, priority actions.
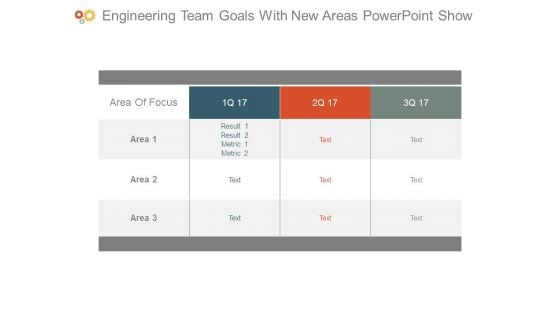
Engineering Team Goals With New Areas Powerpoint Show
This is a engineering team goals with new areas powerpoint show. This is a three stage process. The stages in this process are area of focus, area, result.
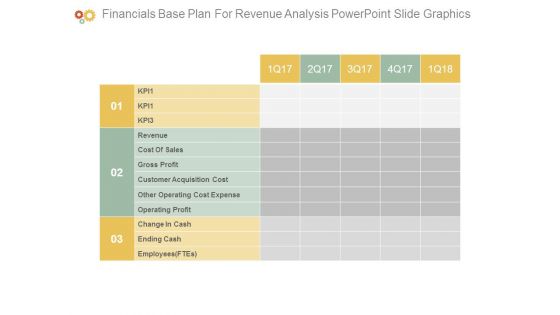
Financials Base Plan For Revenue Analysis Powerpoint Slide Graphics
This is a financials base plan for revenue analysis powerpoint slide graphics. This is a three stage process. The stages in this process are kp, revenue, cost of sales, gross profit, customer acquisition cost, other operating cost expense, operating profit, change in cash, ending cash, employees ftes.
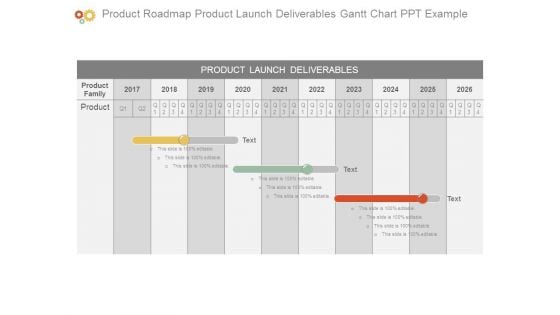
Product Roadmap Product Launch Deliverables Gantt Chart Ppt Example
This is a product roadmap product launch deliverables gantt chart ppt example. This is a three stage process. The stages in this process are product launch deliverables, product family, product.
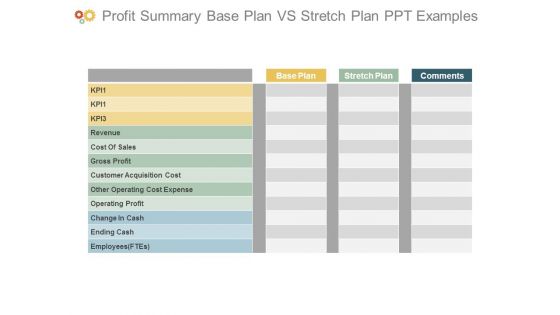
Profit Summary Base Plan Vs Stretch Plan Ppt Examples
This is a profit summary base plan vs stretch plan ppt examples. This is a three stage process. The stages in this process are base plan, kp, revenue, stretch plan, comments, cost of sales, gross profit, customer acquisition cost, other operating cost expense, operating profit, change in cash, ending cash, employees ftes.
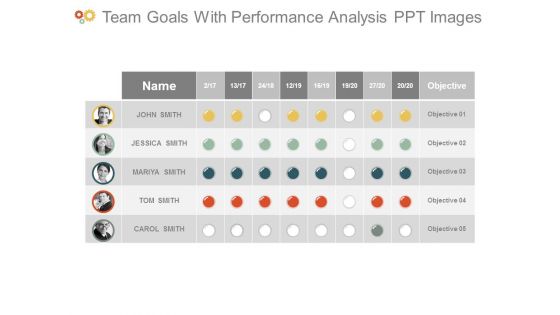
Team Goals With Performance Analysis Ppt Images
This is a team goals with performance analysis ppt images. This is a five stage process. The stages in this process are name, john smith, jessica smith, mariya smith, tom smith, carol smith, objective.
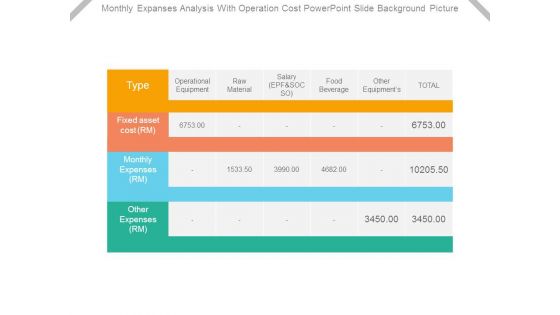
Monthly Expanses Analysis With Operation Cost Powerpoint Slide Background Picture
This is a monthly expanses analysis with operation cost powerpoint slide background picture. This is a six stage process. The stages in this process are type, operational equipment, raw material, salary epf and socso, food beverage, other equipment, total, fixed asset cost rm, monthly expenses rm, other expenses rm.
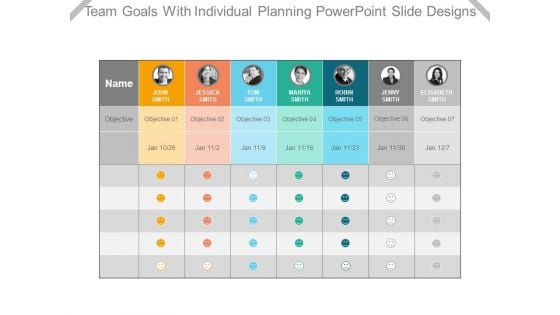
Team Goals With Individual Planning Powerpoint Slide Designs
This is a team goals with individual planning powerpoint slide designs. This is a seven stage process. The stages in this process are john smith, jessica smith, tom smith, mariya smith, robin smith, jenny smith, elisabeth smith, objective, name, jan.
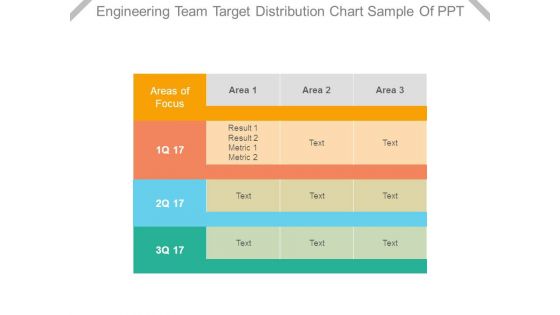
Engineering Team Target Distribution Chart Sample Of Ppt
This is a engineering team target distribution chart sample of ppt. This is a three stage process. The stages in this process are areas of focus, area, result, metric.
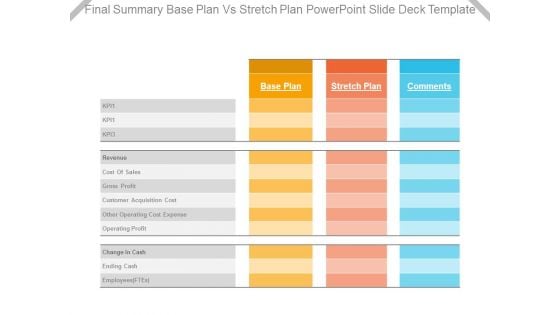
Final Summary Base Plan Vs Stretch Plan Powerpoint Slide Deck Template
This is a final summary base plan vs stretch plan powerpoint slide deck template. This is a three stage process. The stages in this process are kpi, revenue, cost of sales, gross profit, customer acquisition cost, other operating cost expense, operating profit, change in cash, ending cash, employees ftes.
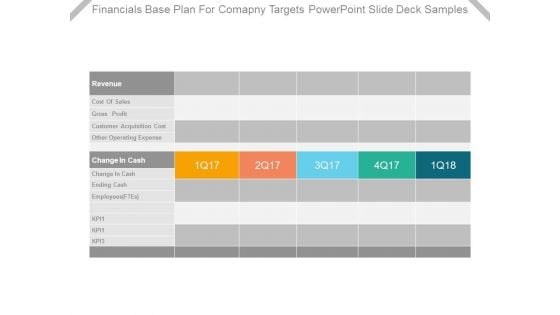
Financials Base Plan For Company Targets Powerpoint Slide Deck Samples
This is a financials base plan for company targets powerpoint slide deck samples. This is a five stage process. The stages in this process are revenue, cost of sales, gross profit, customer acquisition cost, other operating expense, change in cash, change in cash, ending cash, employees ftes, kpi.
Work Schedule Template 111 Ppt Icon
This is a work schedule template 111 ppt icon. This is a one stage process. The stages in this process are acceptance of the research proposal, talks with local representatives in study area, development of research tools, sample selection and talks with community, training of enumerators.
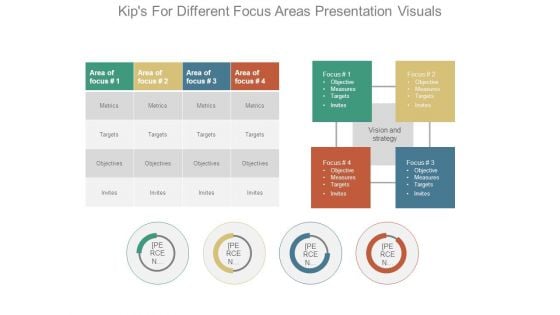
Kips For Different Focus Areas Presentation Visuals
This is a kips for different focus areas presentation visuals. This is a four stage process. The stages in this process are area of focus, metrics, targets, objectives, invites, vision and strategy, focus.
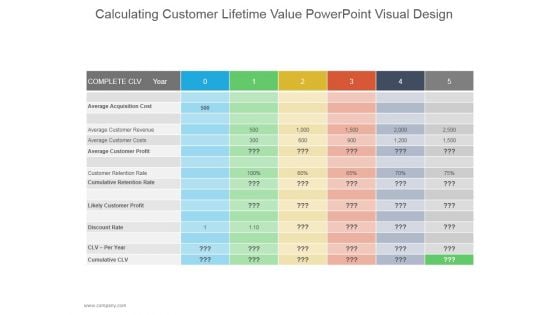
Calculating Customer Lifetime Value Ppt PowerPoint Presentation Introduction
This is a calculating customer lifetime value ppt powerpoint presentation introduction. This is a five stage process. The stages in this process are average acquisition cost, average customer revenue, likely customer profit.
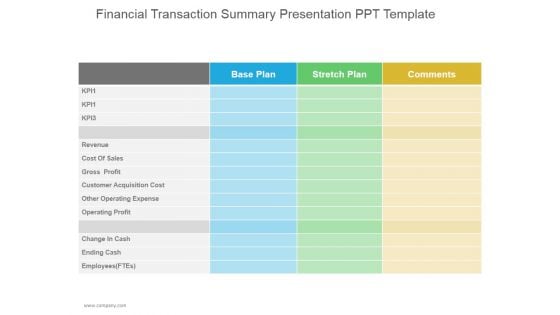
Financial Transaction Summary Ppt PowerPoint Presentation Show
This is a financial transaction summary ppt powerpoint presentation show. This is a three stage process. The stages in this process are cost of sales, gross profit, customer acquisition cost, operating profit, change in cash.
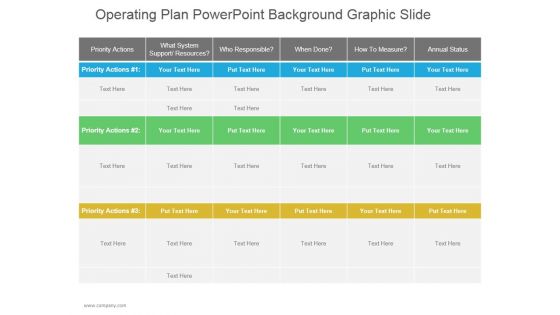
Operating Plan Ppt PowerPoint Presentation Microsoft
This is a operating plan ppt powerpoint presentation microsoft. This is a three stage process. The stages in this process are priority actions, who responsible, annual status, when done.
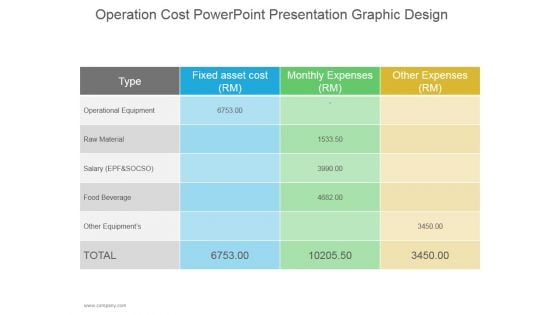
Operation Cost Ppt PowerPoint Presentation Visual Aids
This is a operation cost ppt powerpoint presentation visual aids. This is a four stage process. The stages in this process are fixed asset cost, operational equipment, raw material, food beverage, other equipment.
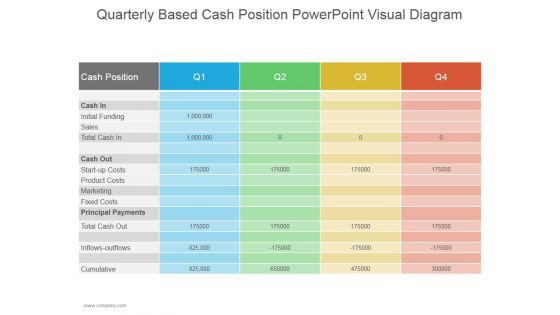
Quarterly Based Cash Position Ppt PowerPoint Presentation Summary
This is a quarterly based cash position ppt powerpoint presentation summary. This is a four stage process. The stages in this process are cash position, initial funding, product costs, start up costs, fixed costs, total cash out.
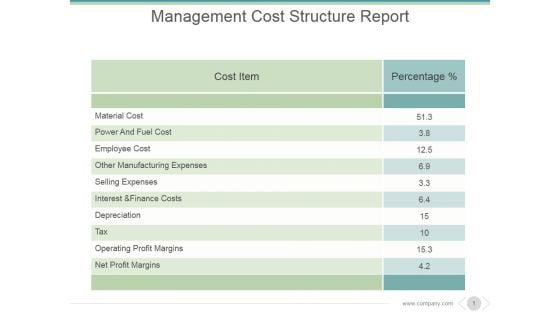
Management Cost Structure Report Ppt PowerPoint Presentation Graphics
This is a management cost structure report ppt powerpoint presentation graphics. This is a two stage process. The stages in this process are cost item, percentage, material cost, power and fuel cost, employee cost, other manufacturing expenses.
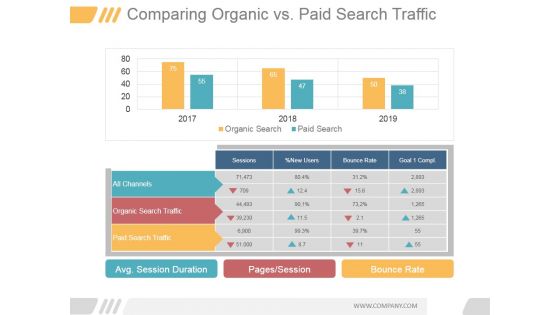
Comparing Organic Vs Paid Search Traffic Ppt PowerPoint Presentation Background Images
This is a comparing organic vs paid search traffic ppt powerpoint presentation background images. This is a four stage process. The stages in this process are all channels, organic search traffic, paid search traffic, avg session duration, pages session, bounce rate.
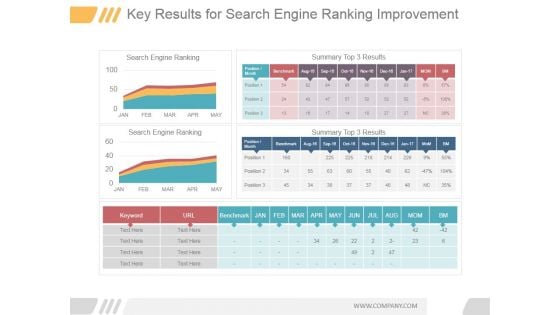
Key Results For Search Engine Ranking Improvement Good Ppt PowerPoint Presentation Model
This is a key results for search engine ranking improvement good ppt powerpoint presentation model. This is a three stage process. The stages in this process are search engine ranking, summary top 3 results, jan, feb, mar, apr.
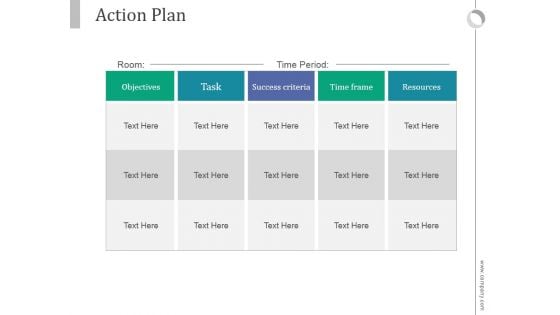
Action Plan Ppt PowerPoint Presentation Good
This is a action plan ppt powerpoint presentation good. This is a five stage process. The stages in this process are objectives, task, success criteria, time frame, resources.
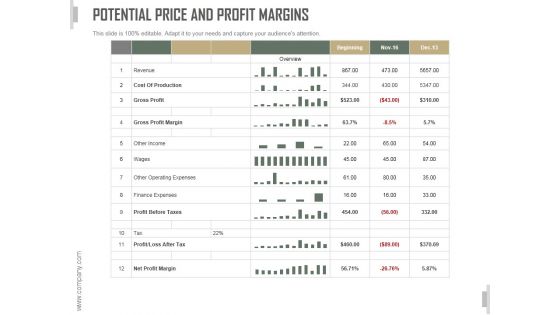
Potential Price And Profit Margins Ppt PowerPoint Presentation Visual Aids
This is a potential price and profit margins ppt powerpoint presentation visual aids. This is a twelve stage process. The stages in this process are gross profit, cost of production, gross profit margin, other income, finance expenses.
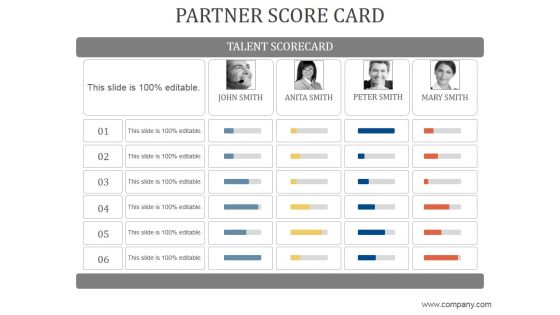
Partner Score Card Ppt PowerPoint Presentation Designs
This is a partner score card ppt powerpoint presentation designs. This is a six stage process. The stages in this process are john smith, anita smith, peter ,l peter smith, mary smith.
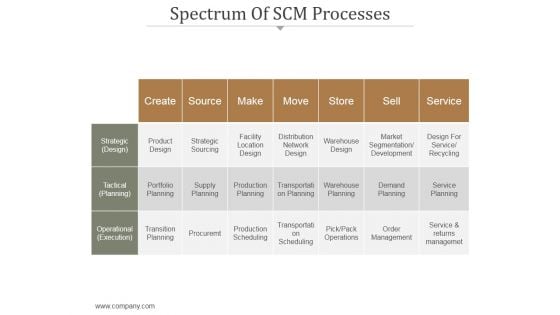
Spectrum Of Scm Processes Ppt PowerPoint Presentation Examples
This is a spectrum of scm processes ppt powerpoint presentation examples. This is a seven stage process. The stages in this process are product design, strategic sourcing, facility location design, distribution network design, warehouse design.
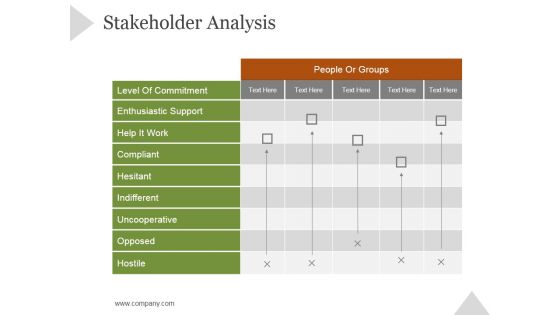
Stakeholder Analysis Ppt PowerPoint Presentation Graphics
This is a stakeholder analysis ppt powerpoint presentation graphics. This is a five stage process. The stages in this process are level of commitment, enthusiastic support, compliant, hesitant, indifferent, uncooperative, opposed.
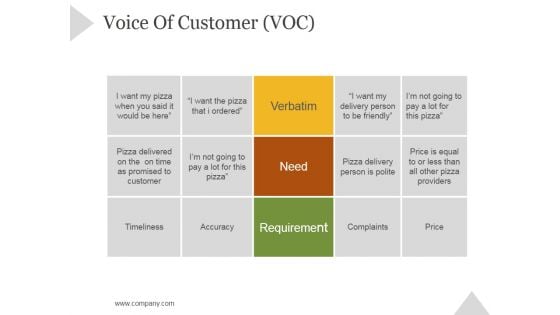
Voice Of Customer Voc Ppt PowerPoint Presentation Topics
This is a voice of customer voc ppt powerpoint presentation topics. This is a three stage process. The stages in this process are verbatim, need, requirement.
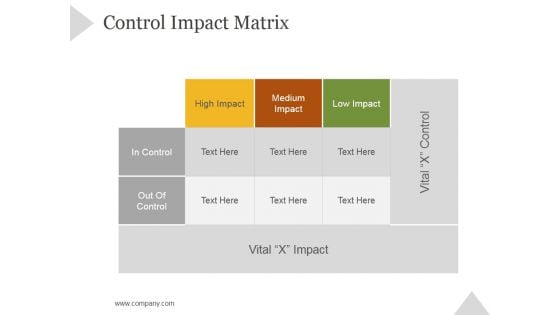
Control Impact Matrix Ppt PowerPoint Presentation Example
This is a control impact matrix ppt powerpoint presentation example. This is a three stage process. The stages in this process are high impact, medium impact, low impact, in control, out of control.

Evaluating Prospects Ppt PowerPoint Presentation Sample
This is a evaluating prospects ppt powerpoint presentation sample. This is a three stage process. The stages in this process are strategic attractiveness, financial attractiveness, implementation difficulty, uncertainty and risk, acceptability to stakeholders.
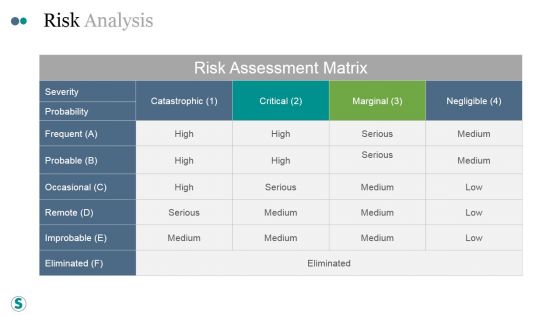
Risk Analysis Ppt PowerPoint Presentation Files
This is a risk analysis ppt powerpoint presentation files. This is a four stage process. The stages in this process are severity, probability, frequent, occasional.
Smart Action Plan Ppt PowerPoint Presentation Icon
This is a smart action plan ppt powerpoint presentation icon. This is a three stage process. The stages in this process are target data, activity, most responsible person, outcome deliverables, progress.
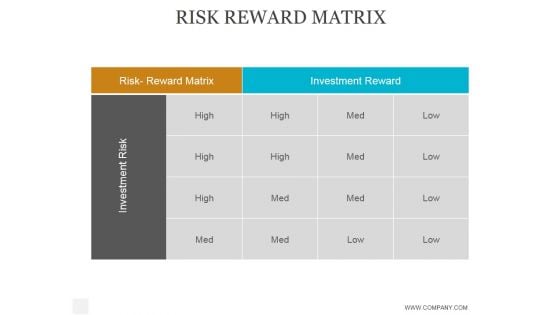
Risk Reward Matrix Ppt PowerPoint Presentation Topics
This is a risk reward matrix ppt powerpoint presentation topics. This is a two stage process. The stages in this process are risk reward matrix, investment reward, investment risk.
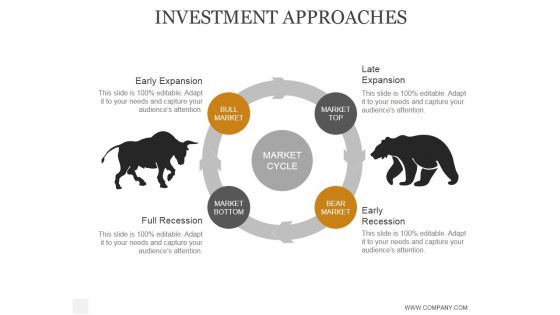
Investment Approaches Ppt PowerPoint Presentation Clipart
This is a investment approaches ppt powerpoint presentation clipart. This is a three stage process. The stages in this process are client objectives, strategies, products, minimizing short term losses, mitigating volatility.


 Continue with Email

 Home
Home


