Math Powerpoint
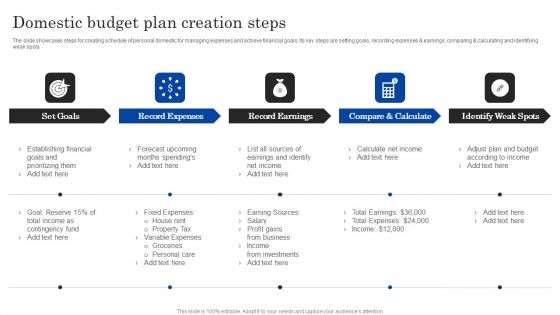
Domestic Budget Plan Creation Steps Ppt PowerPoint Presentation Styles Graphics Design PDF
The slide showcases steps for creating schedule of personal domestic for managing expenses and achieve financial goals. Its key steps are setting goals, recording expenses and earnings, comparing and calculating and identifying weak spots.Presenting Domestic Budget Plan Creation Steps Ppt PowerPoint Presentation Styles Graphics Design PDF to dispense important information. This template comprises five stages. It also presents valuable insights into the topics including Record Expenses, Record Earnings, Compare Calculate. This is a completely customizable PowerPoint theme that can be put to use immediately. So, download it and address the topic impactfully.
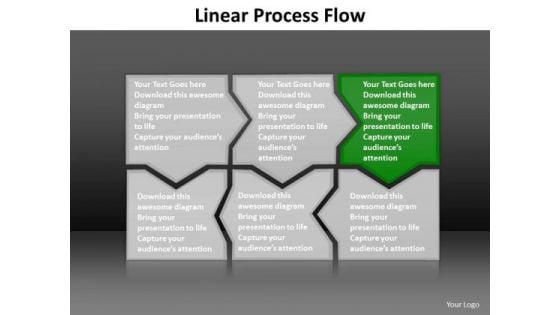
Ppt Dark Green Piece Connected In Linear Process Flow PowerPoint Theme Templates
PPT dark green piece connected in linear process flow powerpoint theme Templates-This PowerPoint Diagram shows the Green piece highlighting out of all connected pieces to describe the green part of the process in Linear Flow. It signifies beeline, continuous, even, horizontal, in bee line, in straight line, linear , nonstop, point-blank, right, shortest, straight, straight ahead, straightaway, through, true, unbroken etc.-Can be used for presentations on abstract, algorithm, arrow, arrow chart, block, block diagram, business, chart, color, connection, design, development, diagram, direction, element, flow, flow chart, flow diagram, flowchart, graph, kind of diagram, linear, linear diagram, management, model, module, motion, organization, plan, process, process arrows, process chart, process diagram, process flow, program, section, segment, set, sign, solution, strategy, symbol, technology, vector, vibrant, workflow, workflow chart, workflow diagram-PPT dark green piece connected in linear process flow powerpoint theme Templates Keep the camera trained on you with our Ppt Dark Green Piece Connected In Linear Process Flow PowerPoint Theme Templates. Just download, type and present.
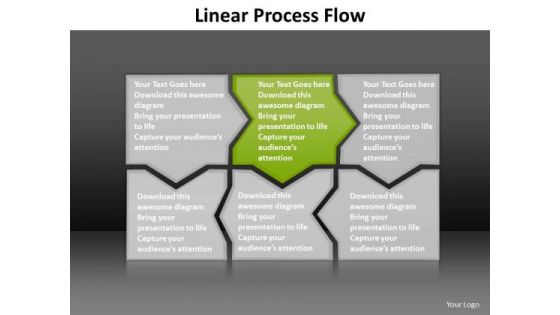
Ppt Light Green Piece Lotus Connections In Linear Process Flow PowerPoint Templates
PPT light green piece lotus connections in linear process flow PowerPoint Templates-Use this PowerPoint Diagram to illustrate The Linear Flow of its components. This Green part of combined Puzzles will let you explain the middle component of process and will help you to understand the mechanism of the procedure.-Can be used for presentations on abstract, algorithm, arrow, arrow chart, block, block diagram, business, chart, color, connection, design, development, diagram, direction, element, flow, flow chart, flow diagram, flowchart, graph, kind of diagram, linear, linear diagram, management, model, module, motion, organization, plan, process, process arrows, process chart, process diagram, process flow, program, section, segment, set, sign, solution, strategy, symbol, technology, vector, vibrant, workflow, workflow chart, workflow diagram-PPT light green piece lotus connections in linear process flow PowerPoint Templates Acquire success with our Ppt Light Green Piece Lotus Connections In Linear Process Flow PowerPoint Templates. Download without worries with our money back guaranteee.
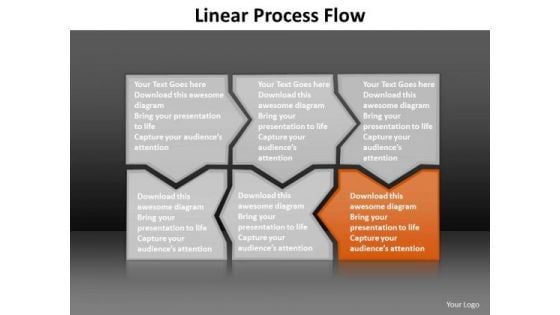
Ppt Orange Piece Connected In Linear Process Flow PowerPoint Template Templates
PPT orange piece connected in linear process flow powerpoint template Templates-Use this PowerPoint Diagram to illustrate how Linear Flow process and its components work. This Orange part which is being highlighted out of all combined Puzzles will let you explain the finishing component of process and will help you to understand the whole mechanism of the procedure.-Can be used for presentations on abstract, algorithm, arrow, arrow chart, block, block diagram, business, chart, color, connection, design, development, diagram, direction, element, flow, flow chart, flow diagram, flowchart, graph, kind of diagram, linear, linear diagram, management, model, module, motion, organization, plan, process, process arrows, process chart, process diagram, process flow, program, section, segment, set, sign, solution, strategy, symbol, technology, vector, vibrant, workflow, workflow chart, workflow diagram-PPT orange piece connected in linear process flow powerpoint template Templates Launch your crusade with our Ppt Orange Piece Connected In Linear Process Flow PowerPoint Template Templates. They will assist in creating belief.
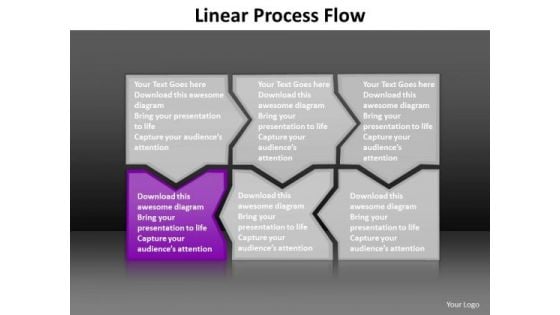
Ppt Purple Piece Live Connections In Linear Process Work Flow Chart PowerPoint Templates
PPT purple piece live connections in linear process work flow chart powerpoint Templates-Use this PowerPoint Diagram to illustrate how Linear Flow process and its components work. This Purple part which is being highlighted out of all combined Puzzles will let you explain the Beginning component of process and will help you to understand the whole mechanism of the procedure.-Can be used for presentations on abstract, algorithm, arrow, arrow, chart, block, block, diagram, business, chart, color, connection, design, development, diagram, direction, element, flow, flow, Chart, flow,diagram\n,flowchart\n,graph\n,kind,of,diagram\n,linear\n,linear,diagram\n,management\n,model\n,module\n,motion\n,organization\n,plan\n,process\n,process,arrows\n,process,chart\n,process,diagram\n,process,flow\n,program\n,section,segment,set,sign,solution,strategy,symbol-PPT purple piece live connections in linear process work flow chart powerpoint Templates Do yourself a favour by using our Ppt Purple Piece Live Connections In Linear Process Work Flow Chart PowerPoint Templates. Benefit from their effectiveness.
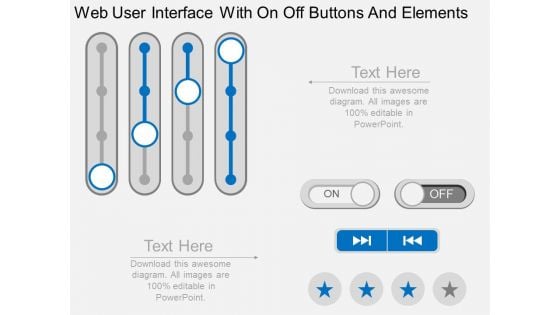
Web User Interface With On Off Buttons And Elements Powerpoint Template
Our professionally designed business diagram is as an effective tool for communicating technology related concepts. This PPT slide display web user interface with on off buttons. Convey your views with this diagram slide.
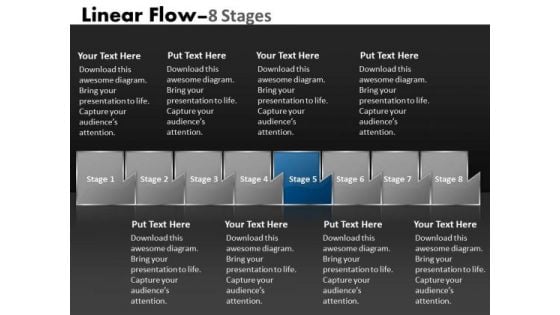
Ppt Theme Multicolored Sequential Flow Network Diagram PowerPoint Template 6 Image
We present our PPT Theme multicolored sequential flow network diagram power point template 6 Image. Use our Business PowerPoint Templates because, If making a mark is your obsession,. Use our Shapes PowerPoint Templates because; evolve the strategy to take you down the required path with appropriate, efficient and effective marketing along the way. Use our Design PowerPoint Templates because; Draw on its universal impact to highlight the similarities with your organizational structure and plans. Use our Signs PowerPoint Templates because, Use our to enthuse your colleagues. Use our Process and Flows PowerPoint Templates because; explain the process by which you intend to right it. Use these PowerPoint slides for presentations relating to abstract, algorithm, arrow, business, chart, connection, design, development, diagram, direction, element, flow, graph, linear, linear diagram, management, organization, plan, process, section, segment, set, sign, solution, strategy, symbol, vector. The prominent colors used in the PowerPoint template are Blue navy, Gray, Black Have a great ride at a low fare. Coast along on our PT&s.
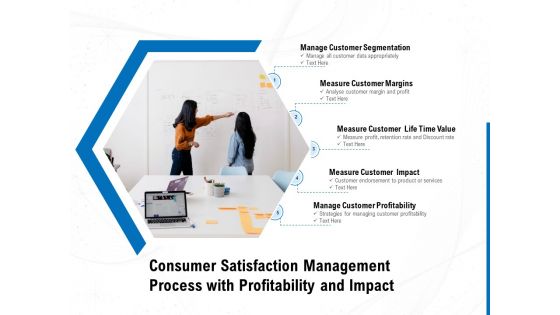
Consumer Satisfaction Management Process With Profitability And Impact Ppt PowerPoint Presentation Layouts Graphics Template
Presenting this set of slides with name consumer satisfaction management process with profitability and impact ppt powerpoint presentation layouts graphics template. This is a five stage process. The stages in this process are manage customer segmentation, measure customer margins, measure customer life time value, measure customer impact, manage customer profitability. This is a completely editable PowerPoint presentation and is available for immediate download. Download now and impress your audience.
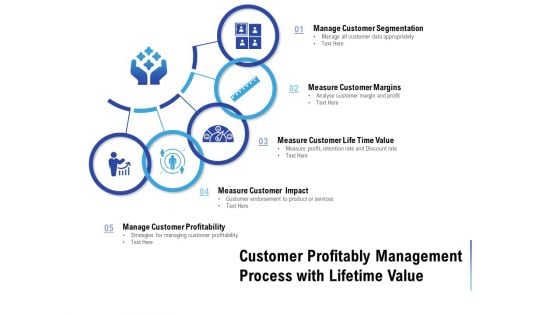
Customer Profitably Management Process With Lifetime Value Ppt PowerPoint Presentation Styles Infographic Template
Presenting this set of slides with name customer profitably management process with lifetime value ppt powerpoint presentation styles infographic template. This is a five stage process. The stages in this process are manage customer segmentation, measure customer margins, measure customer life time value, measure customer impact, manage customer profitability. This is a completely editable PowerPoint presentation and is available for immediate download. Download now and impress your audience.
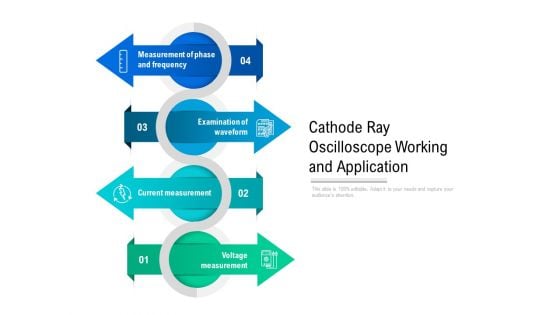
Cathode Ray Oscilloscope Working And Application Ppt PowerPoint Presentation Model Portfolio PDF
Presenting cathode ray oscilloscope working and application ppt powerpoint presentation model portfolio pdf to dispense important information. This template comprises four stages. It also presents valuable insights into the topics including measurement of phase and frequency, examination of waveform, current measurement, voltage measurement. This is a completely customizable PowerPoint theme that can be put to use immediately. So, download it and address the topic impactfully.
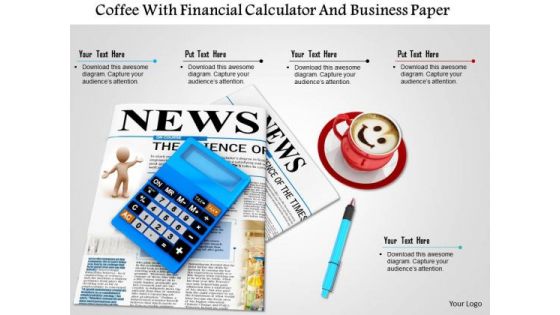
Stock Photo Coffee With Financial Calculator And Business Paper PowerPoint Slide
This image slide is designed with graphic of financial calculator with coffee cup and news paper. This image explains the concept of workplace and coffee break with its suitable graphics. Use this image to make business presentations.

Corrective And Preventive Measures Employee Strategy Ppt PowerPoint Presentation Complete Deck
This corrective and preventive measures employee strategy ppt powerpoint presentation complete deck acts as backup support for your ideas, vision, thoughts, etc. Use it to present a thorough understanding of the topic. This PPT slideshow can be utilized for both in-house and outside presentations depending upon your needs and business demands. Entailing eleven slides with a consistent design and theme, this template will make a solid use case. As it is intuitively designed, it suits every business vertical and industry. All you have to do is make a few tweaks in the content or any other component to design unique presentations. The biggest advantage of this complete deck is that it can be personalized multiple times once downloaded. The color, design, shapes, and other elements are free to modify to add personal touches. You can also insert your logo design in this PPT layout. Therefore a well-thought and crafted presentation can be delivered with ease and precision by downloading this corrective and preventive measures employee strategy ppt powerpoint presentation complete deck PPT slideshow.

Covid 19 Gears Measures Ppt PowerPoint Presentation Complete Deck With Slides
This covid 19 gears measures ppt powerpoint presentation complete deck with slides acts as backup support for your ideas, vision, thoughts, etc. Use it to present a thorough understanding of the topic. This PPT slideshow can be utilized for both in-house and outside presentations depending upon your needs and business demands. Entailing twelve slides with a consistent design and theme, this template will make a solid use case. As it is intuitively designed, it suits every business vertical and industry. All you have to do is make a few tweaks in the content or any other component to design unique presentations. The biggest advantage of this complete deck is that it can be personalized multiple times once downloaded. The color, design, shapes, and other elements are free to modify to add personal touches. You can also insert your logo design in this PPT layout. Therefore a well-thought and crafted presentation can be delivered with ease and precision by downloading this covid 19 gears measures ppt powerpoint presentation complete deck with slides PPT slideshow.
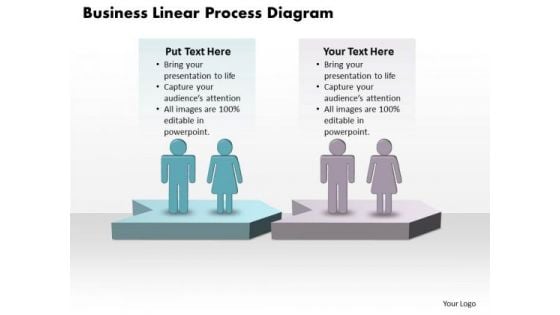
Success Ppt Template World Business PowerPoint Charts Linear Process Diagram 2 Design
We present our success PPT template world business Powerpoint charts linear process diagram 2 design. Use our People PowerPoint Templates because, the structure of our templates allows you to effectively highlight the key issues concerning the growth of your business. Use our Arrows PowerPoint Templates because, the plans are in your head, stage by stage, year by year. Use our Shapes PowerPoint Templates because, you understand the illness and its causes. Use our Communication PowerPoint Templates because, designed to attract the attention of your audience. Use our Business PowerPoint Templates because, you have the process in your head, our template design showing will illuminate your thoughts. Use these PowerPoint slides for presentations relating to abstract, achievement, aim, arrow, business, chart, communication, company, competition, concept, cycle, development, diagram, financial, flow, graph, growth, icon, marketing, sign, price, process, profit, progress, project, shape, sign, success, symbol, target, team. The prominent colors used in the PowerPoint template are Blue, Blue navy, Blue light Measure success with our Success Ppt Template World Business PowerPoint Charts Linear Process Diagram 2 Design. Download without worries with our money back guaranteee.
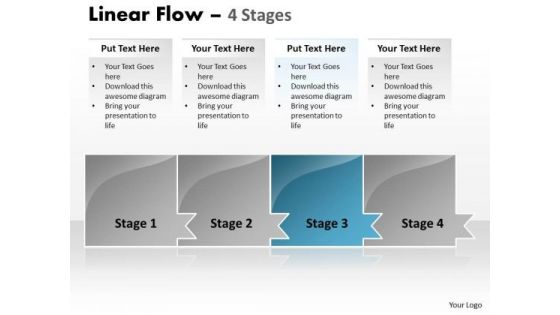
Process Ppt Template Horizontal Model Of 4 Concepts Time Management PowerPoint Graphic
We present our process PPT template horizontal model of 4 concepts time management PowerPoint Graphic. Use our Arrows PowerPoint Templates because, your ideas are fundamentally stable with a broad base of workable possibilities. Use our Symbol PowerPoint Templates because, Show how one can contribute to the overall feeling of wellbeing. Use our Business PowerPoint Templates because, to take it along a sure fire road to good profit. Use our Process and flows PowerPoint Templates because, the core of any organization is the people who work for it. Use our Abstract PowerPoint Templates because, now spread the fruits of your efforts and elaborate your ideas on the prevention, diagnosis, control and cure of prevalent diseases. Use these PowerPoint slides for presentations relating to Abstract, Arrow, Business, Chart, Design, Development, Diagram, Direction, Element, Flow, Flowchart, Graph, Linear, Management, Model, Motion, Organization, Plan, Process, Program, Section, Segment, Set, Sign, Solution, Strategy, Symbol, Technology. The prominent colors used in the PowerPoint template are Blue, Gray, and White Equip your thoughts with all accessories. Add on our Process Ppt Template Horizontal Model Of 4 Concepts Time Management PowerPoint Graphic for good measure.
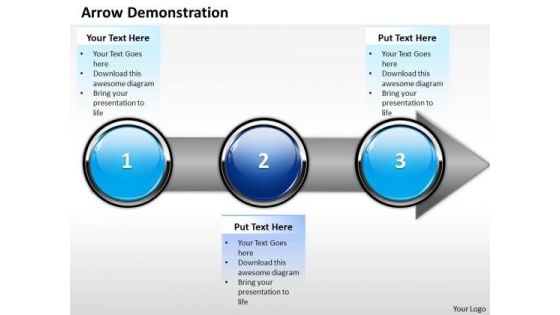
Ppt Consecutive Description Of Banking Process Using 3 State Diagram PowerPoint Templates
PPT consecutive description of banking process using 3 state diagram PowerPoint Templates-With this pre-designed process arrows diagram you can visualize almost any type of concept, chronological process or steps of your strategies.-PPT consecutive description of banking process using 3 state diagram PowerPoint Templates-Arrow, Bank, Benefit, Business, Calculate, Calculation, Capitalist, Communication, Company, Concern, Connection, Data, Diagram, Digital, Drawing, Earnings, Economic, Finance, Financial, Flow, Forecast, Gain, Goal, Graph, Growth, Illustration, Increase, Information, Interest, Investing, Management, Market, Money, Move, Network, Objective, Plan, Process, Profit, Progress, Report, Rise, Risk, Shares, Statistics, Stock, System, Technology Turn the heat up with our Ppt Consecutive Description Of Banking Process Using 3 State Diagram PowerPoint Templates. Make sure your presentation gets the attention it deserves.
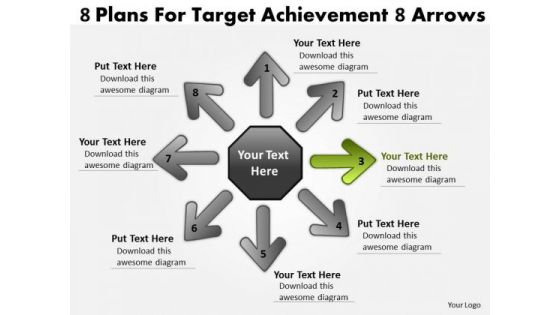
8 Plans For Target Achievement Arrows Cycle Process Network PowerPoint Templates
We present our 8 plans for target achievement arrows Cycle Process Network PowerPoint templates.Download and present our Symbol PowerPoint Templates because this PPt slide can educate your listeners on the relevance and importance of each one as per your plan and how they all contribute as you strive to hit the Bullseye. Use our Process and Flows PowerPoint Templates because this PPt slide helps you to measure key aspects of the current process and collect relevant data. Download and present our Arrows PowerPoint Templates because you can blaze a brilliant trail from point to point. Download and present our Communication PowerPoint Templates because you have some exciting plans to spread goodwill among the underprivileged, Expound on your ideas and show to your colleagues how they can help others and in the process increase your Brand value. Use our Business PowerPoint Templates because watch the excitement levels rise as they realise their worth.Use these PowerPoint slides for presentations relating to Abstract, Arrow, Background, Buttons, Circle, Clean, Communication, Concept, Conceptual, Design, Diagram, Direction, Elements, Exchange, Flow, Flowchart, Graph, Graphic, Icon, Illustration, Internet, Precise, Process, Red, Sign, Symbol, Template, Ultimate Simple, Web Graphics, Web Icons. The prominent colors used in the PowerPoint template are Green, Gray, Black. PowerPoint presentation experts tell us our 8 plans for target achievement arrows Cycle Process Network PowerPoint templates are Attractive. People tell us our Circle PowerPoint templates and PPT Slides are Striking. People tell us our 8 plans for target achievement arrows Cycle Process Network PowerPoint templates will help you be quick off the draw. Just enter your specific text and see your points hit home. Presenters tell us our Background PowerPoint templates and PPT Slides are Detailed. Customers tell us our 8 plans for target achievement arrows Cycle Process Network PowerPoint templates are Adorable. The feedback we get is that our Background PowerPoint templates and PPT Slides are Excellent. Frame an argument with our 8 Plans For Target Achievement Arrows Cycle Process Network PowerPoint Templates. Try us out and see what a difference our templates make.
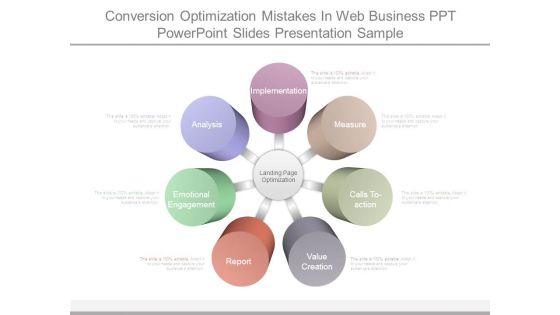
Conversion Optimization Mistakes In Web Business Ppt Powerpoint Slides Presentation Sample
This is a conversion optimization mistakes in web business ppt powerpoint slides presentation sample. This is a seven stage process. The stages in this process are landing page optimization, implementation, measure, calls to action, value creation, report, emotional engagement, analysis.
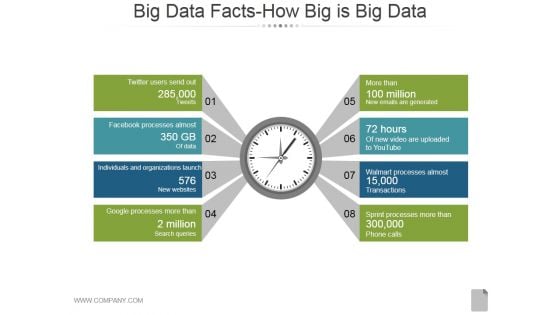
Big Data Facts How Big Is Big Data Ppt PowerPoint Presentation Microsoft
This is a big data facts how big is big data ppt powerpoint presentation microsoft. This is a eight stage process. The stages in this process are business, management, strategy, measure, marketing, success.

Sales Strategy Secrets And Tips Ppt PowerPoint Presentation Complete Deck With Slides
This is a sales strategy secrets and tips ppt powerpoint presentation complete deck with slides. This is a one stage process. The stages in this process are business, sales, strategy, measurement, marketing.
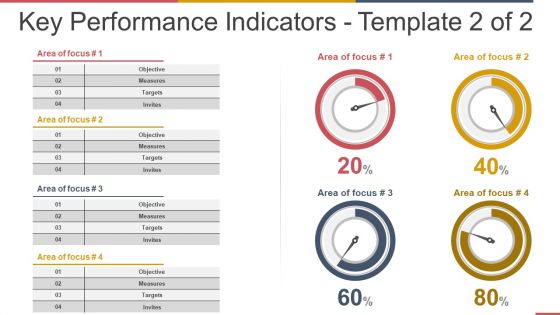
Key Performance Indicators Template 2 Ppt PowerPoint Presentation Ideas Background Images
This is a key performance indicators template 2 ppt powerpoint presentation ideas background images. This is a four stage process. The stages in this process are objective, measures, targets, invites.
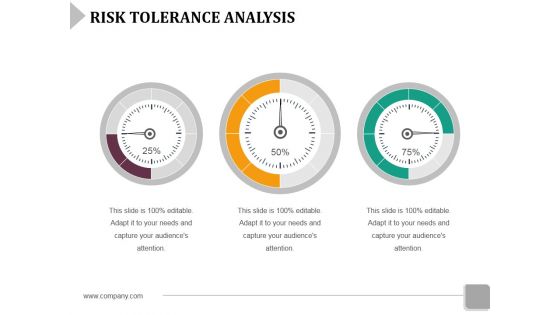
Risk Tolerance Analysis Template 1 Ppt Powerpoint Presentation File Infographic Template
This is a risk tolerance analysis template 1 ppt powerpoint presentation file infographic template. This is a three stage process. The stages in this process are dashboard, marketing, measure, business.

Decision Making Techniques In Project Management Ppt PowerPoint Presentation Complete Deck With Slides
This is a decision making techniques in project management ppt powerpoint presentation complete deck with slides. This is a one stage process. The stages in this process are project management, strategy, organize, execute, measure.
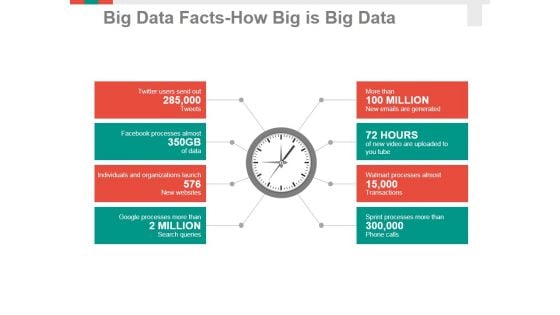
Big Data Facts How Big Is Big Data Ppt PowerPoint Presentation Professional Information
This is a big data facts how big is big data ppt powerpoint presentation professional information. This is a eight stage process. The stages in this process are business, management, strategy, measure, analysis.
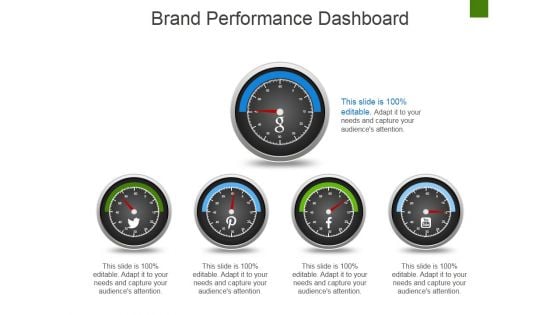
Brand Performance Dashboard Template 1 Ppt PowerPoint Presentation Infographic Template Vector
This is a brand performance dashboard template 1 ppt powerpoint presentation infographic template vector. This is a five stage process. The stages in this process are dashboard, measurement, analysis, strategy, business.

Root Cause Analysis Template 1 Ppt PowerPoint Presentation Styles Graphics Design
This is a root cause analysis template 1 ppt powerpoint presentation styles graphics design. This is a three stage process. The stages in this process are management, man, method, material, measurement.
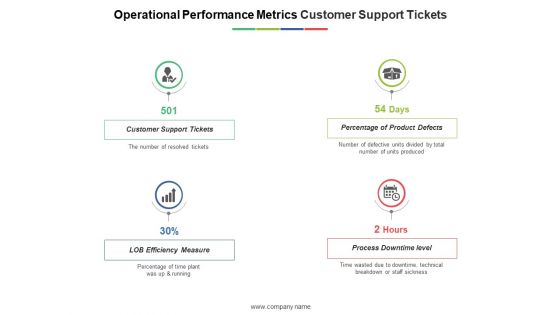
Operational Performance Metrics Customer Support Tickets Ppt PowerPoint Presentation Outline Graphics Design
This is a operational performance metrics customer support tickets ppt powerpoint presentation outline graphics design. This is a four stage process. The stages in this process are customer support tickets, percentage of product defects, lob efficiency measure, process downtime level.
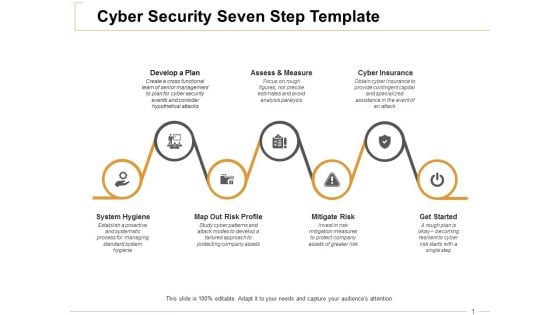
Cyber Security Seven Step Cyber Insurance Ppt PowerPoint Presentation Infographic Template Graphic Tips
This is a cyber security seven step cyber insurance ppt powerpoint presentation infographic template graphic tips. This is a seven stage process. The stages in this process are develop a plan, assess and measure, cyber insurance, mitigate risk, get started.
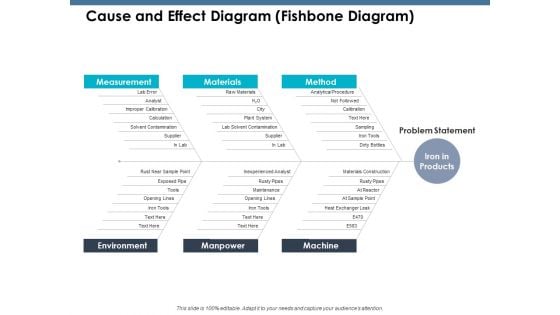
Cause And Effect Diagram Fishbone Diagram Ppt PowerPoint Presentation Outline Portrait
This is a cause and effect diagram fishbone diagram ppt powerpoint presentation outline portrait. This is a three stage process. The stages in this process are measurement, materials, method, environment, manpower.

Cause And Effect Diagram Fishbone Diagram Ppt PowerPoint Presentation Layouts Designs Download
This is a cause and effect diagram fishbone diagram ppt powerpoint presentation layouts designs download. This is a three stage process. The stages in this process are measurement, materials, method, environment, manpower, machine.
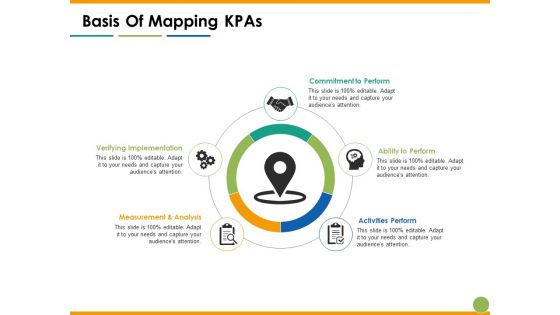
Basis Of Mapping Kpas Activities Perform Ppt PowerPoint Presentation Professional Design Ideas
This is a basis of mapping kpas activities perform ppt powerpoint presentation professional design ideas. This is a five stage process. The stages in this process are verifying implementation, measurement analysis, ability to perform, commitment to perform.
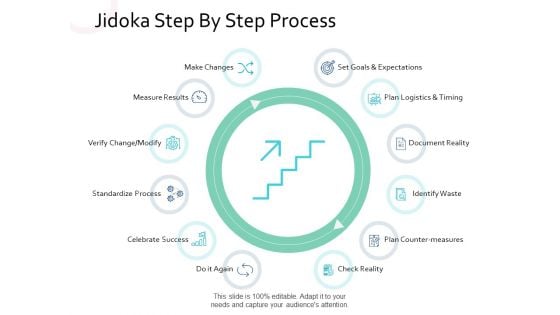
Jidoka Step By Step Process Make Changes Ppt PowerPoint Presentation Professional Graphics Download
This is a jidoka step by step process make changes ppt powerpoint presentation professional graphics download. This is a twelve stage process. The stages in this process are document reality, identify waste, measure results, make changes, celebrate success.
Project Sizing For Estimating And Planning Ppt Powerpoint Presentation Professional Graphics Download
This is a project sizing for estimating and planning ppt powerpoint presentation professional graphics download. This is a two stage process. The stages in this process are dimensions, size, measurements.

Small Medium Large Shoes Sizing Ppt Powerpoint Presentation Infographic Template Show
This is a small medium large shoes sizing ppt powerpoint presentation infographic template show. This is a three stage process. The stages in this process are dimensions, size, measurements.

Three Different Sizes Small Medium And Large Ppt Powerpoint Presentation Show Influencers
This is a three different sizes small medium and large ppt powerpoint presentation show influencers. This is a four stage process. The stages in this process are dimensions, size, measurements.
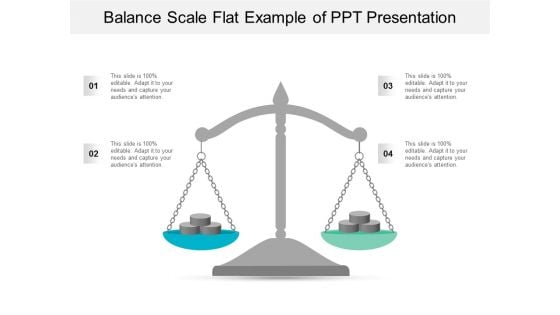
Balance Scale Flat Example Of Ppt Presentation Ppt Powerpoint Presentation Summary Introduction
This is a balance scale flat example of ppt presentation ppt powerpoint presentation summary introduction. This is a four stage process. The stages in this process are balance scale, weighing scale, measuring scale.
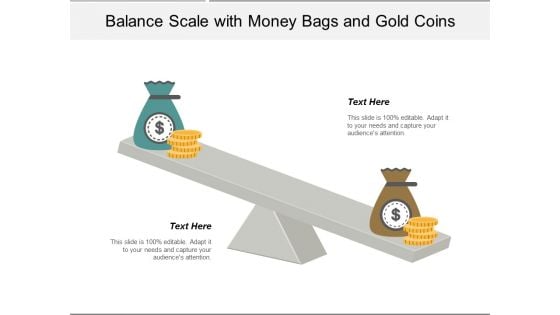
Balance Scale With Money Bags And Gold Coins Ppt Powerpoint Presentation Infographics Templates
This is a balance scale with money bags and gold coins ppt powerpoint presentation infographics templates. This is a two stage process. The stages in this process are balance scale, weighing scale, measuring scale.

Balance Scale With Two Bullet Points And Text Holders Ppt Powerpoint Presentation Pictures Infographics
This is a balance scale with two bullet points and text holders ppt powerpoint presentation pictures infographics. This is a two stage process. The stages in this process are balance scale, weighing scale, measuring scale.
Blue And Green Circles On Scale Board Ppt Powerpoint Presentation Icon Slideshow
This is a blue and green circles on scale board ppt powerpoint presentation icon slideshow. This is a two stage process. The stages in this process are balance scale, weighing scale, measuring scale.
Bulb And Dollar On Balance Scale Icons Ppt Powerpoint Presentation Icon Graphic Tips
This is a bulb and dollar on balance scale icons ppt powerpoint presentation icon graphic tips. This is a five stage process. The stages in this process are balance scale, weighing scale, measuring scale.

Five Circles Around Balance Scale With Text Boxes Ppt Powerpoint Presentation Summary Slide Download
This is a five circles around balance scale with text boxes ppt powerpoint presentation summary slide download. This is a five stage process. The stages in this process are balance scale, weighing scale, measuring scale.
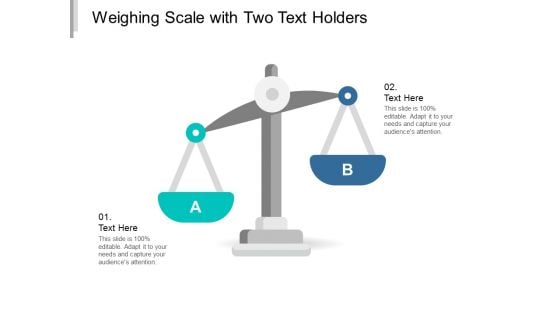
Weighing Scale With Two Text Holders Ppt Powerpoint Presentation Ideas Structure
This is a weighing scale with two text holders ppt powerpoint presentation ideas structure. This is a two stage process. The stages in this process are balance scale, weighing scale, measuring scale.
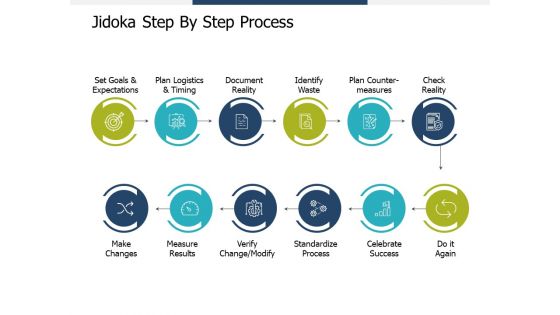
Jidoka Step By Step Process Ppt PowerPoint Presentation Ideas Master Slide
This is a jidoka step by step process ppt powerpoint presentation ideas master slide. This is a twelve stage process. The stages in this process are check reality, identify waste, document reality, measure results, celebrate success.
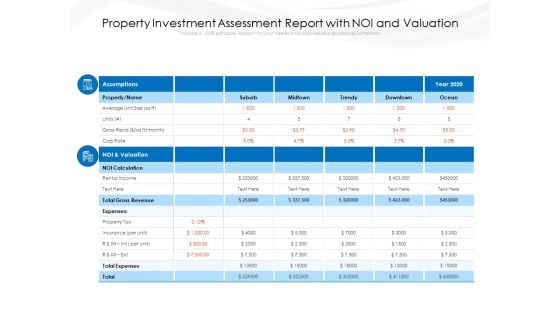
Property Investment Assessment Report With Noi And Valuation Ppt PowerPoint Presentation Infographic Template Introduction PDF
Showcasing this set of slides titled property investment assessment report with noi and valuation ppt powerpoint presentation infographic template introduction pdf. The topics addressed in these templates are assumptions, noi and valuation, total gross revenue, noi calculation. All the content presented in this PPT design is completely editable. Download it and make adjustments in color, background, font etc. as per your unique business setting.
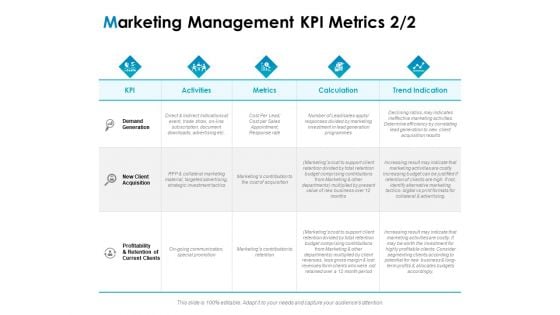
Strategic Marketing Plan Marketing Management KPI Metrics Trend Ppt PowerPoint Presentation Summary Mockup PDF
Deliver and pitch your topic in the best possible manner with this strategic marketing plan marketing management kpi metrics trend ppt powerpoint presentation summary mockup pdf. Use them to share invaluable insights on activities, kpi, metrics, calculation, trend indication, new client acquisition, demand generation and impress your audience. This template can be altered and modified as per your expectations. So, grab it now.
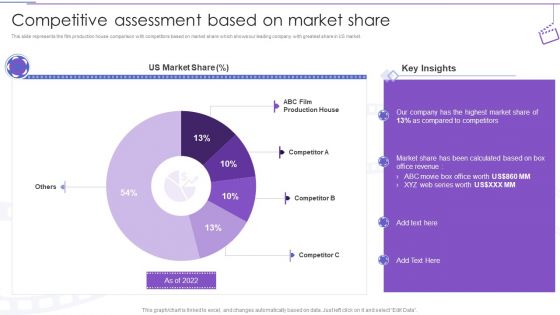
Film Making Company Outline Competitive Assessment Based On Market Share Ppt PowerPoint Presentation Show PDF
Deliver an awe inspiring pitch with this creative Film Making Company Outline Competitive Assessment Based On Market Share Ppt PowerPoint Presentation Show PDF bundle. Topics like Compared To Competitors, Highest Market, Calculated Based can be discussed with this completely editable template. It is available for immediate download depending on the needs and requirements of the user.
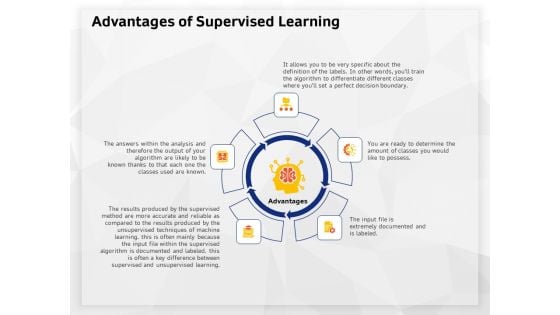
AI High Tech PowerPoint Templates Advantages Of Supervised Learning Ppt Gallery Aids PDF
Presenting this set of slides with name ai high tech powerpoint templates advantages of supervised learning ppt gallery aids pdf. This is a five stage process. The stages in this process are it allows you to be very specific about the definition of the labels. in other words, you will train the algorithm to differentiate different classes where you will set a perfect decision boundary. This is a completely editable PowerPoint presentation and is available for immediate download. Download now and impress your audience.
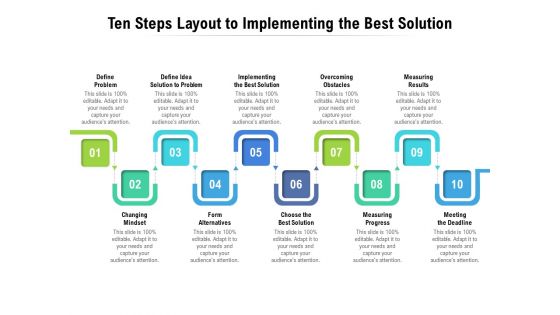
Ten Steps Layout To Implementing The Best Solution Ppt PowerPoint Presentation Summary Format
Presenting this set of slides with name ten steps layout to implementing the best solution ppt powerpoint presentation summary format. This is a ten stage process. The stages in this process are define problem, overcoming obstacles, measuring results, changing mindset, measuring progress, meeting the deadline, implementing the best solution. This is a completely editable PowerPoint presentation and is available for immediate download. Download now and impress your audience.
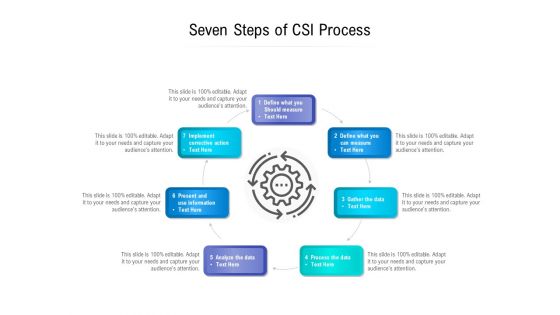
Seven Steps Of CSI Process Ppt PowerPoint Presentation Infographic Template Slides PDF
Presenting this set of slides with name seven steps of csi process ppt powerpoint presentation infographic template slides pdf. This is a seven stage process. The stages in this process are define what you should measure, define what you can measure, gather the data, process the data, analyze the data, present and use information, implement corrective action. This is a completely editable PowerPoint presentation and is available for immediate download. Download now and impress your audience.
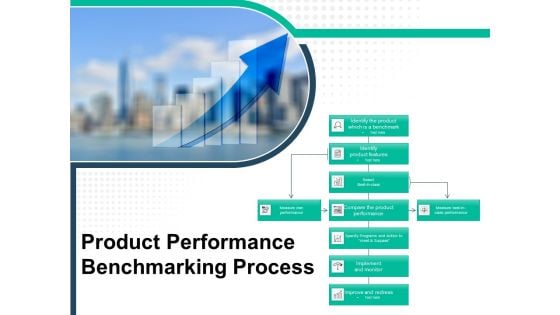
Product Performance Benchmarking Process Ppt PowerPoint Presentation Professional Graphics Pictures PDF
Presenting this set of slides with name product performance benchmarking process ppt powerpoint presentation professional graphics pictures pdf. This is a one stage process. The stages in this process are measure own performance, measure best class performance, compare the product performance, improve and redress, implement and monitor, identify product features. This is a completely editable PowerPoint presentation and is available for immediate download. Download now and impress your audience.
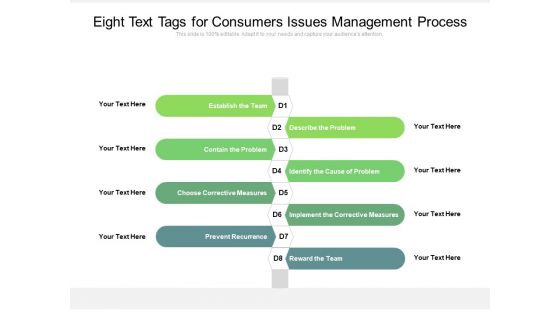
Eight Text Tags For Consumers Issues Management Process Ppt PowerPoint Presentation Infographics Vector PDF
Presenting this set of slides with name eight text tags for consumers issues management process ppt powerpoint presentation infographics vector pdf. This is a eight stage process. The stages in this process are establish the team, contain the problem, choose corrective measures, prevent recurrence, describe the problem, identify the cause of problem, implement the corrective measures, reward the team. This is a completely editable PowerPoint presentation and is available for immediate download. Download now and impress your audience.
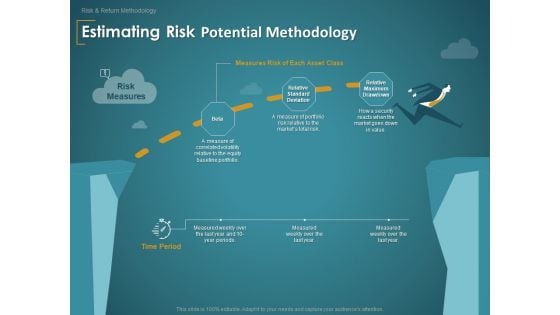
Financial Consultancy Proposal Estimating Risk Potential Methodology Ppt PowerPoint Presentation Slides Portrait PDF
Presenting this set of slides with name financial consultancy proposal estimating risk potential methodology ppt powerpoint presentation slides portrait pdf. This is a one stage process. The stages in this process are risk measures, time period, measures risk each asset class, relative standard deviation, relative maximum drawdown, beta. This is a completely editable PowerPoint presentation and is available for immediate download. Download now and impress your audience.
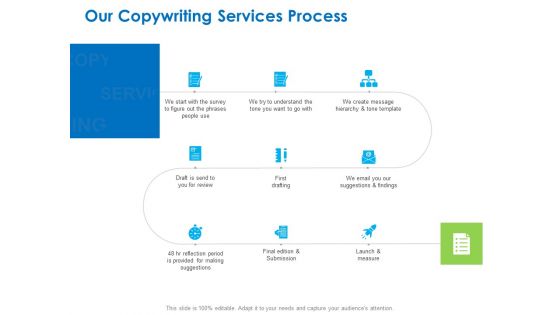
Intellectual Property Our Copywriting Services Process Ppt PowerPoint Presentation Styles Tips PDF
Presenting this set of slides with name intellectual property our copywriting services process ppt powerpoint presentation styles tips pdf. This is a nine stage process. The stages in this process are suggestions and findings, final edition and submission, launch and measure, email you our suggestions and findings, create message hierarchy and, tone template, launch and measure, final edition and submission. This is a completely editable PowerPoint presentation and is available for immediate download. Download now and impress your audience.
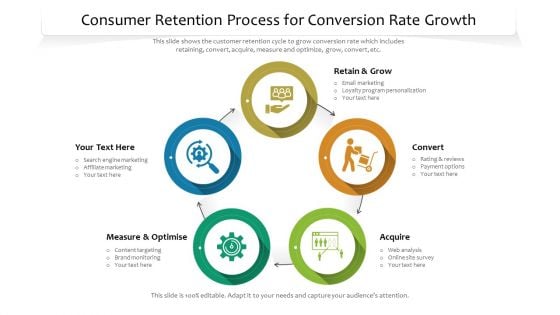
Consumer Retention Process For Conversion Rate Growth Ppt PowerPoint Presentation Model Background Designs PDF
This slide shows the customer retention cycle to grow conversion rate which includes retaining, convert, acquire, measure and optimize, grow, convert, etc. Presenting consumer retention process for conversion rate growth ppt powerpoint presentation model background designs pdf to dispense important information. This template comprises five stages. It also presents valuable insights into the topics including engine marketing, measure optimize, program personalization. This is a completely customizable PowerPoint theme that can be put to use immediately. So, download it and address the topic impactfully.
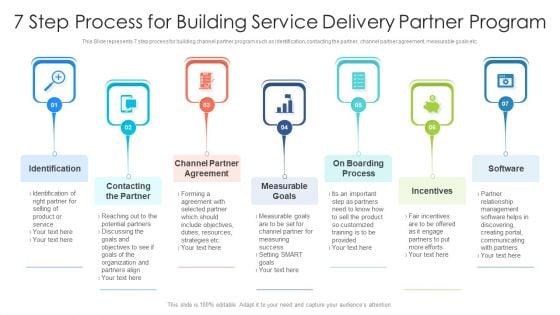
7 Step Process For Building Service Delivery Partner Program Ppt PowerPoint Presentation File Layouts PDF
This Slide represents 7 step process for building channel partner program such as identification, contacting the partner, channel partner agreement, measurable goals etc. Presenting 7 step process for building service delivery partner program ppt powerpoint presentation file layouts pdf to dispense important information. This template comprises seven stages. It also presents valuable insights into the topics including measurable goals, incentives, software. This is a completely customizable PowerPoint theme that can be put to use immediately. So, download it and address the topic impactfully.
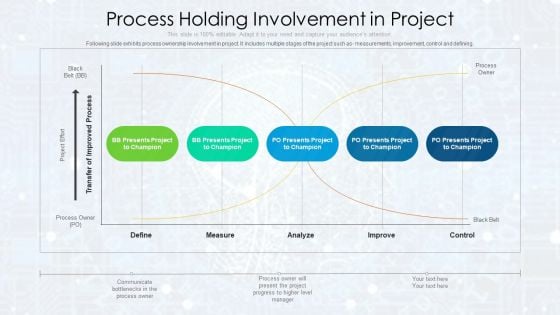
Process Holding Involvement In Project Ppt PowerPoint Presentation File Designs PDF
Following slide exhibits process ownership involvement in project. It includes multiple stages of the project such as measurements, improvement, control and defining. Presenting process holding involvement in project ppt powerpoint presentation file designs pdf to dispense important information. This template comprises five stages. It also presents valuable insights into the topics including measure, analyze, improve, control. This is a completely customizable PowerPoint theme that can be put to use immediately. So, download it and address the topic impactfully.

Sustainability Calculation With KPI Ppt PowerPoint Presentation Complete Deck With Slides
This complete deck acts as a great communication tool. It helps you in conveying your business message with personalized sets of graphics, icons etc. Comprising a set of fourty five slides, this complete deck can help you persuade your audience. It also induces strategic thinking as it has been thoroughly researched and put together by our experts. Not only is it easily downloadable but also editable. The color, graphics, theme any component can be altered to fit your individual needs. So grab it now.

Calculate Facebook Key Performance Indicator Ppt PowerPoint Presentation Complete Deck With Slides
This complete deck acts as a great communication tool. It helps you in conveying your business message with personalized sets of graphics, icons etc. Comprising a set of eleven slides, this complete deck can help you persuade your audience. It also induces strategic thinking as it has been thoroughly researched and put together by our experts. Not only is it easily downloadable but also editable. The color, graphics, theme any component can be altered to fit your individual needs. So grab it now.
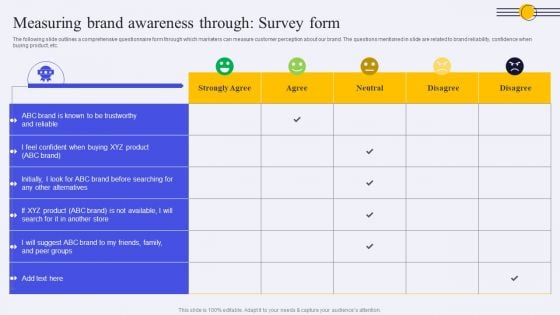
Measuring Brand Awareness Through Survey Form Ppt PowerPoint Presentation Diagram Lists PDF
The following slide outlines a comprehensive questionnaire form through which marketers can measure customer perception about our brand. The questions mentioned in slide are related to brand reliability, confidence when buying product, etc. The Measuring Brand Awareness Through Survey Form Ppt PowerPoint Presentation Diagram Lists PDF is a compilation of the most recent design trends as a series of slides. It is suitable for any subject or industry presentation, containing attractive visuals and photo spots for businesses to clearly express their messages. This template contains a variety of slides for the user to input data, such as structures to contrast two elements, bullet points, and slides for written information. Slidegeeks is prepared to create an impression.
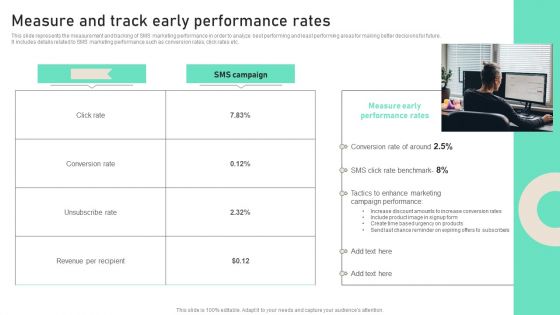
Measure And Track Early Performance Rates Ppt PowerPoint Presentation File Infographic Template PDF
This slide represents the measurement and tracking of SMS marketing performance in order to analyze best performing and least performing areas for making better decisions for future. It includes details related to SMS marketing performance such as conversion rates, click rates etc. Slidegeeks is here to make your presentations a breeze with Measure And Track Early Performance Rates Ppt PowerPoint Presentation File Infographic Template PDF With our easy to use and customizable templates, you can focus on delivering your ideas rather than worrying about formatting. With a variety of designs to choose from, you are sure to find one that suits your needs. And with animations and unique photos, illustrations, and fonts, you can make your presentation pop. So whether you are giving a sales pitch or presenting to the board, make sure to check out Slidegeeks first.


 Continue with Email

 Home
Home


