Measurement System Analysis
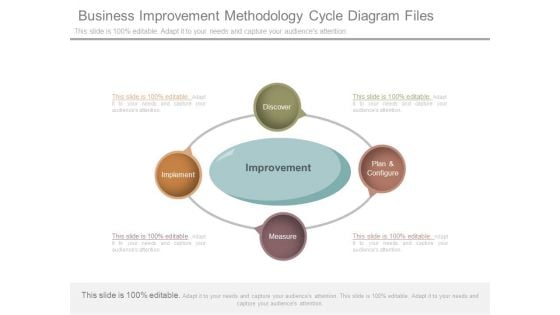
Business Improvement Methodology Cycle Diagram Files
This is a business improvement methodology cycle diagram files. This is a four stage process. The stages in this process are improvement, discover, plan and configure, measure, implement.
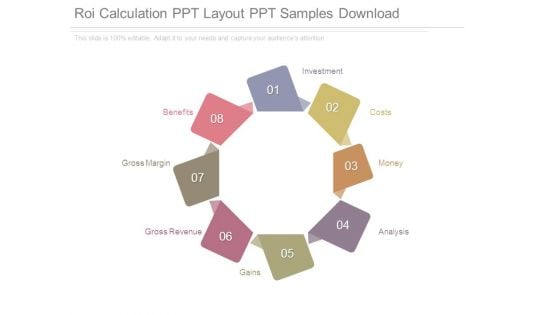
Roi Calculation Ppt Layout Ppt Samples Download
This is a roi calculation ppt layout ppt samples download. This is a eight stage process. The stages in this process are investment, costs, money, analysis, gains, gross revenue, gross margin, benefits.
File Management Quality Control And Reporting Metrics Ppt PowerPoint Presentation Portfolio Icon
This is a file management quality control and reporting metrics ppt powerpoint presentation portfolio icon. This is a five stage process. The stages in this process are document review, document analysis, document evaluation.
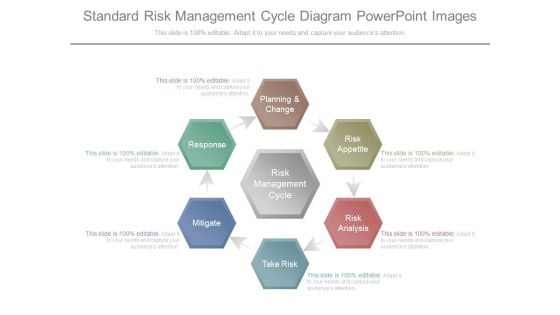
Standard Risk Management Cycle Diagram Powerpoint Images
This is a standard risk management cycle diagram powerpoint images. This is a six stage process. The stages in this process are planning and change, risk appetite, risk analysis, take risk, mitigate, response, risk management cycle.
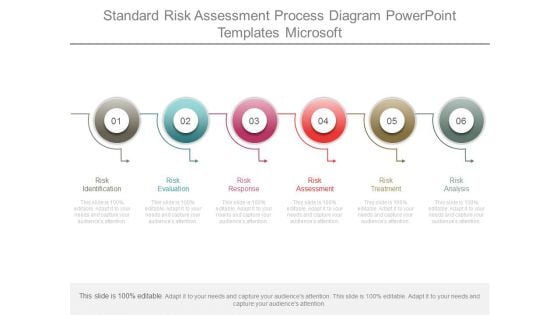
Standard Risk Assessment Process Diagram Powerpoint Templates Microsoft
This is a standard risk assessment process diagram powerpoint templates microsoft. This is a six stage process. The stages in this process are risk identification, risk evaluation, risk response, risk assessment, risk treatment, risk analysis.
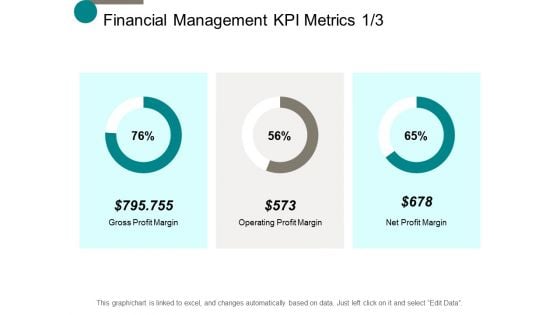
Financial Management Kpi Metrics Management Ppt Powerpoint Presentation Outline Themes
This is a financial management kpi metrics management ppt powerpoint presentation outline themes. This is a three stage process. The stages in this process are finance, marketing, management, investment, analysis.
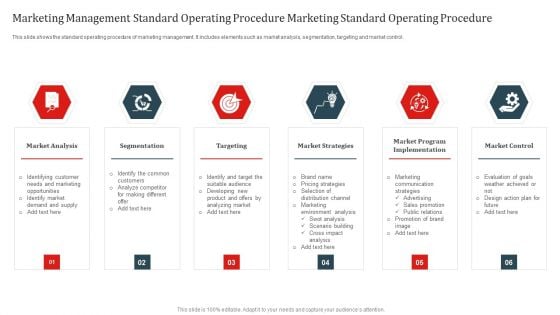
Marketing Management Standard Operating Procedure Marketing Standard Operating Procedure Portrait PDF
This slide shows the standard operating procedure of marketing management. It includes elements such as market analysis, segmentation, targeting and market control. Presenting Marketing Management Standard Operating Procedure Marketing Standard Operating Procedure Portrait PDF to dispense important information. This template comprises six stages. It also presents valuable insights into the topics including Market Analysis, Segmentation, Targeting, Market Strategies. This is a completely customizable PowerPoint theme that can be put to use immediately. So, download it and address the topic impactfully.
Data Algorithm And Storage Management Ppt PowerPoint Presentation Icon Background Images
This is a data algorithm and storage management ppt powerpoint presentation icon background images. This is a four stage process. The stages in this process are data, analysis, data science, information science.

Market Intelligence Surveying Metrics Monitoring Ppt PowerPoint Presentation Portfolio Inspiration
This is a market intelligence surveying metrics monitoring ppt powerpoint presentation portfolio inspiration. This is a five stage process. The stages in this process are competitive analysis, benchmark competition, competition landscape.

Data Algorithm Statistics And Advanced Computing Ppt PowerPoint Presentation File Styles
This is a data algorithm statistics and advanced computing ppt powerpoint presentation file styles. This is a eight stage process. The stages in this process are data, analysis, data science, information science.
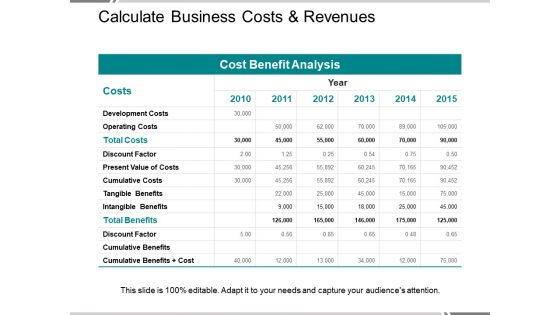
Calculate Business Costs And Revenues Ppt PowerPoint Presentation Styles Inspiration
This is a calculate business costs and revenues ppt powerpoint presentation styles inspiration. This is a seven stage process. The stages in this process are cost benefit analysis, cost benefit investigation, cost benefit examination.
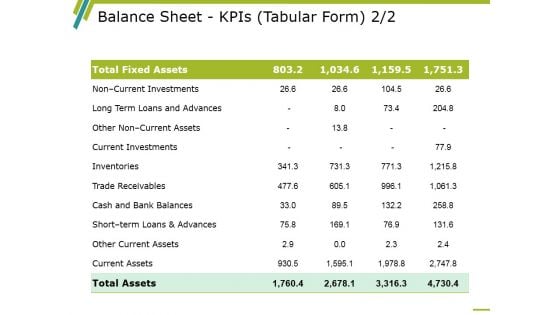
Balance Sheet Kpis Template 2 Ppt PowerPoint Presentation Outline Graphics Pictures
This is a balance sheet kpis template 2 ppt powerpoint presentation outline graphics pictures. This is a four stage process. The stages in this process are balance sheet, finance, marketing, strategy, analysis.
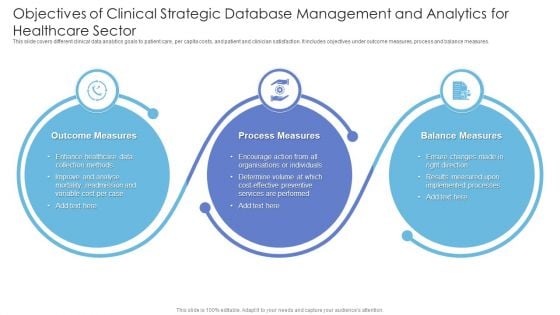
Objectives Of Clinical Strategic Database Management And Analytics For Healthcare Sector Professional PDF
This slide covers different clinical data analytics goals to patient care, per capita costs, and patient and clinician satisfaction. It includes objectives under outcome measures, process and balance measures. Presenting Objectives Of Clinical Strategic Database Management And Analytics For Healthcare Sector Professional PDF to dispense important information. This template comprises three stages. It also presents valuable insights into the topics including Outcome Measures, Process Measures, Balance Measures. This is a completely customizable PowerPoint theme that can be put to use immediately. So, download it and address the topic impactfully.
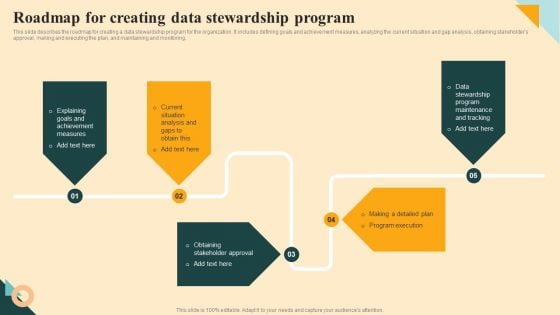
Roadmap For Creating Data Stewardship Program Infographics PDF
This slide describes the roadmap for creating a data stewardship program for the organization. It includes defining goals and achievement measures, analyzing the current situation and gap analysis, obtaining stakeholders approval, making and executing the plan, and maintaining and monitoring. The best PPT templates are a great way to save time, energy, and resources. Slidegeeks have 100 percent editable powerpoint slides making them incredibly versatile. With these quality presentation templates, you can create a captivating and memorable presentation by combining visually appealing slides and effectively communicating your message. Download Roadmap For Creating Data Stewardship Program Infographics PDF from Slidegeeks and deliver a wonderful presentation.
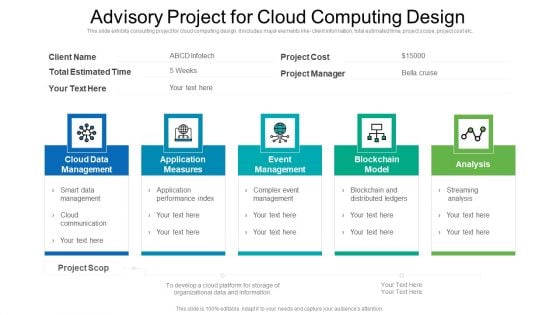
Advisory Project For Cloud Computing Design Ppt PowerPoint Presentation File Information PDF
This slide exhibits consulting project for cloud computing design. it includes major elements like- client information, total estimated time, project scope, project cost etc. Persuade your audience using this advisory project for cloud computing design ppt powerpoint presentation file information pdf. This PPT design covers five stages, thus making it a great tool to use. It also caters to a variety of topics including cloud data management, application measures, event management, blockchain model, analysis. Download this PPT design now to present a convincing pitch that not only emphasizes the topic but also showcases your presentation skills.
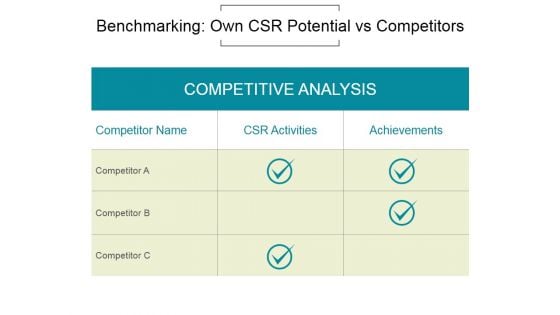
Benchmarking Own Csr Potential Vs Competitors Ppt PowerPoint Presentation Images
This is a benchmarking own csr potential vs competitors ppt powerpoint presentation images. This is a two stage process. The stages in this process are competitive analysis, competitor name, csr activities, achievements.
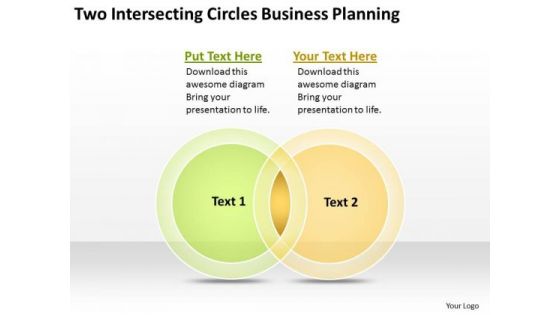
Intersecting Circles Business Planning For Small PowerPoint Slides
We present our intersecting circles business planning for small PowerPoint Slides.Use our Circle Charts PowerPoint Templates because It will Give impetus to the hopes of your colleagues. Our PowerPoint Templates and Slides will aid you in winning their trust. Download our Business PowerPoint Templates because It can Bubble and burst with your ideas. Present our Shapes PowerPoint Templates because Our PowerPoint Templates and Slides will weave a web of your great ideas. They are gauranteed to attract even the most critical of your colleagues. Download our Signs PowerPoint Templates because Our PowerPoint Templates and Slides will give you great value for your money. Be assured of finding the best projection to highlight your words. Use our Metaphors-Visual Concepts PowerPoint Templates because Our PowerPoint Templates and Slides will Activate the energies of your audience. Get their creative juices flowing with your words.Use these PowerPoint slides for presentations relating to interpretation, interpreting, fact, venn, diagram, faith, religion, know, wisdom, understand, two, circles, 2, wise, intersection, history, intelligence, measurement, god, versus, knowledgeable, overlapping, intelligent, believe, belief, religious, learn, illustration, church, area, round, believer, understanding, science, intersect, school, venn diagram, teach, overlap, education, knowledge, intersecting, knowing, conceptual, believing, overlapped, educating, vs, measure. The prominent colors used in the PowerPoint template are Yellow, Green, White. Impress a church with our Intersecting Circles Business Planning For Small PowerPoint Slides. Just download, type and present.
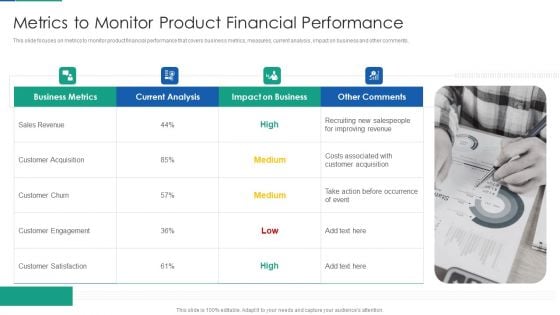
Agile Product Life Process Management Metrics To Monitor Product Financial Performance Ideas PDF
This slide focuses on metrics to monitor product financial performance that covers business metrics, measures, current analysis, impact on business and other comments. Presenting agile product life process management metrics to monitor product financial performance ideas pdf to provide visual cues and insights. Share and navigate important information on four stages that need your due attention. This template can be used to pitch topics like metrics to monitor product financial performance . In addtion, this PPT design contains high resolution images, graphics, etc, that are easily editable and available for immediate download.
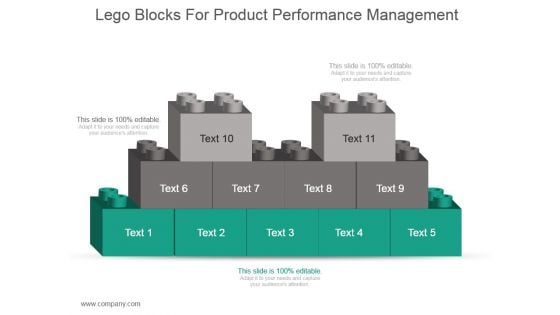
Lego Blocks For Product Performance Management Ppt Slide Styles
This is a lego blocks for product performance management ppt slide styles. This is a eleven stage process. The stages in this process are business, strategy, marketing, lego, build and text, analysis.
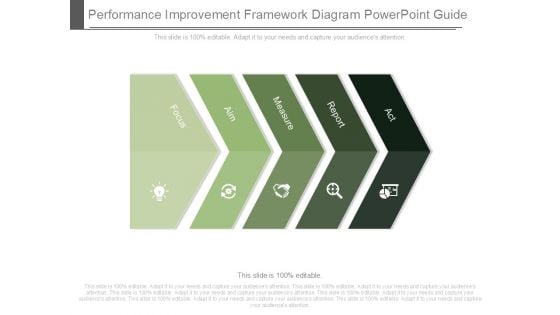
Performance Improvement Framework Diagram Powerpoint Guide
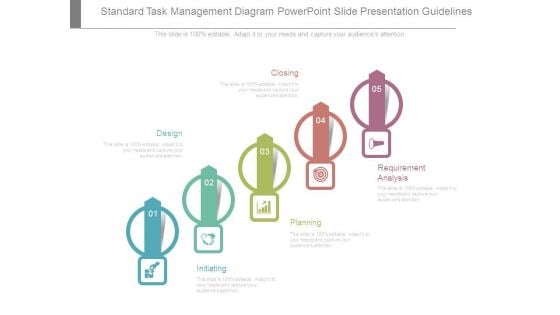
Standard Task Management Diagram Powerpoint Slide Presentation Guidelines
This is a standard task management diagram powerpoint slide presentation guidelines. This is a five stage process. The stages in this process are design, closing, initiating, planning, requirement analysis.
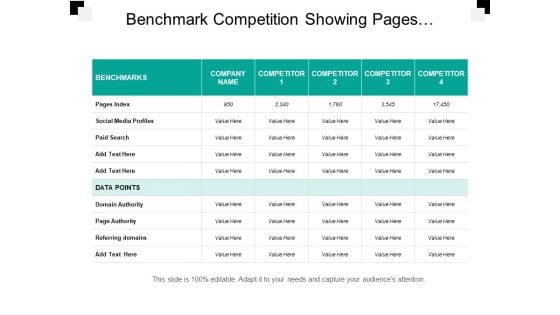
Social Media Benchmarking Page Index Data Points Ppt PowerPoint Presentation Infographics Show
This is a social media benchmarking page index data points ppt powerpoint presentation infographics show. This is a six stage process. The stages in this process are competitive analysis, benchmark competition, competition landscape.
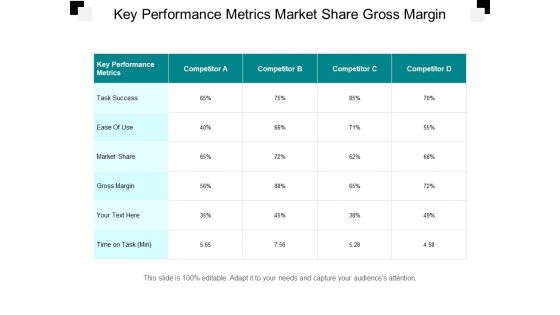
Key Performance Metrics Market Share Gross Margin Ppt PowerPoint Presentation File Design Inspiration
This is a key performance metrics market share gross margin ppt powerpoint presentation file design inspiration. This is a five stage process. The stages in this process are competitive analysis, benchmark competition, competition landscape.
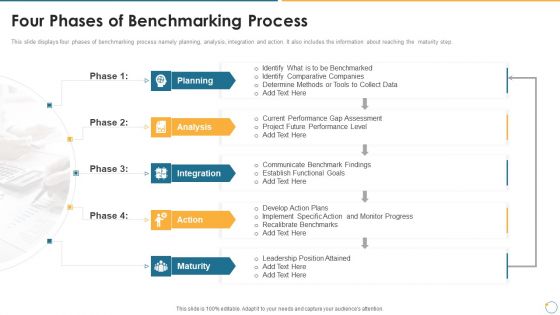
Collection Of Quality Assurance PPT Four Phases Of Benchmarking Process Infographics PDF
This slide displays four phases of benchmarking process namely planning, analysis, integration and action. It also includes the information about reaching the maturity step. This is a collection of quality assurance ppt four phases of benchmarking process infographics pdf template with various stages. Focus and dispense information on five stages using this creative set, that comes with editable features. It contains large content boxes to add your information on topics like analysis, planning, integration, maturity, action. You can also showcase facts, figures, and other relevant content using this PPT layout. Grab it now.
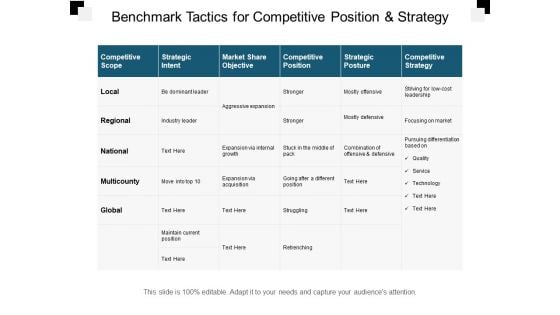
Benchmark Tactics For Competitive Position And Strategy Ppt PowerPoint Presentation Summary Layout Ideas
This is a benchmark tactics for competitive position and strategy ppt powerpoint presentation summary layout ideas. This is a six stage process. The stages in this process are competitive analysis, benchmark competition, competition landscape.
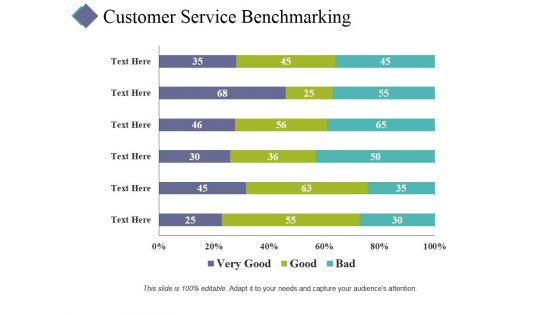
Customer Service Benchmarking Template 1 Ppt PowerPoint Presentation Infographic Template Shapes
This is a customer service benchmarking template 1 ppt powerpoint presentation infographic template shapes. This is a three stage process. The stages in this process are business, finance, marketing, strategy, analysis.
Half Yearly Quality Improvement Business Plan Ppt PowerPoint Presentation Professional Icons PDF
This slide showcase the steps to be taken for improvising the quality standards of products. It business analysis, problem assessment , formulating blue plan, policy formulation, incentive introduction and output analysis.Persuade your audience using this Half Yearly Quality Improvement Business Plan Ppt PowerPoint Presentation Professional Icons PDF. This PPT design covers six stages, thus making it a great tool to use. It also caters to a variety of topics including Business Analysis, Problem Assessment, Formulating Blue. Download this PPT design now to present a convincing pitch that not only emphasizes the topic but also showcases your presentation skills.
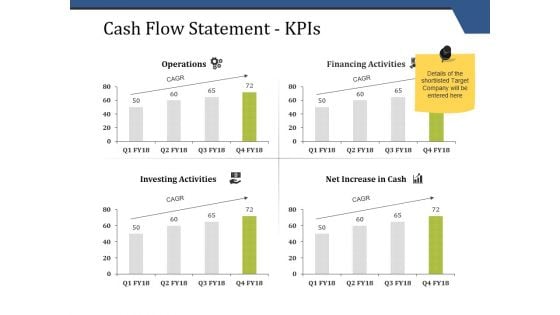
Cash Flow Statement Kpis Ppt PowerPoint Presentation Summary Graphics
This is a cash flow statement kpis ppt powerpoint presentation summary graphics. This is a four stage process. The stages in this process are business, compare sheet, management, analysis, strategy.
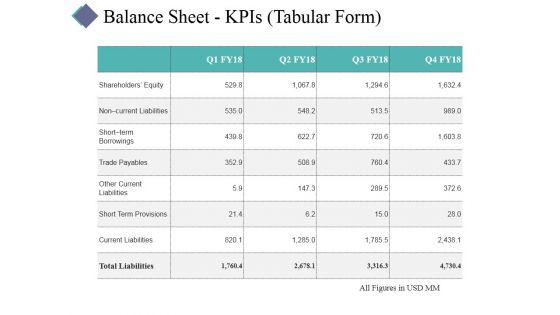
Balance Sheet Kpis Template 1 Ppt PowerPoint Presentation Gallery Visuals
This is a balance sheet kpis template 1 ppt powerpoint presentation gallery visuals. This is a four stage process. The stages in this process are business, table, management, analysis, success.
Balance Sheet Kpis Trade Payables Ppt Powerpoint Presentation Gallery Icon
This is a balance sheet kpis trade payables ppt powerpoint presentation gallery icon. This is a four stage process. The stages in this process are finance, marketing, management, investment, analysis.
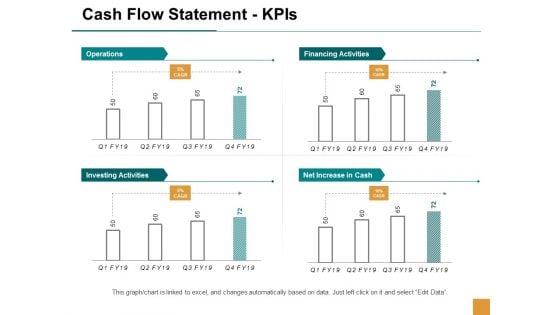
Cash Flow Statement Kpis Ppt Powerpoint Presentation Styles Graphics Tutorials
This is a cash flow statement kpis ppt powerpoint presentation styles graphics tutorials. This is a four stage process. The stages in this process are finance, marketing, management, investment, analysis.
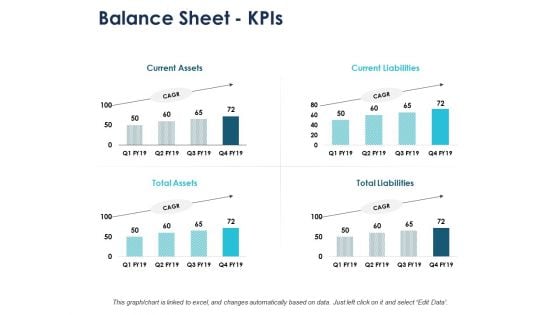
Balance Sheet Kpis Marketing Ppt PowerPoint Presentation File Pictures
This is a balance sheet kpis marketing ppt powerpoint presentation file pictures. This is a four stage process. The stages in this process are finance, marketing, management, investment, analysis.

New Product Process Development Ppt Samples
This is a new product process development ppt samples. This is a eight stage process. The stages in this process are idea generation, idea screening, concept testing, business analysis, product development, test marketing, commercialization, review of market performance.
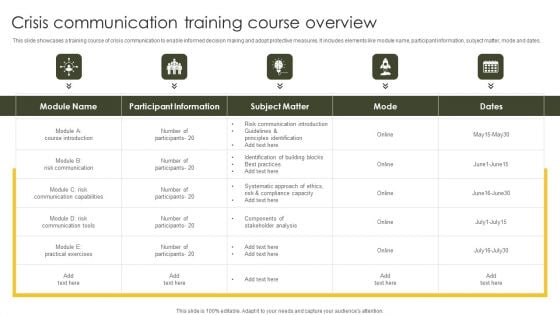
Crisis Communication Training Course Overview Professional PDF
This slide showcases a training course of crisis communication to enable informed decision making and adopt protective measures. It includes elements like module name, participant information, subject matter, mode and dates. Pitch your topic with ease and precision using this Crisis Communication Training Course Overview Professional PDF. This layout presents information on Participant Information, Risk Communication, Analysis. It is also available for immediate download and adjustment. So, changes can be made in the color, design, graphics or any other component to create a unique layout.
Software Development Performance Metrics Diagram Ppt Slide
This is a software development performance metrics diagram ppt slide. This is a three stage process. The stages in this process are overall business strategy, situation analysis, priority setting.
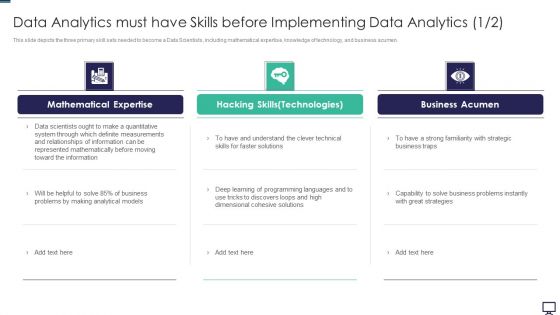
Data Analytics Must Have Skills Before Implementing Data Analytics Ppt Ideas PDF
This slide depicts the three primary skill sets needed to become a Data Scientists, including mathematical expertise, knowledge of technology, and business acumen. Deliver an awe inspiring pitch with this creative data analytics must have skills before implementing data analytics ppt ideas pdf bundle. Topics like business, system, measurements, information can be discussed with this completely editable template. It is available for immediate download depending on the needs and requirements of the user.
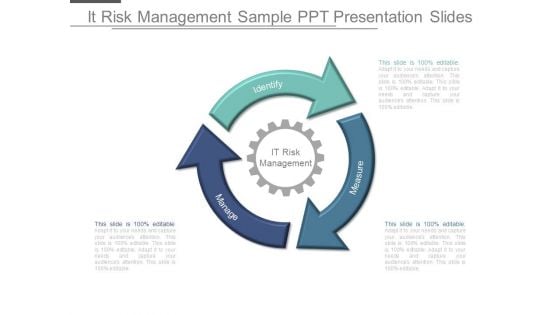
It Risk Management Sample Ppt Presentation Slides
This is a it risk management sample ppt presentation slides. This is a three stage process. The stages in this process are identify, manage, measure, it risk management.
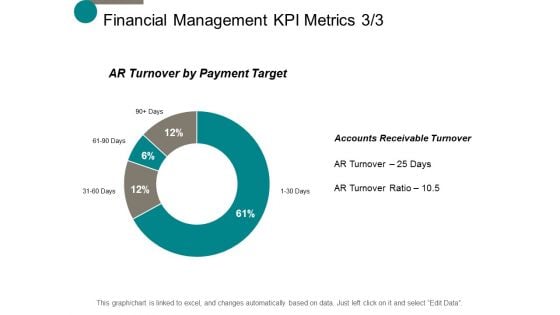
Financial Management Kpi Metrics Process Ppt Powerpoint Presentation Slides Graphics Download
This is a financial management kpi metrics process ppt powerpoint presentation slides graphics download. This is a four stage process. The stages in this process are finance, marketing, management, investment, analysis.
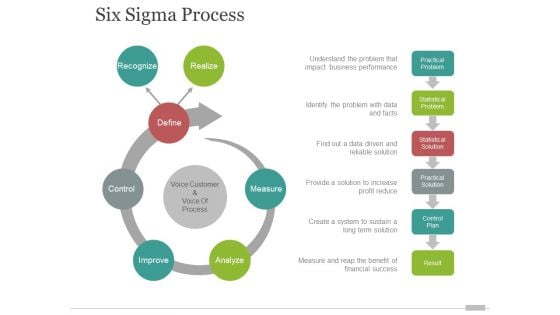
six sigma process ppt powerpoint presentation summary elements
This is a six sigma process ppt powerpoint presentation summary elements. This is a five stage process. The stages in this process are recognize, realize, define, measure, analyze.
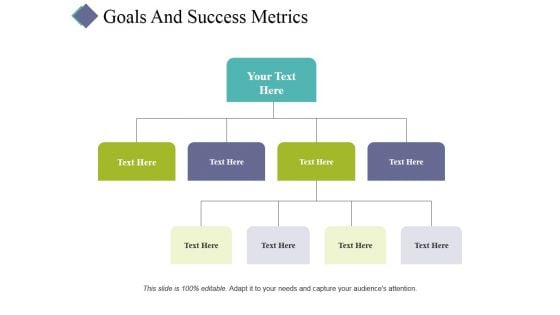
Goals And Success Metrics Ppt PowerPoint Presentation Pictures Shapes
This is a goals and success metrics ppt powerpoint presentation pictures shapes. This is a four stage process. The stages in this process are business, process, management, strategy, analysis.
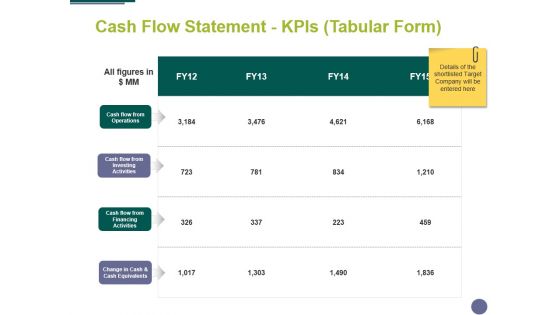
Cash Flow Statement Kpis Tabular Form Ppt PowerPoint Presentation Styles Design Inspiration
This is a cash flow statement kpis tabular form ppt powerpoint presentation styles design inspiration. This is a four stage process. The stages in this process are finance, analysis, management, business, marketing.
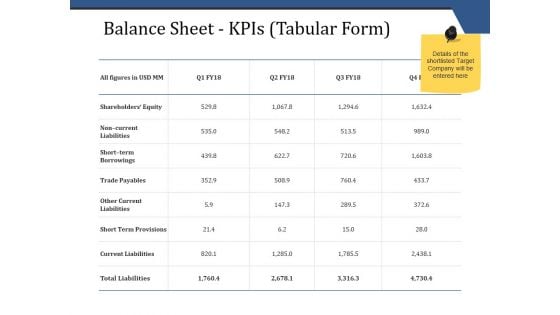
Balance Sheet Kpis Tabular Form Template 1 Ppt PowerPoint Presentation Infographics Picture
This is a balance sheet kpis tabular form template 1 ppt powerpoint presentation infographics picture. This is a four stage process. The stages in this process are business, finance, analysis, investment, strategy.
Balance Sheet Kpis Tabular Form Template 2 Ppt PowerPoint Presentation Icon Clipart
This is a balance sheet kpis tabular form template 2 ppt powerpoint presentation icon clipart. This is a four stage process. The stages in this process are business, finance, analysis, investment, strategy.
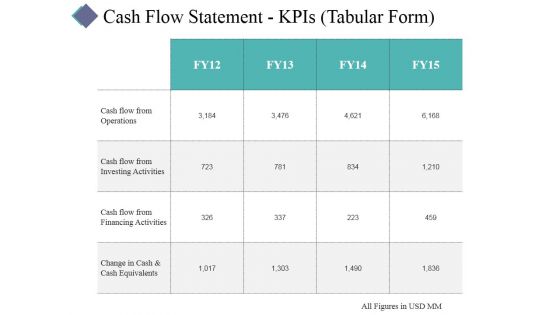
Cash Flow Statement Kpis Template 1 Ppt PowerPoint Presentation Infographic Template Master Slide
This is a cash flow statement kpis template 1 ppt powerpoint presentation infographic template master slide. This is a four stage process. The stages in this process are business, table, management, analysis, success.
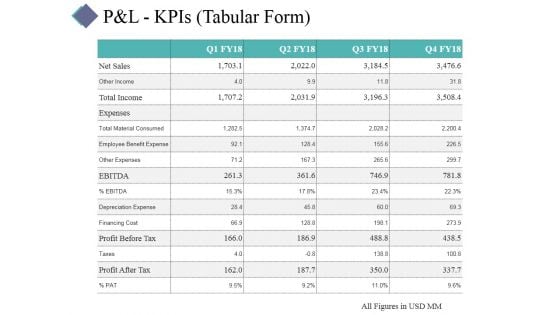
P And L Kpis Template 1 Ppt PowerPoint Presentation Portfolio Visual Aids
This is a p and l kpis template 1 ppt powerpoint presentation portfolio visual aids. This is a four stage process. The stages in this process are business, table, management, analysis, strategy.
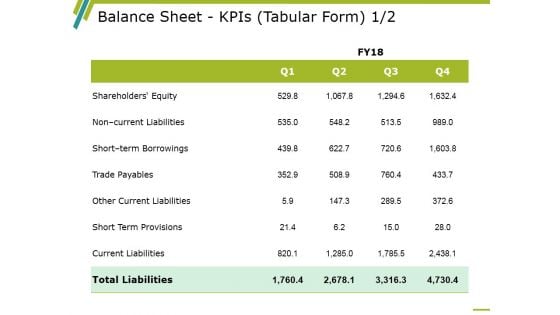
Balance Sheet Kpis Template 1 Ppt PowerPoint Presentation Infographic Template Example 2015
This is a balance sheet kpis template 1 ppt powerpoint presentation infographic template example 2015. This is a four stage process. The stages in this process are balance sheet, finance, marketing, strategy, analysis.
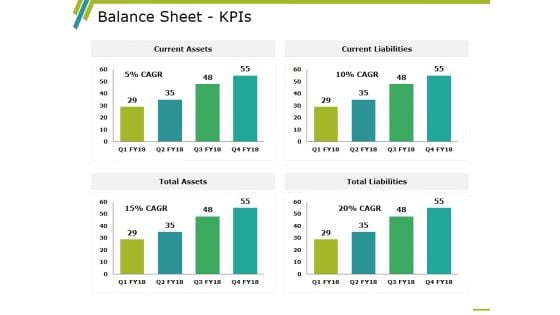
Balance Sheet Kpis Template 3 Ppt PowerPoint Presentation Infographic Template Demonstration
This is a balance sheet kpis template 3 ppt powerpoint presentation infographic template demonstration. This is a four stage process. The stages in this process are balance sheet, finance, marketing, strategy, analysis.

Cash Flow Statement Kpis Template 1 Ppt PowerPoint Presentation Infographics Summary
This is a cash flow statement kpis template 1 ppt powerpoint presentation infographics summary. This is a four stage process. The stages in this process are business, management, table, strategy, analysis.
P And L Kpis Template 1 Ppt PowerPoint Presentation Icon Background Image
This is a p and l kpis template 1 ppt powerpoint presentation icon background image. This is a four stage process. The stages in this process are business, management, analysis, table, strategy.
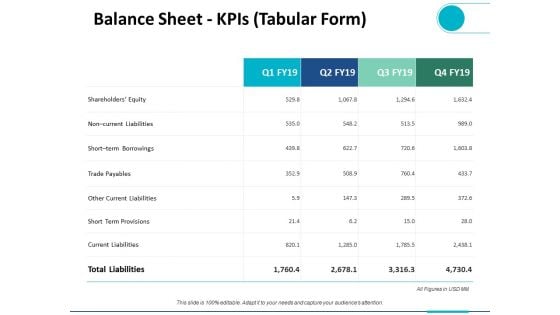
Balance Sheet Kpis Tabular Form Ppt PowerPoint Presentation Ideas Design Templates
This is a balance sheet kpis tabular form ppt powerpoint presentation ideas design templates. This is a four stage process. The stages in this process are finance, analysis, business, investment, marketing.
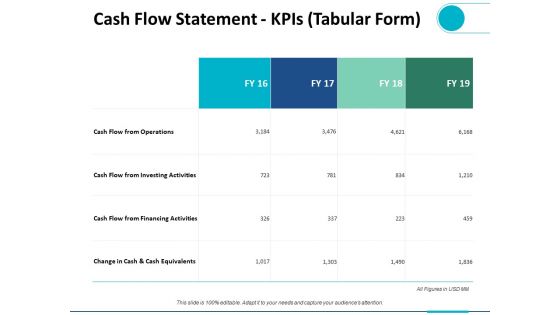
Cash Flow Statement Kpis Tabular Form Ppt PowerPoint Presentation Summary Infographic Template
This is a cash flow statement kpis tabular form ppt powerpoint presentation summary infographic template. This is a four stage process. The stages in this process are finance, analysis, business, investment, marketing.
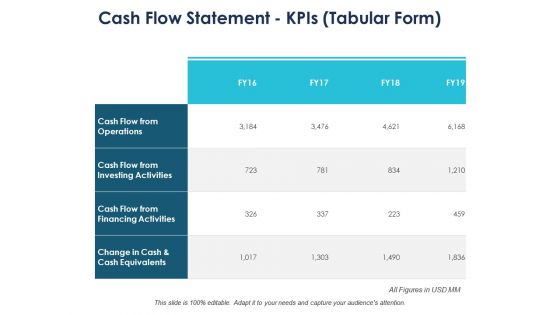
Cash Flow Statement Kpis Tabular Form Ppt PowerPoint Presentation Slides Themes
This is a cash flow statement kpis tabular form ppt powerpoint presentation slides themes. This is a four stage process. The stages in this process are finance, marketing, management, investment, analysis.
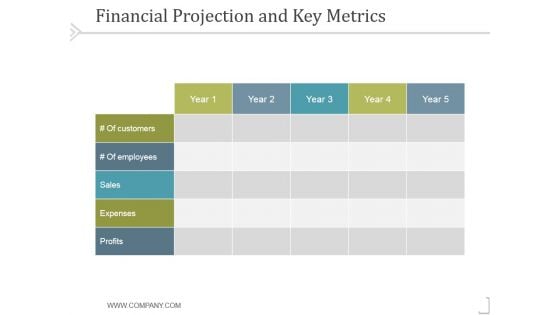
Financial Projection And Key Metrics Ppt PowerPoint Presentation Images
This is a financial projection and key metrics ppt powerpoint presentation images. This is a five stage process. The stages in this process are business, strategy, marketing, success, analysis, table.
Key Evaluation Metrics Ppt PowerPoint Presentation Layouts Icons
This is a key evaluation metrics ppt powerpoint presentation layouts icons. This is a five stage process. The stages in this process are business, icons, marketing, strategy, finance, analysis.
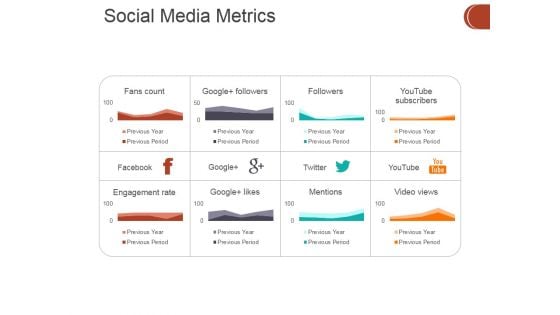
Social Media Metrics Ppt PowerPoint Presentation Portfolio Tips
This is a social media metrics ppt powerpoint presentation portfolio tips. This is a eight stage process. The stages in this process are business, finance, growth, strategy, analysis, investment.
Key Business Metrics Dashboard Ppt Powerpoint Presentation Icon Graphics Design
This is a key business metrics dashboard ppt powerpoint presentation icon graphics design. This is a five stage process. The stages in this process are finance, marketing, management, investment, analysis.
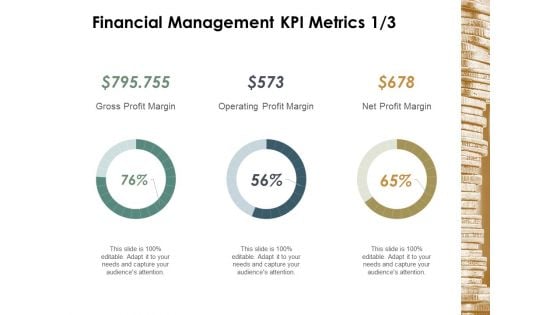
Financial Management Kpi Metrics Business Ppt Powerpoint Presentation Model Example
This is a financial management kpi metrics business ppt powerpoint presentation model example. This is a three stage process. The stages in this process are finance, marketing, management, investment, analysis.
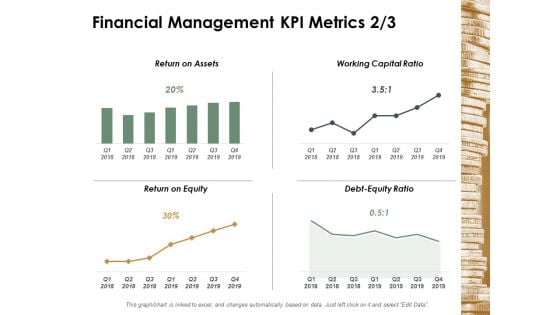
Financial Management Kpi Metrics Management Ppt Powerpoint Presentation File Template
This is a financial management kpi metrics management ppt powerpoint presentation file template. This is a four stage process. The stages in this process are finance, marketing, management, investment, analysis.
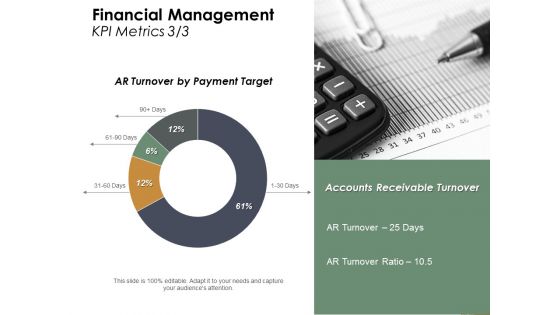
Financial Management Kpi Metrics Strategy Ppt Powerpoint Presentation Professional Show
This is a financial management kpi metrics strategy ppt powerpoint presentation professional show. This is a four stage process. The stages in this process are finance, marketing, management, investment, analysis.
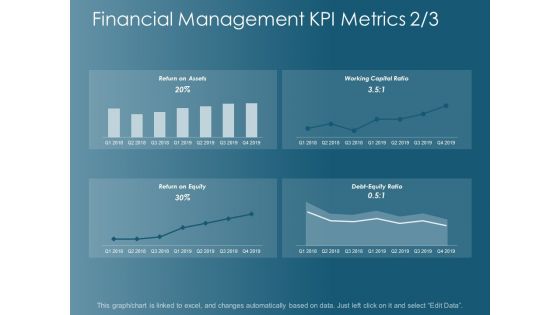
Financial Management Kpi Metrics Business Ppt Powerpoint Presentation Styles Diagrams
This is a financial management kpi metrics business ppt powerpoint presentation styles diagrams. This is a four stage process. The stages in this process are finance, marketing, management, investment, analysis.


 Continue with Email

 Home
Home


