Meter Gauge

Phases Of Smart Grid Maturity Model Navigation Smart Grid Working
This slide represents the phases of smart grid maturity model navigation and includes preparation, survey workshop, analysis, aspirations workshop and wrap up. The findings of the compass poll will indicate the utilitys AS IS condition in each of the eight domains. Are you searching for a Phases Of Smart Grid Maturity Model Navigation Smart Grid Working that is uncluttered, straightforward, and original Its easy to edit, and you can change the colors to suit your personal or business branding. For a presentation that expresses how much effort you have put in, this template is ideal With all of its features, including tables, diagrams, statistics, and lists, its perfect for a business plan presentation. Make your ideas more appealing with these professional slides. Download Phases Of Smart Grid Maturity Model Navigation Smart Grid Working from Slidegeeks today. This slide represents the phases of smart grid maturity model navigation and includes preparation, survey workshop, analysis, aspirations workshop and wrap up. The findings of the compass poll will indicate the utilitys AS IS condition in each of the eight domains.

Create A Restaurant Marketing KPI Measuring After Implementing Restaurant
The following slide showcases various key performance indicators KPIs through which marketers can evaluate the success of traditional marketing performance. The metrics mentioned in slide are customer acquisition cost CAC , cross-sells, referrals, sales per square foot, repeat purchase rate, foot traffic, average order value, etc. Crafting an eye-catching presentation has never been more straightforward. Let your presentation shine with this tasteful yet straightforward Create A Restaurant Marketing KPI Measuring After Implementing Restaurant template. It offers a minimalistic and classy look that is great for making a statement. The colors have been employed intelligently to add a bit of playfulness while still remaining professional. Construct the ideal Create A Restaurant Marketing KPI Measuring After Implementing Restaurant that effortlessly grabs the attention of your audience Begin now and be certain to wow your customers The following slide showcases various key performance indicators KPIs through which marketers can evaluate the success of traditional marketing performance. The metrics mentioned in slide are customer acquisition cost CAC , cross-sells, referrals, sales per square foot, repeat purchase rate, foot traffic, average order value, etc.
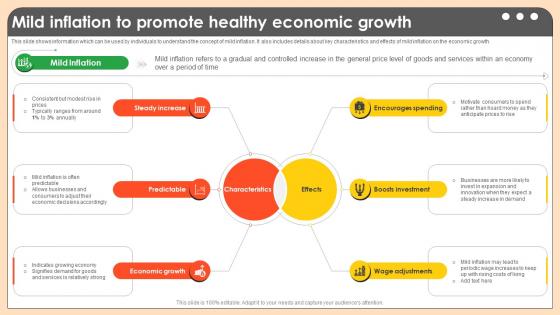
Mild Inflation To Promote Healthy Economic Growth Comprehensive Guide On Inflation Control CM SS V
This slide shows various methods which can be used to measure inflation rates in an economy or country. It includes tools such as consumer price index, producer price index, GDP deflator, asset price indices, etc. Do you know about Slidesgeeks Mild Inflation To Promote Healthy Economic Growth Comprehensive Guide On Inflation Control CM SS V These are perfect for delivering any kind od presentation. Using it, create PowerPoint presentations that communicate your ideas and engage audiences. Save time and effort by using our pre-designed presentation templates that are perfect for a wide range of topic. Our vast selection of designs covers a range of styles, from creative to business, and are all highly customizable and easy to edit. Download as a PowerPoint template or use them as Google Slides themes. This slide shows various methods which can be used to measure inflation rates in an economy or country. It includes tools such as consumer price index, producer price index, GDP deflator, asset price indices, etc.

Steps To Calculate Inflation Using Asset Price Comprehensive Guide On Inflation Control CM SS V
This slide shows step by step process which can be used to calculate inflation rate by using asset price indices. It includes stages such as select year, identify assets,, collect price data and interpret results. Get a simple yet stunning designed Steps To Calculate Inflation Using Asset Price Comprehensive Guide On Inflation Control CM SS V. It is the best one to establish the tone in your meetings. It is an excellent way to make your presentations highly effective. So, download this PPT today from Slidegeeks and see the positive impacts. Our easy-to-edit Steps To Calculate Inflation Using Asset Price Comprehensive Guide On Inflation Control CM SS V can be your go-to option for all upcoming conferences and meetings. So, what are you waiting for Grab this template today. This slide shows step by step process which can be used to calculate inflation rate by using asset price indices. It includes stages such as select year, identify assets,, collect price data and interpret results.
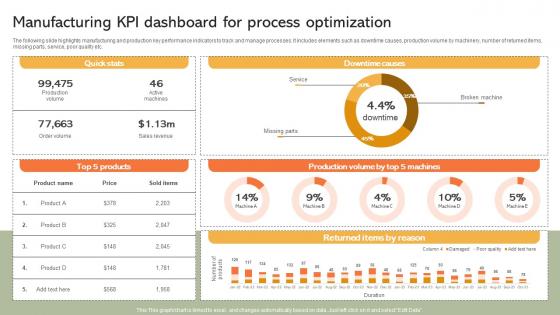
Manufacturing KPI Dashboard For Process Implementing Manufacturing Strategy SS V
The following slide highlights manufacturing and production key performance indicators to track and manage processes. It includes elements such as downtime causes, production volume by machinery, number of returned items, missing parts, service, poor quality etc. Formulating a presentation can take up a lot of effort and time, so the content and message should always be the primary focus. The visuals of the PowerPoint can enhance the presenters message, so our Manufacturing KPI Dashboard For Process Implementing Manufacturing Strategy SS V was created to help save time. Instead of worrying about the design, the presenter can concentrate on the message while our designers work on creating the ideal templates for whatever situation is needed. Slidegeeks has experts for everything from amazing designs to valuable content, we have put everything into Manufacturing KPI Dashboard For Process Implementing Manufacturing Strategy SS V The following slide highlights manufacturing and production key performance indicators to track and manage processes. It includes elements such as downtime causes, production volume by machinery, number of returned items, missing parts, service, poor quality etc.
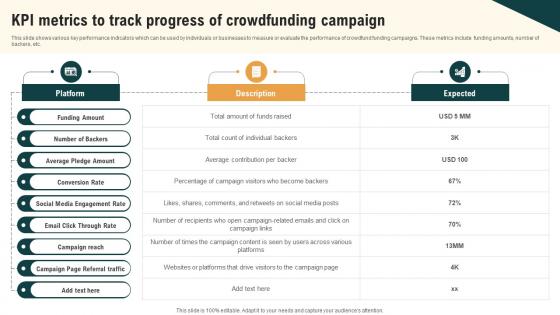
KPI Metrics To Track Progress Of Crowdfunding Real Estate Crowdfunding To Unlock Fin SS V
This slide shows various key performance indicators which can be used by individuals or businesses to measure or evaluate the performance of crowdfund funding campaigns. These metrics include funding amounts, number of backers, etc. Presenting this PowerPoint presentation, titled KPI Metrics To Track Progress Of Crowdfunding Real Estate Crowdfunding To Unlock Fin SS V, with topics curated by our researchers after extensive research. This editable presentation is available for immediate download and provides attractive features when used. Download now and captivate your audience. Presenting this KPI Metrics To Track Progress Of Crowdfunding Real Estate Crowdfunding To Unlock Fin SS V. Our researchers have carefully researched and created these slides with all aspects taken into consideration. This is a completely customizable KPI Metrics To Track Progress Of Crowdfunding Real Estate Crowdfunding To Unlock Fin SS V that is available for immediate downloading. Download now and make an impact on your audience. Highlight the attractive features available with our PPTs. This slide shows various key performance indicators which can be used by individuals or businesses to measure or evaluate the performance of crowdfund funding campaigns. These metrics include funding amounts, number of backers, etc.
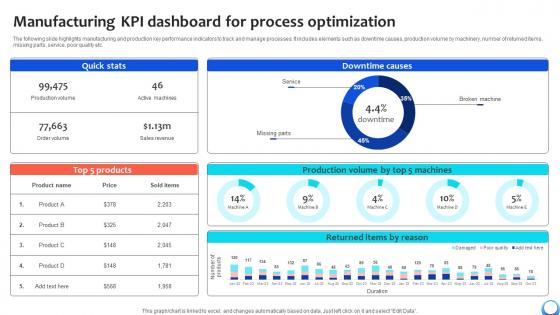
Manufacturing KPI Dashboard For Process Optimization Automating Production Process Strategy SS V
The following slide highlights manufacturing and production key performance indicators to track and manage processes. It includes elements such as downtime causes, production volume by machinery, number of returned items, missing parts, service, poor quality etc. Formulating a presentation can take up a lot of effort and time, so the content and message should always be the primary focus. The visuals of the PowerPoint can enhance the presenters message, so our Manufacturing KPI Dashboard For Process Optimization Automating Production Process Strategy SS V was created to help save time. Instead of worrying about the design, the presenter can concentrate on the message while our designers work on creating the ideal templates for whatever situation is needed. Slidegeeks has experts for everything from amazing designs to valuable content, we have put everything into Manufacturing KPI Dashboard For Process Optimization Automating Production Process Strategy SS V The following slide highlights manufacturing and production key performance indicators to track and manage processes. It includes elements such as downtime causes, production volume by machinery, number of returned items, missing parts, service, poor quality etc.
Tracking First Response Time With KPI Boosting Customer Retention Rate With Live Chat
The following slide depicts key performance indicators to review call resolution time and offer real time support. It also includes elements such as unsolved calls, weekly response time analysis, best day to call etc. Presenting this PowerPoint presentation, titled Tracking First Response Time With KPI Boosting Customer Retention Rate With Live Chat, with topics curated by our researchers after extensive research. This editable presentation is available for immediate download and provides attractive features when used. Download now and captivate your audience. Presenting this Tracking First Response Time With KPI Boosting Customer Retention Rate With Live Chat. Our researchers have carefully researched and created these slides with all aspects taken into consideration. This is a completely customizable Tracking First Response Time With KPI Boosting Customer Retention Rate With Live Chat that is available for immediate downloading. Download now and make an impact on your audience. Highlight the attractive features available with our PPTs. The following slide depicts key performance indicators to review call resolution time and offer real time support. It also includes elements such as unsolved calls, weekly response time analysis, best day to call etc.
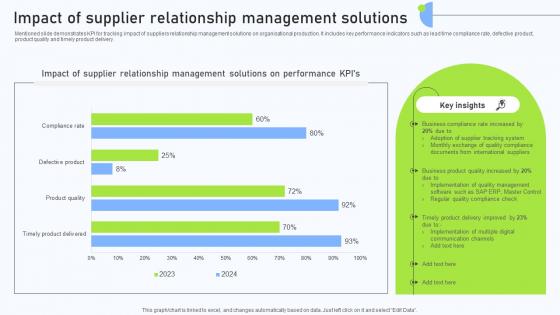
Relationship Management Automation Impact Of Supplier Relationship Management
Mentioned slide demonstrates KPI for tracking impact of suppliers relationship management solutions on organisational production. It includes key performance indicators such as lead time compliance rate, defective product, product quality and timely product delivery. Formulating a presentation can take up a lot of effort and time, so the content and message should always be the primary focus. The visuals of the PowerPoint can enhance the presenters message, so our Relationship Management Automation Impact Of Supplier Relationship Management was created to help save time. Instead of worrying about the design, the presenter can concentrate on the message while our designers work on creating the ideal templates for whatever situation is needed. Slidegeeks has experts for everything from amazing designs to valuable content, we have put everything into Relationship Management Automation Impact Of Supplier Relationship Management Mentioned slide demonstrates KPI for tracking impact of suppliers relationship management solutions on organisational production. It includes key performance indicators such as lead time compliance rate, defective product, product quality and timely product delivery.
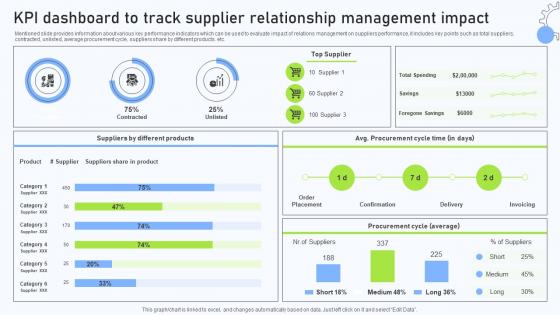
Relationship Management Automation KPI Dashboard To Track Supplier Relationship
Mentioned slide provides information about various key performance indicators which can be used to evaluate impact of relations management on suppliers performance, it includes key points such as total suppliers, contracted, unlisted, average procurement cycle, suppliers share by different products. etc. This Relationship Management Automation KPI Dashboard To Track Supplier Relationship is perfect for any presentation, be it in front of clients or colleagues. It is a versatile and stylish solution for organizing your meetings. The Relationship Management Automation KPI Dashboard To Track Supplier Relationship features a modern design for your presentation meetings. The adjustable and customizable slides provide unlimited possibilities for acing up your presentation. Slidegeeks has done all the homework before launching the product for you. So, do not wait, grab the presentation templates today Mentioned slide provides information about various key performance indicators which can be used to evaluate impact of relations management on suppliers performance, it includes key points such as total suppliers, contracted, unlisted, average procurement cycle, suppliers share by different products. etc.
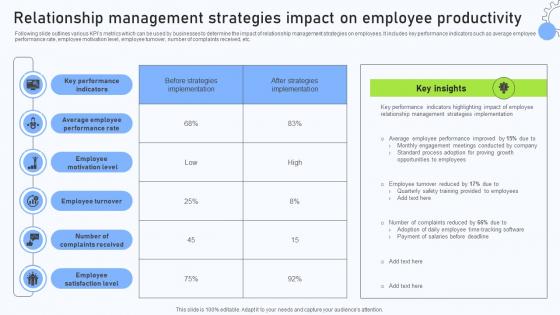
Relationship Management Strategies Impact On Employee Productivity
Following slide outlines various KPIs metrics which can be used by businesses to determine the impact of relationship management strategies on employees. It includes key performance indicators such as average employee performance rate, employee motivation level, employee turnover, number of complaints received, etc. If you are looking for a format to display your unique thoughts, then the professionally designed Relationship Management Strategies Impact On Employee Productivity is the one for you. You can use it as a Google Slides template or a PowerPoint template. Incorporate impressive visuals, symbols, images, and other charts. Modify or reorganize the text boxes as you desire. Experiment with shade schemes and font pairings. Alter, share or cooperate with other people on your work. Download Relationship Management Strategies Impact On Employee Productivity and find out how to give a successful presentation. Present a perfect display to your team and make your presentation unforgettable. Following slide outlines various KPIs metrics which can be used by businesses to determine the impact of relationship management strategies on employees. It includes key performance indicators such as average employee performance rate, employee motivation level, employee turnover, number of complaints received, etc.
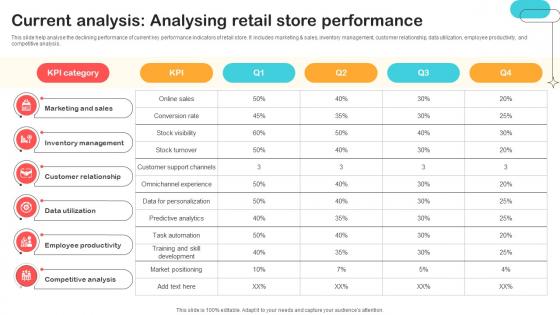
Current Analysis Analysing Retail Store Performance Optimizing Retail Operations With Digital DT SS V
This slide help analyse the declining performance of current key performance indicators of retail store. It includes marketing and sales, inventory management, customer relationship, data utilization, employee productivity, and competitive analysis.Whether you have daily or monthly meetings, a brilliant presentation is necessary. Current Analysis Analysing Retail Store Performance Optimizing Retail Operations With Digital DT SS V can be your best option for delivering a presentation. Represent everything in detail using Current Analysis Analysing Retail Store Performance Optimizing Retail Operations With Digital DT SS V and make yourself stand out in meetings. The template is versatile and follows a structure that will cater to your requirements. All the templates prepared by Slidegeeks are easy to download and edit. Our research experts have taken care of the corporate themes as well. So, give it a try and see the results. This slide help analyse the declining performance of current key performance indicators of retail store. It includes marketing and sales, inventory management, customer relationship, data utilization, employee productivity, and competitive analysis.

Post Digitalization Analysing The Impact On Retail Optimizing Retail Operations With Digital DT SS V
This slide help analyses the improving performance of key performance indicators of retail companies after successful digitalization. It includes online sales growth, cart abandonment rate, customer complaints, inventory inaccuracy, time-to-market, supply chain efficiency, foot traffic, and marketing ROI.This Post Digitalization Analysing The Impact On Retail Optimizing Retail Operations With Digital DT SS V is perfect for any presentation, be it in front of clients or colleagues. It is a versatile and stylish solution for organizing your meetings. The Post Digitalization Analysing The Impact On Retail Optimizing Retail Operations With Digital DT SS V features a modern design for your presentation meetings. The adjustable and customizable slides provide unlimited possibilities for acing up your presentation. Slidegeeks has done all the homework before launching the product for you. So, do not wait, grab the presentation templates today This slide help analyses the improving performance of key performance indicators of retail companies after successful digitalization. It includes online sales growth, cart abandonment rate, customer complaints, inventory inaccuracy, time-to-market, supply chain efficiency, foot traffic, and marketing ROI.
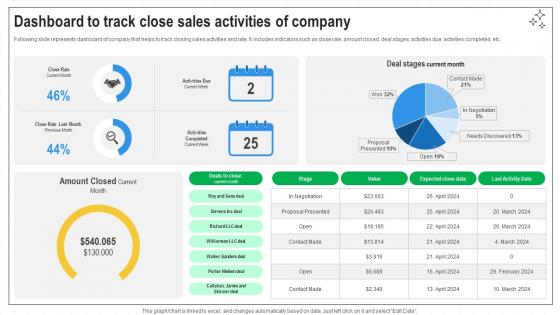
Closing Techniques To Seal Dashboard To Track Close Sales Activities Of Company SA SS V
Following slide represents dashboard of company that helps to track closing sales activities and rate. It includes indicators such as close rate, amount closed, deal stages, activities due, activities completed, etc. If you are looking for a format to display your unique thoughts, then the professionally designed Closing Techniques To Seal Dashboard To Track Close Sales Activities Of Company SA SS V is the one for you. You can use it as a Google Slides template or a PowerPoint template. Incorporate impressive visuals, symbols, images, and other charts. Modify or reorganize the text boxes as you desire. Experiment with shade schemes and font pairings. Alter, share or cooperate with other people on your work. Download Closing Techniques To Seal Dashboard To Track Close Sales Activities Of Company SA SS V and find out how to give a successful presentation. Present a perfect display to your team and make your presentation unforgettable. Following slide represents dashboard of company that helps to track closing sales activities and rate. It includes indicators such as close rate, amount closed, deal stages, activities due, activities completed, etc.
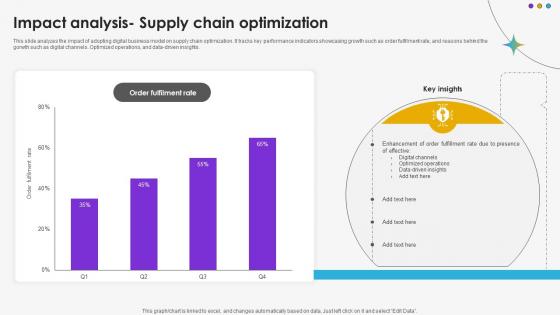
Impact Analysis Supply Chain Optimization DT SS V
This slide analyzes the impact of adopting digital business model on supply chain optimization. It tracks key performance indicators showcasing growth such as order fulfilment rate, and reasons behind the gorwth such as digital channels. Optimized operations, and data-driven insights.Whether you have daily or monthly meetings, a brilliant presentation is necessary. Impact Analysis Supply Chain Optimization DT SS V can be your best option for delivering a presentation. Represent everything in detail using Impact Analysis Supply Chain Optimization DT SS V and make yourself stand out in meetings. The template is versatile and follows a structure that will cater to your requirements. All the templates prepared by Slidegeeks are easy to download and edit. Our research experts have taken care of the corporate themes as well. So, give it a try and see the results. This slide analyzes the impact of adopting digital business model on supply chain optimization. It tracks key performance indicators showcasing growth such as order fulfilment rate, and reasons behind the gorwth such as digital channels. Optimized operations, and data-driven insights.
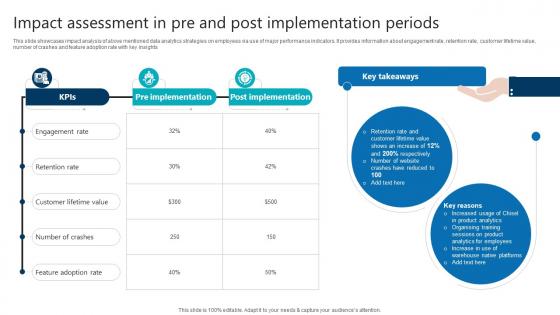
Impact Assessment In Pre And Post Implementation Periods Product Analytics Implementation Data Analytics V
This slide showcases impact analysis of above mentioned data analytics strategies on employees via use of major performance indicators. It provides information about engagement rate, retention rate, customer lifetime value, number of crashes and feature adoption rate with key insights Explore a selection of the finest Impact Assessment In Pre And Post Implementation Periods Product Analytics Implementation Data Analytics V here. With a plethora of professionally designed and pre-made slide templates, you can quickly and easily find the right one for your upcoming presentation. You can use our Impact Assessment In Pre And Post Implementation Periods Product Analytics Implementation Data Analytics V to effectively convey your message to a wider audience. Slidegeeks has done a lot of research before preparing these presentation templates. The content can be personalized and the slides are highly editable. Grab templates today from Slidegeeks. This slide showcases impact analysis of above mentioned data analytics strategies on employees via use of major performance indicators. It provides information about engagement rate, retention rate, customer lifetime value, number of crashes and feature adoption rate with key insights

Marketing Growth Strategy Customer Loyalty Program To Increase Sales Strategy SS V
The following slide outlines comprehensive loyalty program that can encourage customers to purchase more and lead to more product or service sales. It provides detailed information about program overview, advantages, objectives, target audience, and key performance indicators KPIs. Do you have to make sure that everyone on your team knows about any specific topic I yes, then you should give Marketing Growth Strategy Customer Loyalty Program To Increase Sales Strategy SS V a try. Our experts have put a lot of knowledge and effort into creating this impeccable Marketing Growth Strategy Customer Loyalty Program To Increase Sales Strategy SS V. You can use this template for your upcoming presentations, as the slides are perfect to represent even the tiniest detail. You can download these templates from the Slidegeeks website and these are easy to edit. So grab these today The following slide outlines comprehensive loyalty program that can encourage customers to purchase more and lead to more product or service sales. It provides detailed information about program overview, advantages, objectives, target audience, and key performance indicators KPIs.
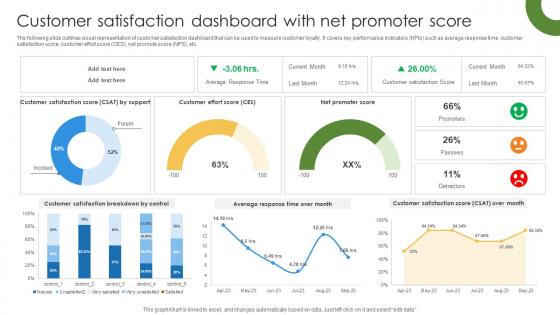
Marketing Growth Strategy Customer Satisfaction Dashboard With Net Promoter Strategy SS V
The following slide outlines visual representation of customer satisfaction dashboard that can be used to measure customer loyalty. It covers key performance indicators KPIs such as average response time, customer satisfaction score, customer effort score CES, net promote score NPS, etc. Get a simple yet stunning designed Marketing Growth Strategy Customer Satisfaction Dashboard With Net Promoter Strategy SS V. It is the best one to establish the tone in your meetings. It is an excellent way to make your presentations highly effective. So, download this PPT today from Slidegeeks and see the positive impacts. Our easy-to-edit Marketing Growth Strategy Customer Satisfaction Dashboard With Net Promoter Strategy SS V can be your go-to option for all upcoming conferences and meetings. So, what are you waiting for Grab this template today. The following slide outlines visual representation of customer satisfaction dashboard that can be used to measure customer loyalty. It covers key performance indicators KPIs such as average response time, customer satisfaction score, customer effort score CES, net promote score NPS, etc.
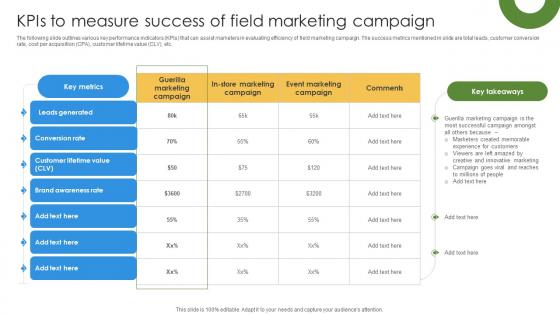
Marketing Growth Strategy Kpis To Measure Success Of Field Marketing Campaign Strategy SS V
The following slide outlines various key performance indicators KPIs that can assist marketers in evaluating efficiency of field marketing campaign. The success metrics mentioned in slide are total leads, customer conversion rate, cost per acquisition CPA, customer lifetime value CLV, etc. Welcome to our selection of the Marketing Growth Strategy Kpis To Measure Success Of Field Marketing Campaign Strategy SS V. These are designed to help you showcase your creativity and bring your sphere to life. Planning and Innovation are essential for any business that is just starting out. This collection contains the designs that you need for your everyday presentations. All of our PowerPoints are 100Percent editable, so you can customize them to suit your needs. This multi-purpose template can be used in various situations. Grab these presentation templates today. The following slide outlines various key performance indicators KPIs that can assist marketers in evaluating efficiency of field marketing campaign. The success metrics mentioned in slide are total leads, customer conversion rate, cost per acquisition CPA, customer lifetime value CLV, etc.
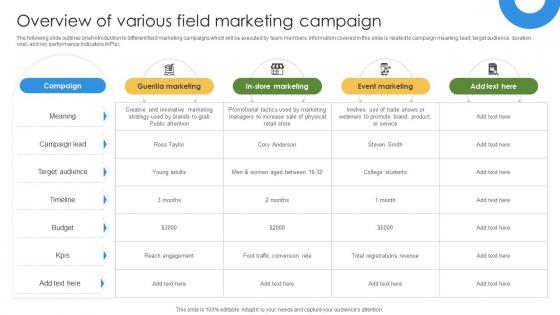
Marketing Growth Strategy Overview Of Various Field Marketing Campaign Strategy SS V
The following slide outlines brief introduction to different field marketing campaigns which will be executed by team members. Information covered in this slide is related to campaign meaning, lead, target audience, duration, cost, and key performance indicators KPIs. Here you can discover an assortment of the finest PowerPoint and Google Slides templates. With these templates, you can create presentations for a variety of purposes while simultaneously providing your audience with an eye-catching visual experience. Download Marketing Growth Strategy Overview Of Various Field Marketing Campaign Strategy SS V to deliver an impeccable presentation. These templates will make your job of preparing presentations much quicker, yet still, maintain a high level of quality. Slidegeeks has experienced researchers who prepare these templates and write high-quality content for you. Later on, you can personalize the content by editing the Marketing Growth Strategy Overview Of Various Field Marketing Campaign Strategy SS V. The following slide outlines brief introduction to different field marketing campaigns which will be executed by team members. Information covered in this slide is related to campaign meaning, lead, target audience, duration, cost, and key performance indicators KPIs.
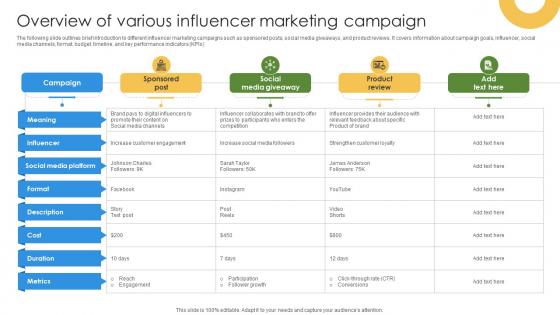
Marketing Growth Strategy To Overview Of Various Influencer Marketing Campaign Strategy SS V
The following slide outlines brief introduction to different influencer marketing campaigns such as sponsored posts, social media giveaways, and product reviews. It covers information about campaign goals, influencer, social media channels, format, budget, timeline, and key performance indicators KPIs. Present like a pro with Marketing Growth Strategy To Overview Of Various Influencer Marketing Campaign Strategy SS V. Create beautiful presentations together with your team, using our easy-to-use presentation slides. Share your ideas in real-time and make changes on the fly by downloading our templates. So whether you are in the office, on the go, or in a remote location, you can stay in sync with your team and present your ideas with confidence. With Slidegeeks presentation got a whole lot easier. Grab these presentations today. The following slide outlines brief introduction to different influencer marketing campaigns such as sponsored posts, social media giveaways, and product reviews. It covers information about campaign goals, influencer, social media channels, format, budget, timeline, and key performance indicators KPIs.
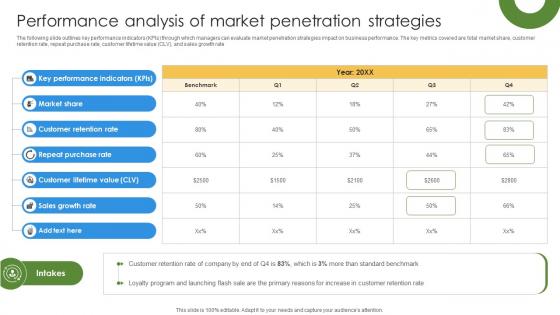
Marketing Growth Strategy To Performance Analysis Of Market Penetration Strategies Strategy SS V
The following slide outlines key performance indicators KPIs through which managers can evaluate market penetration strategies impact on business performance. The key metrics covered are total market share, customer retention rate, repeat purchase rate, customer lifetime value CLV, and sales growth rate. Slidegeeks is here to make your presentations a breeze with Marketing Growth Strategy To Performance Analysis Of Market Penetration Strategies Strategy SS V With our easy-to-use and customizable templates, you can focus on delivering your ideas rather than worrying about formatting. With a variety of designs to choose from, you are sure to find one that suits your needs. And with animations and unique photos, illustrations, and fonts, you can make your presentation pop. So whether you are giving a sales pitch or presenting to the board, make sure to check out Slidegeeks first The following slide outlines key performance indicators KPIs through which managers can evaluate market penetration strategies impact on business performance. The key metrics covered are total market share, customer retention rate, repeat purchase rate, customer lifetime value CLV, and sales growth rate.
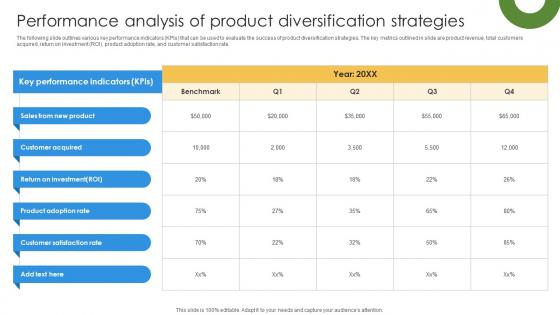
Marketing Growth Strategy To Strengthen Performance Analysis Of Product Strategy SS V
The following slide outlines various key performance indicators KPIs that can be used to evaluate the success of product diversification strategies. The key metrics outlined in slide are product revenue, total customers acquired, return on investment ROI, product adoption rate, and customer satisfaction rate. If you are looking for a format to display your unique thoughts, then the professionally designed Marketing Growth Strategy To Strengthen Performance Analysis Of Product Strategy SS V is the one for you. You can use it as a Google Slides template or a PowerPoint template. Incorporate impressive visuals, symbols, images, and other charts. Modify or reorganize the text boxes as you desire. Experiment with shade schemes and font pairings. Alter, share or cooperate with other people on your work. Download Marketing Growth Strategy To Strengthen Performance Analysis Of Product Strategy SS V and find out how to give a successful presentation. Present a perfect display to your team and make your presentation unforgettable. The following slide outlines various key performance indicators KPIs that can be used to evaluate the success of product diversification strategies. The key metrics outlined in slide are product revenue, total customers acquired, return on investment ROI, product adoption rate, and customer satisfaction rate.
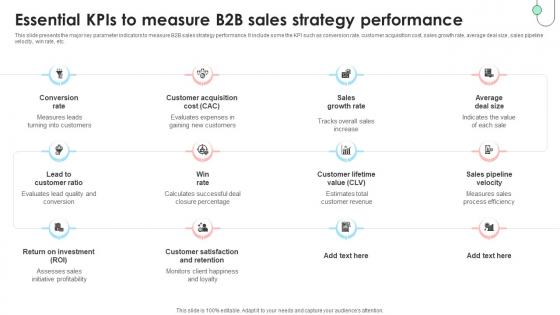
Navigating B2B Sales Essential Kpis To Measure B2B Sales Strategy SA SS V
This slide presents the major key parameter indicators to measure B2B sales strategy performance. It include some the KPI such as conversion rate, customer acquisition cost, sales growth rate, average deal size, sales pipeline velocity, win rate, etc. Here you can discover an assortment of the finest PowerPoint and Google Slides templates. With these templates, you can create presentations for a variety of purposes while simultaneously providing your audience with an eye-catching visual experience. Download Navigating B2B Sales Essential Kpis To Measure B2B Sales Strategy SA SS V to deliver an impeccable presentation. These templates will make your job of preparing presentations much quicker, yet still, maintain a high level of quality. Slidegeeks has experienced researchers who prepare these templates and write high-quality content for you. Later on, you can personalize the content by editing the Navigating B2B Sales Essential Kpis To Measure B2B Sales Strategy SA SS V. This slide presents the major key parameter indicators to measure B2B sales strategy performance. It include some the KPI such as conversion rate, customer acquisition cost, sales growth rate, average deal size, sales pipeline velocity, win rate, etc.
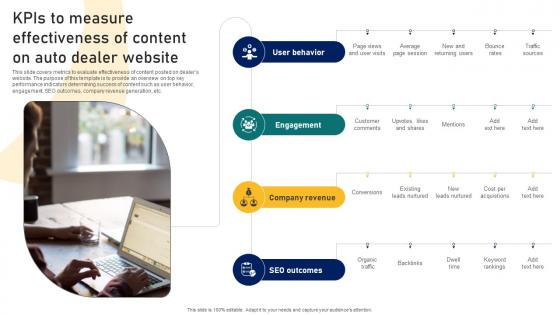
Guide To Building A Successful Kpis To Measure Effectiveness Of Content On Auto Dealer Strategy SS V
This slide covers metrics to evaluate effectiveness of content posted on dealers website. The purpose of this template is to provide an overview on top key performance indicators determining success of content such as user behavior, engagement, SEO outcomes, company revenue generation, etc. The Guide To Building A Successful Kpis To Measure Effectiveness Of Content On Auto Dealer Strategy SS V is a compilation of the most recent design trends as a series of slides. It is suitable for any subject or industry presentation, containing attractive visuals and photo spots for businesses to clearly express their messages. This template contains a variety of slides for the user to input data, such as structures to contrast two elements, bullet points, and slides for written information. Slidegeeks is prepared to create an impression. This slide covers metrics to evaluate effectiveness of content posted on dealers website. The purpose of this template is to provide an overview on top key performance indicators determining success of content such as user behavior, engagement, SEO outcomes, company revenue generation, etc.

Ultimate Guide To Developing Kpis To Measure Effectiveness Of Content On Auto Dealer Strategy SS V
This slide covers metrics to evaluate effectiveness of content posted on dealers website. The purpose of this template is to provide an overview on top key performance indicators determining success of content such as user behavior, engagement, SEO outcomes, company revenue generation, etc. The Ultimate Guide To Developing Kpis To Measure Effectiveness Of Content On Auto Dealer Strategy SS V is a compilation of the most recent design trends as a series of slides. It is suitable for any subject or industry presentation, containing attractive visuals and photo spots for businesses to clearly express their messages. This template contains a variety of slides for the user to input data, such as structures to contrast two elements, bullet points, and slides for written information. Slidegeeks is prepared to create an impression. This slide covers metrics to evaluate effectiveness of content posted on dealers website. The purpose of this template is to provide an overview on top key performance indicators determining success of content such as user behavior, engagement, SEO outcomes, company revenue generation, etc.

Digital Content Performance Assessment Top Of The Funnel Digital Content Strategy SS V
The following slide depicts key performance indicators of digital content marketing to monitor results. It includes elements such as page views, social shares, click through rate, blog subscribers, conversions, opportunities influenced, average time on page etc. Find highly impressive Digital Content Performance Assessment Top Of The Funnel Digital Content Strategy SS V on Slidegeeks to deliver a meaningful presentation. You can save an ample amount of time using these presentation templates. No need to worry to prepare everything from scratch because Slidegeeks experts have already done a huge research and work for you. You need to download Digital Content Performance Assessment Top Of The Funnel Digital Content Strategy SS V for your upcoming presentation. All the presentation templates are 100 percent editable and you can change the color and personalize the content accordingly. Download now The following slide depicts key performance indicators of digital content marketing to monitor results. It includes elements such as page views, social shares, click through rate, blog subscribers, conversions, opportunities influenced, average time on page etc.

Immersive Training For Practical Post Training Impact Of Simulation Training On Decision DTE SS V
This slide includes key performance indicators that the company has a positive impact on due to effective training programs such as team collaboration rate, error rate, etc. Formulating a presentation can take up a lot of effort and time, so the content and message should always be the primary focus. The visuals of the PowerPoint can enhance the presenters message, so our Immersive Training For Practical Post Training Impact Of Simulation Training On Decision DTE SS V was created to help save time. Instead of worrying about the design, the presenter can concentrate on the message while our designers work on creating the ideal templates for whatever situation is needed. Slidegeeks has experts for everything from amazing designs to valuable content, we have put everything into Immersive Training For Practical Post Training Impact Of Simulation Training On Decision DTE SS V. This slide includes key performance indicators that the company has a positive impact on due to effective training programs such as team collaboration rate, error rate, etc.
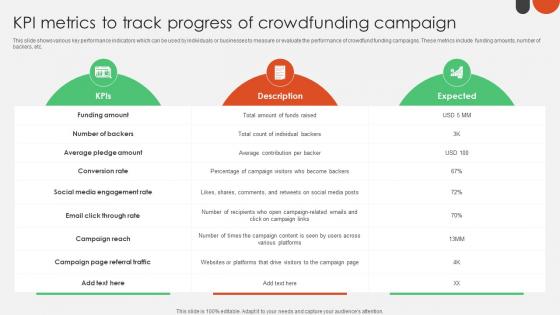
KPI Metrics To Track Progress Of Crowdfunding For Nonprofits To Support Fin SS V
This slide shows various key performance indicators which can be used by individuals or businesses to measure or evaluate the performance of crowdfund funding campaigns. These metrics include funding amounts, number of backers, etc. Presenting this PowerPoint presentation, titled KPI Metrics To Track Progress Of Crowdfunding For Nonprofits To Support Fin SS V, with topics curated by our researchers after extensive research. This editable presentation is available for immediate download and provides attractive features when used. Download now and captivate your audience. Presenting this KPI Metrics To Track Progress Of Crowdfunding For Nonprofits To Support Fin SS V. Our researchers have carefully researched and created these slides with all aspects taken into consideration. This is a completely customizable KPI Metrics To Track Progress Of Crowdfunding For Nonprofits To Support Fin SS V that is available for immediate downloading. Download now and make an impact on your audience. Highlight the attractive features available with our PPTs. This slide shows various key performance indicators which can be used by individuals or businesses to measure or evaluate the performance of crowdfund funding campaigns. These metrics include funding amounts, number of backers, etc.
KPI Dashboard For Tracking Business Investment Portfolio Investment Fund PPT Example
Mentioned slide demonstrates the key performance indicator dashboard of the business financial portfolio.It includes key elements such as portfolio value, yield cost ratio, annual dividends, unrealized gains, investment style, investment allocation by sectors, etc. Here you can discover an assortment of the finest PowerPoint and Google Slides templates. With these templates, you can create presentations for a variety of purposes while simultaneously providing your audience with an eye catching visual experience. Download KPI Dashboard For Tracking Business Investment Portfolio Investment Fund PPT Example to deliver an impeccable presentation. These templates will make your job of preparing presentations much quicker, yet still, maintain a high level of quality. Slidegeeks has experienced researchers who prepare these templates and write high quality content for you. Later on, you can personalize the content by editing the KPI Dashboard For Tracking Business Investment Portfolio Investment Fund PPT Example. Mentioned slide demonstrates the key performance indicator dashboard of the business financial portfolio.It includes key elements such as portfolio value, yield cost ratio, annual dividends, unrealized gains, investment style, investment allocation by sectors, etc.

Positive Impact Of Training On FCR Rate Customer Service Training Ppt Slide
This slide mentions the calculation of the First Contact Resolution Rate for the month of January and August indicating the pre and post-training periods respectively Presenting this PowerPoint presentation, titled Positive Impact Of Training On FCR Rate Customer Service Training Ppt Slide with topics curated by our researchers after extensive research. This editable presentation is available for immediate download and provides attractive features when used. Download now and captivate your audience. Presenting this Positive Impact Of Training On FCR Rate Customer Service Training Ppt Slide Our researchers have carefully researched and created these slides with all aspects taken into consideration. This is a completely customizable Positive Impact Of Training On FCR Rate Customer Service Training Ppt Slide that is available for immediate downloading. Download now and make an impact on your audience. Highlight the attractive features available with our PPTs. This slide mentions the calculation of the First Contact Resolution Rate for the month of January and August indicating the pre and post-training periods respectively
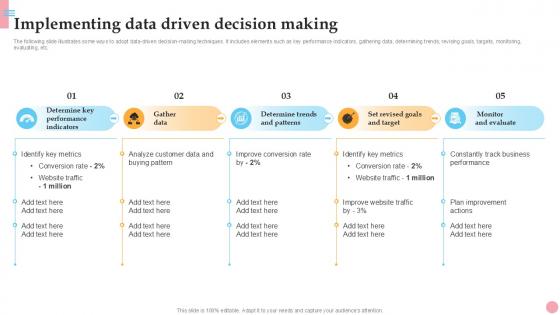
Implementing Data Driven Decision How To Improve Company PPT Sample Strategy SS V
The following slide illustrates some ways to adopt data-driven decision-making techniques. It includes elements such as key performance indicators, gathering data, determining trends, revising goals, targets, monitoring, evaluating, etc. Formulating a presentation can take up a lot of effort and time, so the content and message should always be the primary focus. The visuals of the PowerPoint can enhance the presenters message, so our Implementing Data Driven Decision How To Improve Company PPT Sample Strategy SS V was created to help save time. Instead of worrying about the design, the presenter can concentrate on the message while our designers work on creating the ideal templates for whatever situation is needed. Slidegeeks has experts for everything from amazing designs to valuable content, we have put everything into Implementing Data Driven Decision How To Improve Company PPT Sample Strategy SS V The following slide illustrates some ways to adopt data-driven decision-making techniques. It includes elements such as key performance indicators, gathering data, determining trends, revising goals, targets, monitoring, evaluating, etc.
Tracking First Response Time Improving Customer Retention PPT Presentation
The following slide depicts key performance indicators to review call resolution time and offer real time support. It also includes elements such as unsolved calls, weekly response time analysis, best day to call etc. Presenting this PowerPoint presentation, titled Tracking First Response Time Improving Customer Retention PPT Presentation, with topics curated by our researchers after extensive research. This editable presentation is available for immediate download and provides attractive features when used. Download now and captivate your audience. Presenting this Tracking First Response Time Improving Customer Retention PPT Presentation. Our researchers have carefully researched and created these slides with all aspects taken into consideration. This is a completely customizable Tracking First Response Time Improving Customer Retention PPT Presentation that is available for immediate downloading. Download now and make an impact on your audience. Highlight the attractive features available with our PPTs. The following slide depicts key performance indicators to review call resolution time and offer real time support. It also includes elements such as unsolved calls, weekly response time analysis, best day to call etc.
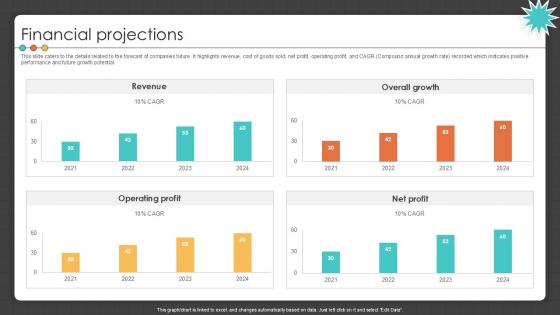
Financial Projections Manufacturing Control Software Company Investor PPT Slide
This slide caters to the details related to the forecast of companies future. It highlights revenue, cost of goods sold, net profit, operating profit, and CAGR Compound annual growth rate recorded which indicates positive performance and future growth potential. Slidegeeks is here to make your presentations a breeze with Financial Projections Manufacturing Control Software Company Investor PPT Slide With our easy-to-use and customizable templates, you can focus on delivering your ideas rather than worrying about formatting. With a variety of designs to choose from, you are sure to find one that suits your needs. And with animations and unique photos, illustrations, and fonts, you can make your presentation pop. So whether you are giving a sales pitch or presenting to the board, make sure to check out Slidegeeks first This slide caters to the details related to the forecast of companies future. It highlights revenue, cost of goods sold, net profit, operating profit, and CAGR Compound annual growth rate recorded which indicates positive performance and future growth potential.
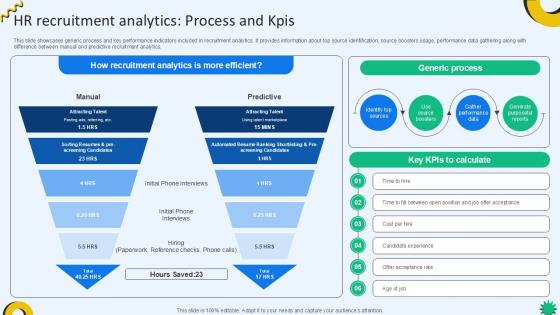
HR Recruitment Analytics Process And KPIs Cloud Recruiting Technologies PPT Sample
This slide showcases generic process and key performance indicators included in recruitment analytics. It provides information about top source identification, source boosters usage, performance data gathering along with difference between manual and predictive recruitment analytics. If you are looking for a format to display your unique thoughts, then the professionally designed HR Recruitment Analytics Process And KPIs Cloud Recruiting Technologies PPT Sample is the one for you. You can use it as a Google Slides template or a PowerPoint template. Incorporate impressive visuals, symbols, images, and other charts. Modify or reorganize the text boxes as you desire. Experiment with shade schemes and font pairings. Alter, share or cooperate with other people on your work. Download HR Recruitment Analytics Process And KPIs Cloud Recruiting Technologies PPT Sample and find out how to give a successful presentation. Present a perfect display to your team and make your presentation unforgettable. This slide showcases generic process and key performance indicators included in recruitment analytics. It provides information about top source identification, source boosters usage, performance data gathering along with difference between manual and predictive recruitment analytics.
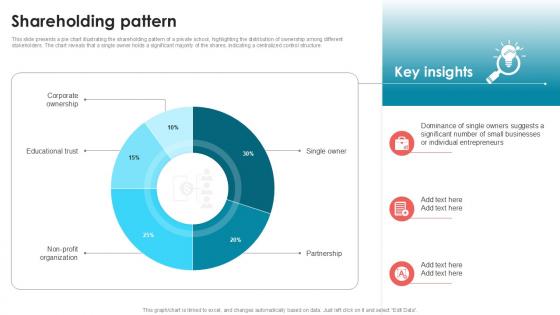
Shareholding Pattern Private School Investor Funding Elevator Pitch Deck PPT Template
This slide presents a pie chart illustrating the shareholding pattern of a private school, highlighting the distribution of ownership among different stakeholders. The chart reveals that a single owner holds a significant majority of the shares, indicating a centralized control structure. Coming up with a presentation necessitates that the majority of the effort goes into the content and the message you intend to convey. The visuals of a PowerPoint presentation can only be effective if it supplements and supports the story that is being told. Keeping this in mind our experts created Shareholding Pattern Private School Investor Funding Elevator Pitch Deck PPT Template to reduce the time that goes into designing the presentation. This way, you can concentrate on the message while our designers take care of providing you with the right template for the situation. This slide presents a pie chart illustrating the shareholding pattern of a private school, highlighting the distribution of ownership among different stakeholders. The chart reveals that a single owner holds a significant majority of the shares, indicating a centralized control structure.
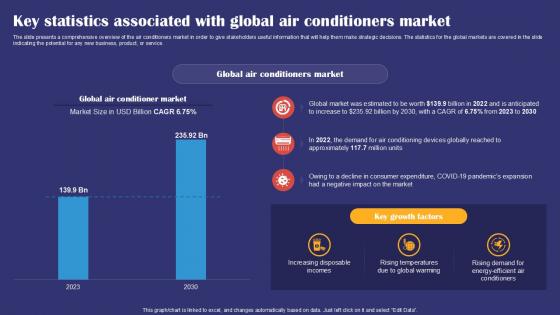
Key Statistics Associated With Global Air Conditioners Market Smartphones Industry Report PPT Sample IR SS V
The slide presents a comprehensive overview of the air conditioners market in order to give stakeholders useful information that will help them make strategic decisions. The statistics for the global markets are covered in the slide indicating the potential for any new business, product, or service. Whether you have daily or monthly meetings, a brilliant presentation is necessary. Key Statistics Associated With Global Air Conditioners Market Smartphones Industry Report PPT Sample IR SS V can be your best option for delivering a presentation. Represent everything in detail using Key Statistics Associated With Global Air Conditioners Market Smartphones Industry Report PPT Sample IR SS V and make yourself stand out in meetings. The template is versatile and follows a structure that will cater to your requirements. All the templates prepared by Slidegeeks are easy to download and edit. Our research experts have taken care of the corporate themes as well. So, give it a try and see the results. The slide presents a comprehensive overview of the air conditioners market in order to give stakeholders useful information that will help them make strategic decisions. The statistics for the global markets are covered in the slide indicating the potential for any new business, product, or service.
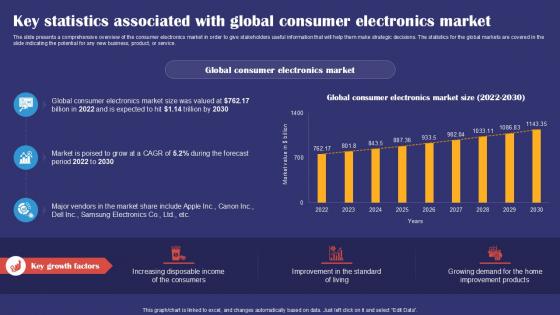
Key Statistics Associated With Global Consumer Electronics Smartphones Industry Report PPT PowerPoint IR SS V
The slide presents a comprehensive overview of the consumer electronics market in order to give stakeholders useful information that will help them make strategic decisions. The statistics for the global markets are covered in the slide indicating the potential for any new business, product, or service. Find highly impressive Key Statistics Associated With Global Consumer Electronics Smartphones Industry Report PPT PowerPoint IR SS V on Slidegeeks to deliver a meaningful presentation. You can save an ample amount of time using these presentation templates. No need to worry to prepare everything from scratch because Slidegeeks experts have already done a huge research and work for you. You need to download Key Statistics Associated With Global Consumer Electronics Smartphones Industry Report PPT PowerPoint IR SS V for your upcoming presentation. All the presentation templates are 100 percent editable and you can change the color and personalize the content accordingly. Download now The slide presents a comprehensive overview of the consumer electronics market in order to give stakeholders useful information that will help them make strategic decisions. The statistics for the global markets are covered in the slide indicating the potential for any new business, product, or service.
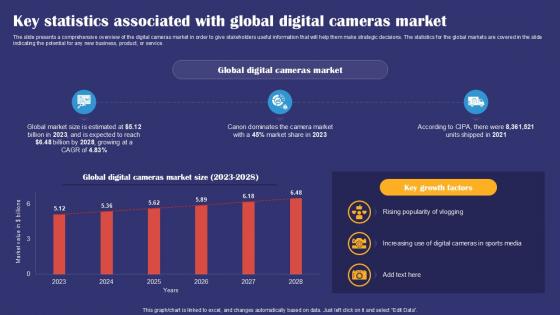
Key Statistics Associated With Global Digital Cameras Market Smartphones Industry Report PPT Template IR SS V
The slide presents a comprehensive overview of the digital cameras market in order to give stakeholders useful information that will help them make strategic decisions. The statistics for the global markets are covered in the slide indicating the potential for any new business, product, or service. If your project calls for a presentation, then Slidegeeks is your go to partner because we have professionally designed, easy to edit templates that are perfect for any presentation. After downloading, you can easily edit Key Statistics Associated With Global Digital Cameras Market Smartphones Industry Report PPT Template IR SS V and make the changes accordingly. You can rearrange slides or fill them with different images. Check out all the handy templates The slide presents a comprehensive overview of the digital cameras market in order to give stakeholders useful information that will help them make strategic decisions. The statistics for the global markets are covered in the slide indicating the potential for any new business, product, or service.
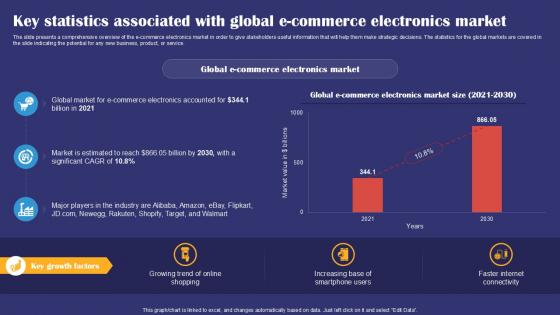
Key Statistics Associated With Global E Commerce Smartphones Industry Report PPT Presentation IR SS V
The slide presents a comprehensive overview of the e commerce electronics market in order to give stakeholders useful information that will help them make strategic decisions. The statistics for the global markets are covered in the slide indicating the potential for any new business, product, or service. If you are looking for a format to display your unique thoughts, then the professionally designed Key Statistics Associated With Global E Commerce Smartphones Industry Report PPT Presentation IR SS V is the one for you. You can use it as a Google Slides template or a PowerPoint template. Incorporate impressive visuals, symbols, images, and other charts. Modify or reorganize the text boxes as you desire. Experiment with shade schemes and font pairings. Alter, share or cooperate with other people on your work. Download Key Statistics Associated With Global E Commerce Smartphones Industry Report PPT Presentation IR SS V and find out how to give a successful presentation. Present a perfect display to your team and make your presentation unforgettable. The slide presents a comprehensive overview of the e commerce electronics market in order to give stakeholders useful information that will help them make strategic decisions. The statistics for the global markets are covered in the slide indicating the potential for any new business, product, or service.

Key Statistics Associated With Global Laptops Market Smartphones Industry Report PPT Template IR SS V
The slide presents a comprehensive overview of the laptops market in order to give stakeholders useful information that will help them make strategic decisions. The statistics for the global markets are covered in the slide indicating the potential for any new business, product, or service. Are you in need of a template that can accommodate all of your creative concepts This one is crafted professionally and can be altered to fit any style. Use it with Google Slides or PowerPoint. Include striking photographs, symbols, depictions, and other visuals. Fill, move around, or remove text boxes as desired. Test out color palettes and font mixtures. Edit and save your work, or work with colleagues. Download Key Statistics Associated With Global Laptops Market Smartphones Industry Report PPT Template IR SS V and observe how to make your presentation outstanding. Give an impeccable presentation to your group and make your presentation unforgettable. The slide presents a comprehensive overview of the laptops market in order to give stakeholders useful information that will help them make strategic decisions. The statistics for the global markets are covered in the slide indicating the potential for any new business, product, or service.
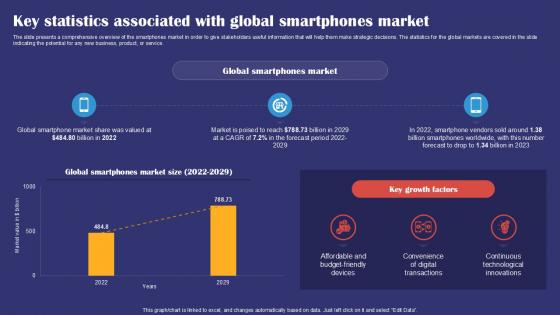
Key Statistics Associated With Global Smartphones Market Smartphones Industry Report PPT Presentation IR SS V
The slide presents a comprehensive overview of the smartphones market in order to give stakeholders useful information that will help them make strategic decisions. The statistics for the global markets are covered in the slide indicating the potential for any new business, product, or service. Crafting an eye catching presentation has never been more straightforward. Let your presentation shine with this tasteful yet straightforward Key Statistics Associated With Global Smartphones Market Smartphones Industry Report PPT Presentation IR SS V template. It offers a minimalistic and classy look that is great for making a statement. The colors have been employed intelligently to add a bit of playfulness while still remaining professional. Construct the ideal Key Statistics Associated With Global Smartphones Market Smartphones Industry Report PPT Presentation IR SS V that effortlessly grabs the attention of your audience Begin now and be certain to wow your customers The slide presents a comprehensive overview of the smartphones market in order to give stakeholders useful information that will help them make strategic decisions. The statistics for the global markets are covered in the slide indicating the potential for any new business, product, or service.
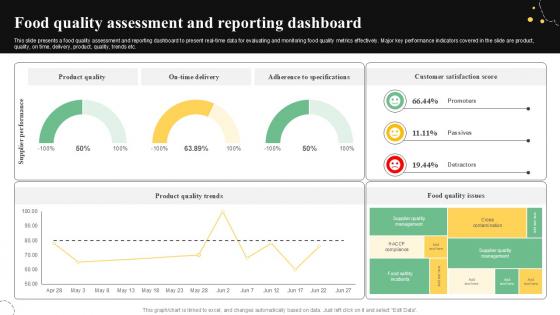
Food Quality Assessment And Reporting Quality Control Guide For Food PPT Sample
This slide presents a food quality assessment and reporting dashboard to present real-time data for evaluating and monitoring food quality metrics effectively. Major key performance indicators covered in the slide are product, quality, on time, delivery, product, quality, trends etc. Crafting an eye-catching presentation has never been more straightforward. Let your presentation shine with this tasteful yet straightforward Food Quality Assessment And Reporting Quality Control Guide For Food PPT Sample template. It offers a minimalistic and classy look that is great for making a statement. The colors have been employed intelligently to add a bit of playfulness while still remaining professional. Construct the ideal Food Quality Assessment And Reporting Quality Control Guide For Food PPT Sample that effortlessly grabs the attention of your audience Begin now and be certain to wow your customers This slide presents a food quality assessment and reporting dashboard to present real-time data for evaluating and monitoring food quality metrics effectively. Major key performance indicators covered in the slide are product, quality, on time, delivery, product, quality, trends etc.
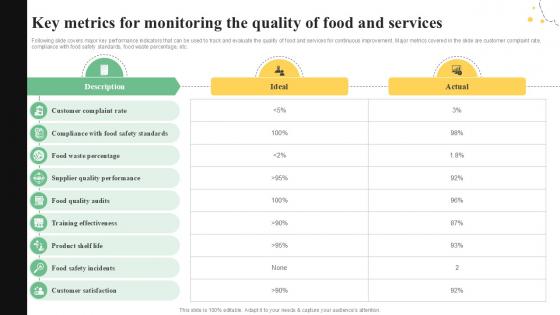
Key Metrics For Monitoring The Quality Control Guide For Food PPT Slide
Following slide covers major key performance indicators that can be used to track and evaluate the quality of food and services for continuous improvement. Major metrics covered in the slide are customer complaint rate, compliance with food safety standards, food waste percentage, etc. Explore a selection of the finest Key Metrics For Monitoring The Quality Control Guide For Food PPT Slide here. With a plethora of professionally designed and pre-made slide templates, you can quickly and easily find the right one for your upcoming presentation. You can use our Key Metrics For Monitoring The Quality Control Guide For Food PPT Slide to effectively convey your message to a wider audience. Slidegeeks has done a lot of research before preparing these presentation templates. The content can be personalized and the slides are highly editable. Grab templates today from Slidegeeks. Following slide covers major key performance indicators that can be used to track and evaluate the quality of food and services for continuous improvement. Major metrics covered in the slide are customer complaint rate, compliance with food safety standards, food waste percentage, etc.

Effective KPIs For Recruitment Employee Attraction And Competency Ppt Presentation
This slide shows main key performance indicators that are used to measure various aspects related to hiring. It include KPIs such as time to hire, cost per hire and attrition rate, etc. Whether you have daily or monthly meetings, a brilliant presentation is necessary. Effective KPIs For Recruitment Employee Attraction And Competency Ppt Presentation can be your best option for delivering a presentation. Represent everything in detail using Effective KPIs For Recruitment Employee Attraction And Competency Ppt Presentation and make yourself stand out in meetings. The template is versatile and follows a structure that will cater to your requirements. All the templates prepared by Slidegeeks are easy to download and edit. Our research experts have taken care of the corporate themes as well. So, give it a try and see the results. This slide shows main key performance indicators that are used to measure various aspects related to hiring. It include KPIs such as time to hire, cost per hire and attrition rate, etc.

Inventory KPI Powerpoint Ppt Template Bundles
This Inventory Key Performance Indicators, Stock KPIs, Stock Metrics, Supply Chain KPIs, Metrics-slide Inventory KPI Powerpoint Ppt Template Bundles is your content ready tool to impress the stakeholders with your business planning and its manner of execution. Showcase your ideas and how you plan to make them real in detail with this PPT Template Bundle. The slides have the conceptual bandwidth to present the crucial aspects of your plan, such as funding, marketing, resource allocation, timeline, roadmap, and more. When you present your plans with this PPT Layout, the stakeholders are sure to come on board because you will be able to present a succinct, thought-out, winning project. Download this Complete Deck now to take control into your hands. The 100 percent customizable offer is just too good to be resisted. Key performance indicators KPIs in inventory management are measures that assists to monitor and make choices about your stock. Our Inventory KPI Powerpoint PPT Template Bundles are topically designed to provide an attractive backdrop to any subject.
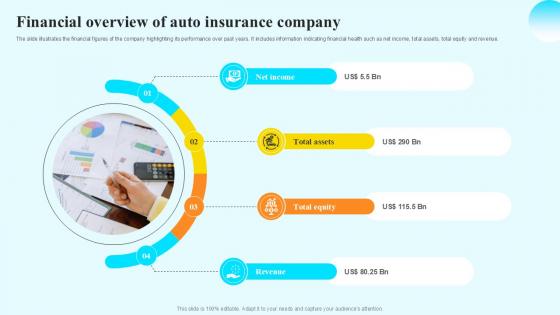
Financial Overview Of Auto Steps By Step Guide For Claiming Car PPT Sample
The slide illustrates the financial figures of the company highlighting its performance over past years. It includes information indicating financial health such as net income, total assets, total equity and revenue. If you are looking for a format to display your unique thoughts, then the professionally designed Financial Overview Of Auto Steps By Step Guide For Claiming Car PPT Sample is the one for you. You can use it as a Google Slides template or a PowerPoint template. Incorporate impressive visuals, symbols, images, and other charts. Modify or reorganize the text boxes as you desire. Experiment with shade schemes and font pairings. Alter, share or cooperate with other people on your work. Download Financial Overview Of Auto Steps By Step Guide For Claiming Car PPT Sample and find out how to give a successful presentation. Present a perfect display to your team and make your presentation unforgettable. The slide illustrates the financial figures of the company highlighting its performance over past years. It includes information indicating financial health such as net income, total assets, total equity and revenue.
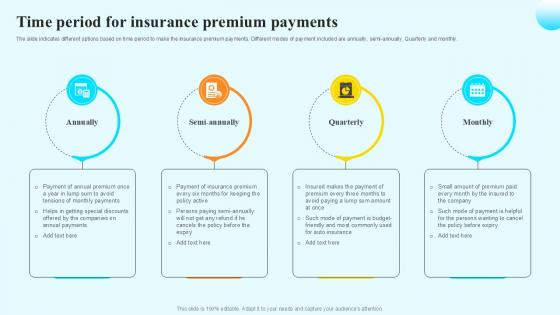
Time Period For Insurance Premium Steps By Step Guide For Claiming Car PPT Example
The slide indicates different options based on time period to make the insurance premium payments. Different modes of payment included are annually, semi-annually. Quarterly and monthly. Here you can discover an assortment of the finest PowerPoint and Google Slides templates. With these templates, you can create presentations for a variety of purposes while simultaneously providing your audience with an eye-catching visual experience. Download Time Period For Insurance Premium Steps By Step Guide For Claiming Car PPT Example to deliver an impeccable presentation. These templates will make your job of preparing presentations much quicker, yet still, maintain a high level of quality. Slidegeeks has experienced researchers who prepare these templates and write high-quality content for you. Later on, you can personalize the content by editing the Time Period For Insurance Premium Steps By Step Guide For Claiming Car PPT Example. The slide indicates different options based on time period to make the insurance premium payments. Different modes of payment included are annually, semi-annually. Quarterly and monthly.
Tracking First Response Time Enhancing Customer Experience Ppt Presentation
The following slide depicts key performance indicators to review call resolution time and offer real time support. It also includes elements such as unsolved calls, weekly response time analysis, best day to call etc. Presenting this PowerPoint presentation, titled Tracking First Response Time Enhancing Customer Experience Ppt Presentation, with topics curated by our researchers after extensive research. This editable presentation is available for immediate download and provides attractive features when used. Download now and captivate your audience. Presenting this Tracking First Response Time Enhancing Customer Experience Ppt Presentation. Our researchers have carefully researched and created these slides with all aspects taken into consideration. This is a completely customizable Tracking First Response Time Enhancing Customer Experience Ppt Presentation that is available for immediate downloading. Download now and make an impact on your audience. Highlight the attractive features available with our PPTs. The following slide depicts key performance indicators to review call resolution time and offer real time support. It also includes elements such as unsolved calls, weekly response time analysis, best day to call etc.
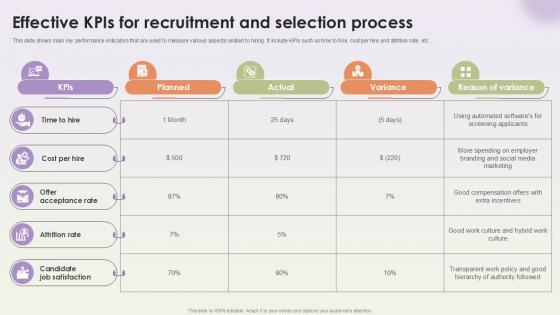
Effective Kpis For Recruitment And Selection Workforce Procurement And Aptitude Evaluation Ppt Presentation
This slide shows main key performance indicators that are used to measure various aspects related to hiring. It include KPIs such as time to hire, cost per hire and attrition rate, etc. Whether you have daily or monthly meetings, a brilliant presentation is necessary. Effective Kpis For Recruitment And Selection Workforce Procurement And Aptitude Evaluation Ppt Presentation can be your best option for delivering a presentation. Represent everything in detail using Effective Kpis For Recruitment And Selection Workforce Procurement And Aptitude Evaluation Ppt Presentation and make yourself stand out in meetings. The template is versatile and follows a structure that will cater to your requirements. All the templates prepared by Slidegeeks are easy to download and edit. Our research experts have taken care of the corporate themes as well. So, give it a try and see the results. This slide shows main key performance indicators that are used to measure various aspects related to hiring. It include KPIs such as time to hire, cost per hire and attrition rate, etc.

HR Recruitment Analytics Process And KPIs Enhancing Recruitment Process PPT PowerPoint
This slide showcases generic process and key performance indicators included in recruitment analytics. It provides information about top source identification, source boosters usage, performance data gathering along with difference between manual and predictive recruitment analytics. If you are looking for a format to display your unique thoughts, then the professionally designed HR Recruitment Analytics Process And KPIs Enhancing Recruitment Process PPT PowerPoint is the one for you. You can use it as a Google Slides template or a PowerPoint template. Incorporate impressive visuals, symbols, images, and other charts. Modify or reorganize the text boxes as you desire. Experiment with shade schemes and font pairings. Alter, share or cooperate with other people on your work. Download HR Recruitment Analytics Process And KPIs Enhancing Recruitment Process PPT PowerPoint and find out how to give a successful presentation. Present a perfect display to your team and make your presentation unforgettable. This slide showcases generic process and key performance indicators included in recruitment analytics. It provides information about top source identification, source boosters usage, performance data gathering along with difference between manual and predictive recruitment analytics.
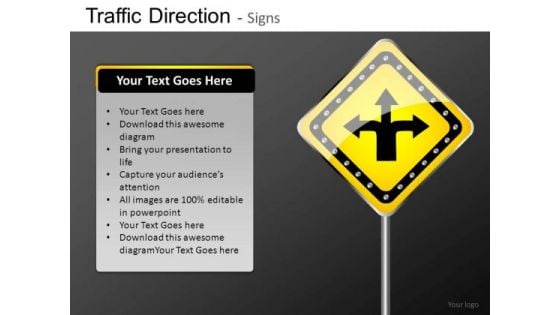
Ppt Slides Choices Of Directions Road Signs PowerPoint Templates
PPT_Slides_Choices_of_Directions_Road_Signs_PowerPoint_templates-These high quality powerpoint pre-designed slides and powerpoint templates have been carefully created by our professional team to help you impress your audience. All slides have been created and are 100% editable in powerpoint. Each and every property of any graphic - color, size, orientation, shading, outline etc. can be modified to help you build an effective powerpoint presentation. Any text can be entered at any point in the powerpoint template or slide. Simply DOWNLOAD, TYPE and PRESENT! These PowerPoint presentation slides can be used to represent themes relating to --advisory, arrow, billboard, board, career, choice, clear, crossroads, custom, decide, decision, different, direction, editable, empty, explore, guide, guidepost, idea, indicator, information, isolated, message, motivation, notice, pointer, pointing, pole, post, resizable, road, roadsign, route, scalable, select, show, sign, signage, signpost, sky, stick, stylized, success, trafficator, travel, turn, vector, warning, way-PPT_Slides_Choices_of_Directions_Road_Signs_PowerPoint_templates Our Ppt Slides Choices Of Directions Road Signs PowerPoint Templates are academically capable. They make learning a lot more fun.
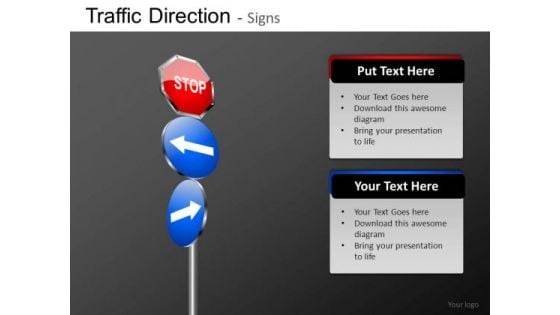
Ppt Slides Stop Sign Arrows Direction Road Signs PowerPoint Templates
PPT_Slides_Stop_Sign_Arrows_Direction_Road_Signs_PowerPoint_templates-These high quality powerpoint pre-designed slides and powerpoint templates have been carefully created by our professional team to help you impress your audience. All slides have been created and are 100% editable in powerpoint. Each and every property of any graphic - color, size, orientation, shading, outline etc. can be modified to help you build an effective powerpoint presentation. Any text can be entered at any point in the powerpoint template or slide. Simply DOWNLOAD, TYPE and PRESENT! These PowerPoint presentation slides can be used to represent themes relating to --advisory, arrow, billboard, board, career, choice, clear, crossroads, custom, decide, decision, different, direction, editable, empty, explore, guide, guidepost, idea, indicator, information, isolated, message, motivation, notice, pointer, pointing, pole, post, resizable, road, roadsign, route, scalable, select, show, sign, signage, signpost, sky, stick, stylized, success, trafficator, travel, turn, vector, warning, way-PPT_Slides_Stop_Sign_Arrows_Direction_Road_Signs_PowerPoint_templates Stitch together the fabric of your thoughts. Thread through with our Ppt Slides Stop Sign Arrows Direction Road Signs PowerPoint Templates.
Ppt Curved PowerPoint Graphics Arrows Stage 2 Forming Triangle Templates
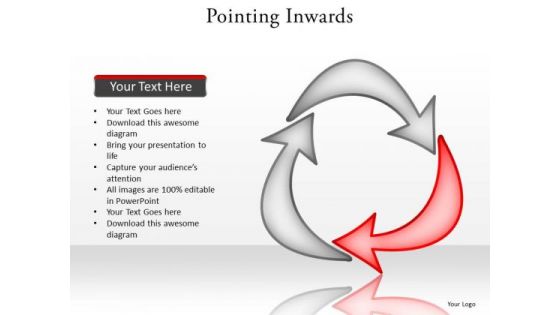
PPT curved powerpoint graphics arrows stage 2 forming triangle Templates-This PowerPoint Diagram shows the highlighted red arrow signifying the process is going on. It portrays the concept of bolt, cursor, dart, indicator, missile, pointer, projectile, shaft, achievement, attainment, close, conclusion, consummation, culmination, curtains, dispatch etc.-Can be used for presentations on around, arrow, business, button, chart, circle, collection, color, computer, curve, cycle, direction, down, ecology, element, environment, flowing, green, group, guidance, icon, isolated, leadership, leading, moving, pollution, processing, push, rotate, set, shape, shiny, sign, stick, symbol, triangle, turning, up, variation, waste-PPT curved powerpoint graphics arrows stage 2 forming triangle Templates Back up your boast with our Ppt Curved PowerPoint Graphics Arrows Stage 2 Forming Triangle Templates. Demonstrate to your audience that you can.
Ppt Four Colorful PowerPoint Background Puzzles Forming Circle Showing Yellow Templates
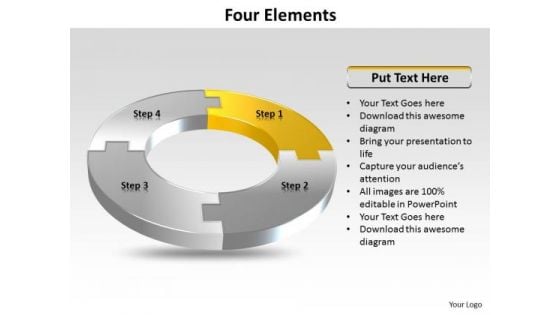
PPT four colorful powerpoint background puzzles forming circle showing yellow Templates-This PowerPoint Diagram shows the text highlighted in Yellow segment explaining the concept in circular manner. It Indicates annular, circulate, circling, dislike, indirect, oblique, orbicular, ring-shaped, round, rounded, spheroid etc.-Can be used for presentations on action, active, art, artwork, backdrop, background, beauty, body, cartoon, color, curve, dance, decoration, design, drawing, element, emotion, enjoy, enjoyment, erotic, exaltation, expression, female, girl, gladness, graphic, health, human, illustration, isolated, joy, jump, leap, life, lifestyle, love, naked, nude, ornament, people, play, sensual, sexy, shape, silhouette, slender, slim, vector, woman, young-PPT four colorful powerpoint background puzzles forming circle showing yellow Templates Show off your chops in all areas. Brandish them on our Ppt Four Colorful PowerPoint Background Puzzles Forming Circle Showing Yellow Templates.
Ppt Four Colorful PowerPoint Presentations Puzzles Forming Circle Showing Blue Templates
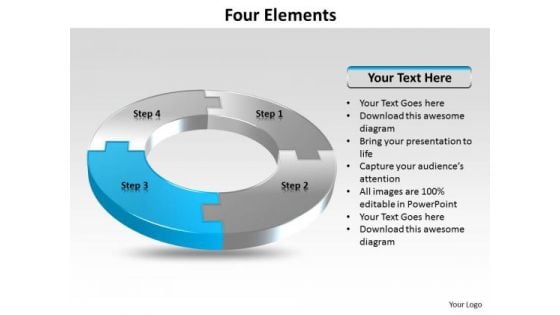
PPT four colorful powerpoint presentations puzzles forming circle showing blue Templates-This PowerPoint Diagram shows the text highlighted in blue segment explaining the concept in circular manner. It Indicates articulation, bit, compartment, cut, division, member, moiety, parcel, piece, portion, section, sector, slice, subdivision, wedge etc.-Can be used for presentations on action, active, art, artwork, backdrop, background, beauty, body, cartoon, color, curve, dance, decoration, design, drawing, element, emotion, enjoy, enjoyment, erotic, exaltation, expression, female, girl, gladness, graphic, health, human, illustration, isolated, joy, jump, leap, life, lifestyle, love, naked, nude, ornament, people, play, sensual, sexy, shape, silhouette, slender, slim, vector, woman, young-PPT four colorful powerpoint presentations puzzles forming circle showing blue Templates Encourage creativity with our Ppt Four Colorful PowerPoint Presentations Puzzles Forming Circle Showing Blue Templates. You will come out on top.
Ppt Four Colorful Puzzles Forming Circle Showing Green PowerPoint Slide Templates
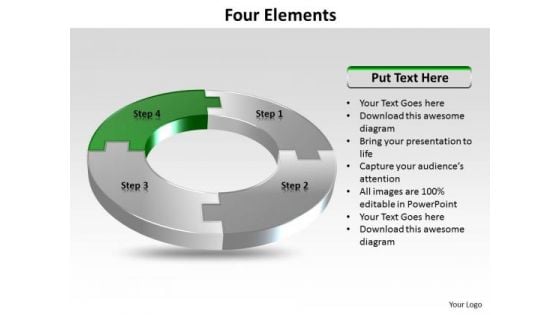
PPT four colorful puzzles forming circle showing green powerpoint slide Templates-This PowerPoint Diagram shows the text highlighted in Green segment explaining the concept in circular manner. It Indicates articulation, bit, compartment, cut, division, member, moiety, indirect, oblique, orbicular, ring-shaped, round, rounded, spheroid etc. -Can be used for presentations on action, active, art, artwork, backdrop, background, beauty, body, cartoon, color, curve, dance, decoration, design, drawing, element, emotion, enjoy, enjoyment, erotic, exaltation, expression, female, girl, gladness, graphic, health, human, illustration, isolated, joy, jump, leap, life, lifestyle, love, naked, nude, ornament, people, play, sensual, sexy, shape, silhouette, slender, slim, vector, woman, young-PPT four colorful puzzles forming circle showing green powerpoint slide Templates Your exceptional thoughts need our Ppt Four Colorful Puzzles Forming Circle Showing Green PowerPoint Slide Templates. With their support you will always excel.
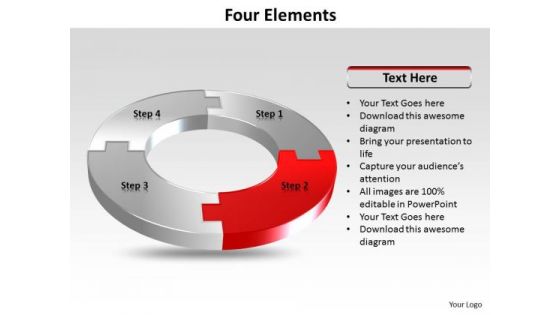
Ppt Four Colorful Puzzles Forming Circle Showing Red PowerPoint Templates
PPT four colorful puzzles forming circle showing red powerpoint templates-This PowerPoint Diagram shows the text highlighted in Red segment explaining the concept in circular manner. It Indicates articulation, bit, compartment, cut, division, member, moiety, indirect, oblique, orbicular, ring-shaped, round, rounded, spheroid etc. -Can be used for presentations on action, active, art, artwork, backdrop, background, beauty, body, cartoon, color, curve, dance, decoration, design, drawing, element, emotion, enjoy, enjoyment, erotic, exaltation, expression, female, girl, gladness, graphic, health, human, illustration, isolated, joy, jump, leap, life, lifestyle, love, naked, nude, ornament, people, play, sensual, sexy, shape, silhouette, slender, slim, vector, woman, young-PPT four colorful puzzles forming circle showing red powerpoint templates Capitalise on the benefits our Ppt Four Colorful Puzzles Forming Circle Showing Red PowerPoint Templates offer. They make the entire process a simpler one.
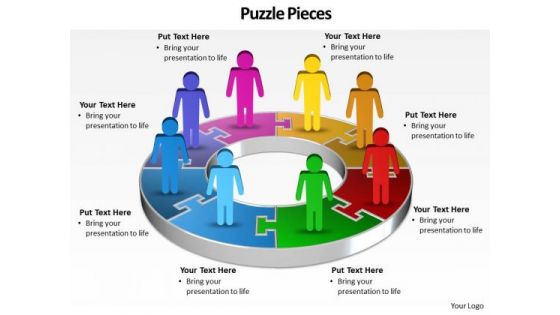
Ppt A Team Of Business People Standing On Pie PowerPoint Bar Chart Ks2 Pieces Templates
PPT a team of business people standing on pie powerpoint bar chart ks2 pieces Templates-This Business PowerPoint Diagram shows 3d linear abstraction to represent Business related issues. It uses three steps. It indicates employment, field, function, game, line, and livelihood. It is helpful to organize information. -PPT a team of business people standing on pie powerpoint bar chart ks2 pieces Templates-Abstract, Arrow, Art, Artistic, Background, Business, Colorful, Communication, Computer-Graphics, Concept, Creation, Data, Decoration, Decorative, Design, Design-Element, Digital, Direction, Effect, Elegance, Element, Energy, Flow, Go, Idea, Illustration, Modern, Movement, Network, Symbol Break out of the cocoon with our Ppt A Team Of Business People Standing On Pie PowerPoint Bar Chart Ks2 Pieces Templates. Let your thoughts take to the air.
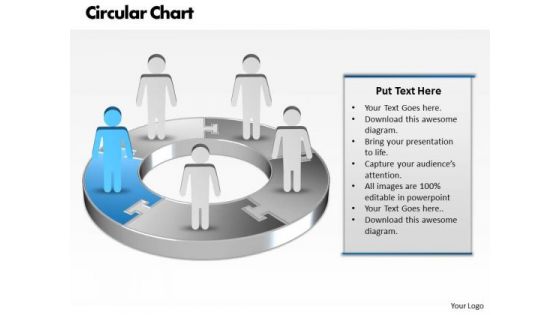
Ppt Blue Men Standing On Business Pie Organization Chart PowerPoint Template Templates
PPT blue men standing on business pie organization chart powerpoint template Templates-Use this Business based PowerPoint Diagram to represent the Business issues Graphically. It indicates arrange, block out, blueprint, cast, delineate, design, devise, draft, graph , lay out, outline, plot, project, shape, sketch etc.-PPT blue men standing on business pie organization chart powerpoint template Templates-arrow, art, basic, blank, business, capital, chart, chevron, clip, clipart, colorful, conglomerates, consumer, copy, cyclical, energy, financial, flow, goods, graph, graphic, healthcare, illustration, infographic, information, investment, isolated, market, materials, non, round, sectors, services, slide, space, stock, technology, text, Our Ppt Blue Men Standing On Business Pie Organization Chart PowerPoint Template Templates are never a drag. The audience will be always attentive.


 Continue with Email

 Home
Home


