Meter Slides
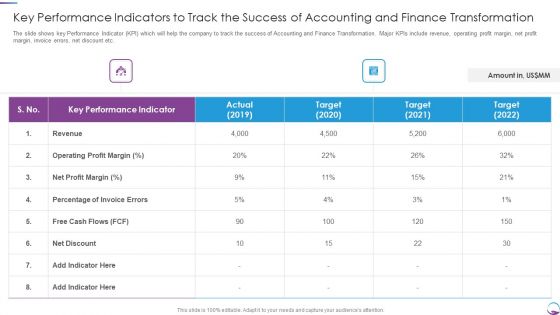
Key Performance Indicators To Track The Success Of Accounting And Finance Transformation Ideas PDF
The slide shows key Performance Indicator KPI which will help the company to track the success of Accounting and Finance Transformation. Major KPIs include revenue, operating profit margin, net profit margin, invoice errors, net discount etc. Deliver and pitch your topic in the best possible manner with this Key Performance Indicators To Track The Success Of Accounting And Finance Transformation Ideas PDF. Use them to share invaluable insights on Revenue, Net Profit Margin, Target and impress your audience. This template can be altered and modified as per your expectations. So, grab it now.
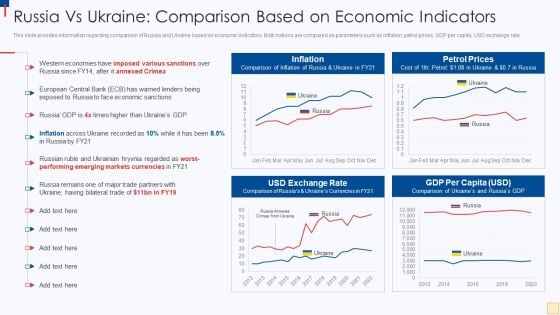
Ukraine Vs Russia Examining Russia Vs Ukraine Comparison Based On Economic Indicators Sample PDF
This slide provides information regarding comparison of Russia and Ukraine based on economic indicators. Both nations are compared on parameters such as inflation, petrol prices, GDP per capita, USD exchange rate. Deliver an awe inspiring pitch with this creative Ukraine Vs Russia Examining Russia Vs Ukraine Comparison Based On Economic Indicators Sample PDF bundle. Topics like Inflation, Petrol Prices, USD Exchange Rate, GDP Per Capita can be discussed with this completely editable template. It is available for immediate download depending on the needs and requirements of the user.
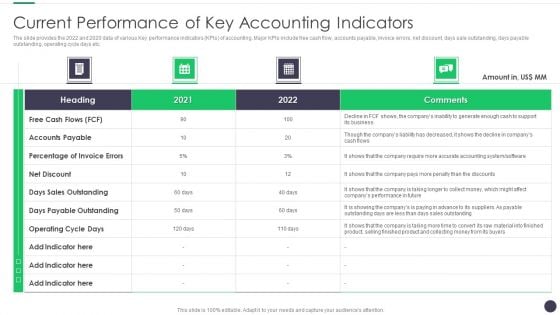
Finance And Accounting Online Conversion Plan Current Performance Of Key Accounting Indicators Template PDF
The slide provides the 2022 and 2020 data of various Key performance indicators KPIs of accounting. Major KPIs include free cash flow, accounts payable, invoice errors, net discount, days sale outstanding, days payable outstanding, operating cycle days etc. Deliver and pitch your topic in the best possible manner with this Finance And Accounting Online Conversion Plan Current Performance Of Key Accounting Indicators Template PDF. Use them to share invaluable insights on Sales Outstanding, Payable Outstanding, Accounts Payable and impress your audience. This template can be altered and modified as per your expectations. So, grab it now.

Finance And Accounting Online Conversion Plan Key Performance Indicators To Track Microsoft PDF
The slide shows key Performance Indicator KPI which will help the company to track the success of Accounting and Finance Transformation. Major KPIs include revenue, operating profit margin, net profit margin, invoice errors, net discount etc. Deliver an awe inspiring pitch with this creative Finance And Accounting Online Conversion Plan Key Performance Indicators To Track Microsoft PDF bundle. Topics like Operating Profit, Percentage Invoice, Revenue can be discussed with this completely editable template. It is available for immediate download depending on the needs and requirements of the user.
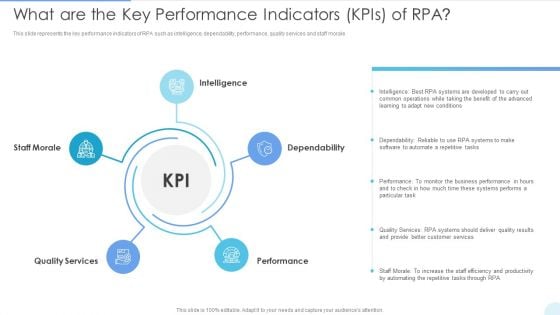
What Are The Key Performance Indicators Kpis Of RPA Structure PDF
This slide represents the key performance indicators of RPA such as intelligence, dependability, performance, quality services and staff morale. This is a What Are The Key Performance Indicators Kpis Of RPA Structure PDF template with various stages. Focus and dispense information on five stages using this creative set, that comes with editable features. It contains large content boxes to add your information on topics like Dependability, Performance, Quality Services. You can also showcase facts, figures, and other relevant content using this PPT layout. Grab it now.

Innovative Business Model Of Pharmaceutical Company Key Performance Indicators Rules PDF
The slide shows the key Performance Indicator KPI s which will help the company to track the success rate of implemented strategies. Major KPIs include number of products sold, pharma products manufactures, research and development expenses per year, total number of patients, etc.Deliver and pitch your topic in the best possible manner with this Innovative Business Model Of Pharmaceutical Company Key Performance Indicators Rules PDF. Use them to share invaluable insights on Products Manufactured, Development Expenses, Key Performance and impress your audience. This template can be altered and modified as per your expectations. So, grab it now.
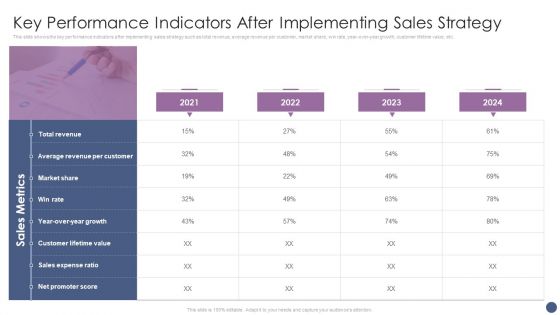
Competitive Sales Strategy Development Plan For Revenue Growth Key Performance Indicators Elements PDF
This slide shows the key performance indicators after implementing sales strategy such as total revenue, average revenue per customer, market share, win rate, year-over-year growth, customer lifetime value, etc. Presenting Competitive Sales Strategy Development Plan For Revenue Growth Key Performance Indicators Elements PDF to provide visual cues and insights. Share and navigate important information on four stages that need your due attention. This template can be used to pitch topics like Market Share, Total Revenue, Sales Expense Ratio. In addtion, this PPT design contains high resolution images, graphics, etc, that are easily editable and available for immediate download.
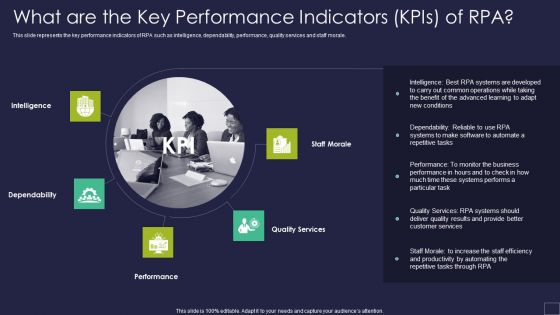
What Are The Key Performance Indicators Kpis Of RPA Robotic Process Automation Technology Graphics PDF
This slide represents the key performance indicators of RPA such as intelligence, dependability, performance, quality services and staff morale.This is a What Are The Key Performance Indicators Kpis Of RPA Robotic Process Automation Technology Graphics PDF template with various stages. Focus and dispense information on five stages using this creative set, that comes with editable features. It contains large content boxes to add your information on topics like Dependability, Intelligence, Quality Services. You can also showcase facts, figures, and other relevant content using this PPT layout. Grab it now.
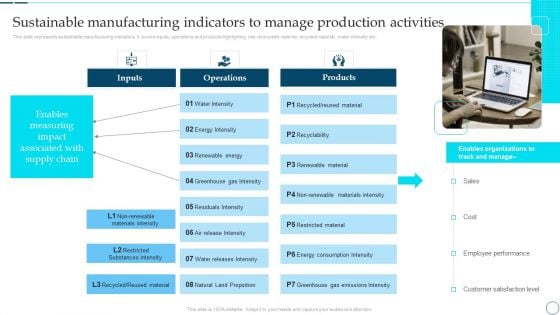
Deployment Of Smart Factory Solutions Sustainable Manufacturing Indicators To Manage Production Activities Formats PDF
This slide represents sustainable manufacturing indicators. It covers inputs, operations and products highlighting nee renewable material, recycled material, water intensity etc. Presenting Deployment Of Smart Factory Solutions Sustainable Manufacturing Indicators To Manage Production Activities Formats PDF to provide visual cues and insights. Share and navigate important information on one stages that need your due attention. This template can be used to pitch topics like Water Intensity, Energy Intensity, Renewable Energy. In addtion, this PPT design contains high resolution images, graphics, etc, that are easily editable and available for immediate download.
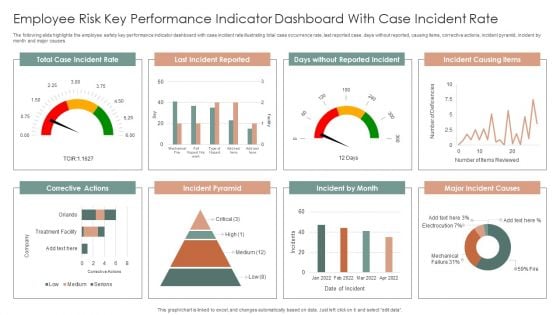
Employee Risk Key Performance Indicator Dashboard With Case Incident Rate Ppt Professional Information PDF
The following slide highlights the employee safety key performance indicator dashboard with case incident rate illustrating total case occurrence rate, last reported case, days without reported, causing items, corrective actions, incident pyramid, incident by month and major causes. Pitch your topic with ease and precision using this Employee Risk Key Performance Indicator Dashboard With Case Incident Rate Ppt Professional Information PDF. This layout presents information on Total Case, Incident Rate, Last Incident Reported, Incident Causing Items. It is also available for immediate download and adjustment. So, changes can be made in the color, design, graphics or any other component to create a unique layout.

Patient Health And Risk Key Performance Indicator Dashboard Ppt Infographic Template Summary PDF
The following slide highlights the patient health and safety key performance indicator dashboard illustrating admission by department, admission by cost, patient satisfaction, total patients, operations cost, patient density, total staff, waiting time, treatment satisfaction and treatment confidence. Pitch your topic with ease and precision using this Patient Health And Risk Key Performance Indicator Dashboard Ppt Infographic Template Summary PDF. This layout presents information on Admission By Department, Admission Vs Cost, Patient Satisfaction. It is also available for immediate download and adjustment. So, changes can be made in the color, design, graphics or any other component to create a unique layout.
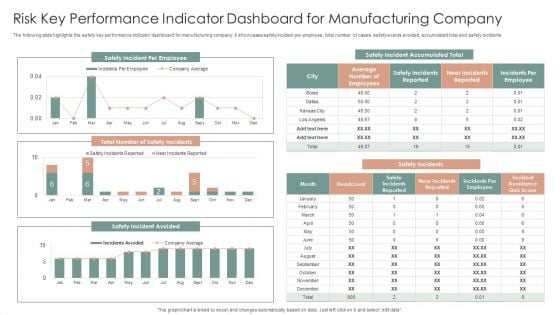
Risk Key Performance Indicator Dashboard For Manufacturing Company Ppt Gallery Graphics Design PDF
The following slide highlights the safety key performance indicator dashboard for manufacturing company. It showcases safety incident per employee, total number of cases, safety events avoided, accumulated total and safety incidents. Pitch your topic with ease and precision using this Risk Key Performance Indicator Dashboard For Manufacturing Company Ppt Gallery Graphics Design PDF. This layout presents information on Safety Incidents, Safety Incident Avoided, Safety Incident Accumulated. It is also available for immediate download and adjustment. So, changes can be made in the color, design, graphics or any other component to create a unique layout.
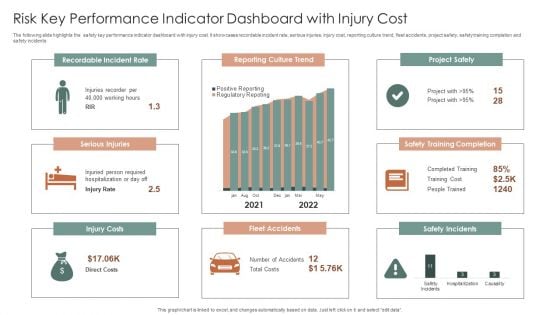
Risk Key Performance Indicator Dashboard With Injury Cost Ppt Summary Brochure PDF
The following slide highlights the safety key performance indicator dashboard with injury cost. It showcases recordable incident rate, serious injuries, injury cost, reporting culture trend, fleet accidents, project safety, safety training completion and safety incidents. Pitch your topic with ease and precision using this Risk Key Performance Indicator Dashboard With Injury Cost Ppt Summary Brochure PDF. This layout presents information on Recordable Incident Rate, Reporting Culture Trend, Project Safety. It is also available for immediate download and adjustment. So, changes can be made in the color, design, graphics or any other component to create a unique layout.
Statistics Indicating Recurring Business Operational Expenditure In Telecom Operations Icons PDF
This slide shows statistics indicating recurring operating expenditure OPEX in telecom operations which can benefit their executives in evaluating the current expenses and make cost effective amendments for future operations. It includes information about maintenance, repair, network charging and billing, customer support, marketing and operational planning costs. Pitch your topic with ease and precision using this Statistics Indicating Recurring Business Operational Expenditure In Telecom Operations Icons PDF. This layout presents information on Company, Costs, Marketing Costs. It is also available for immediate download and adjustment. So, changes can be made in the color, design, graphics or any other component to create a unique layout.
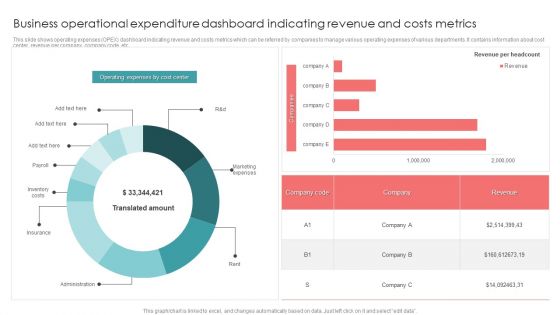
Business Operational Expenditure Dashboard Indicating Revenue And Costs Metrics Pictures PDF
This slide shows operating expenses OPEX dashboard indicating revenue and costs metrics which can be referred by companies to manage various operating expenses of various departments. It contains information about cost center, revenue per company, company code, etc. Pitch your topic with ease and precision using this Business Operational Expenditure Dashboard Indicating Revenue And Costs Metrics Pictures PDF. This layout presents information on Business Operational, Costs Metrics, Revenue. It is also available for immediate download and adjustment. So, changes can be made in the color, design, graphics or any other component to create a unique layout.
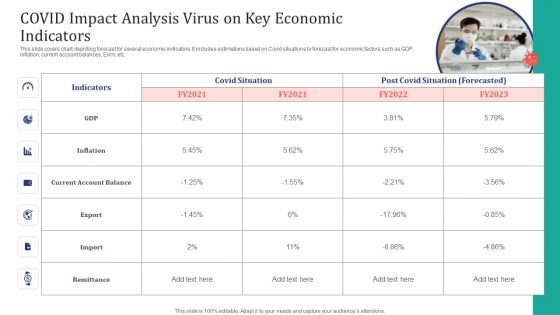
COVID Impact Analysis Virus On Key Economic Indicators Ppt Pictures Inspiration PDF
This slide covers chart depicting forecast for several economic indicators. It includes estimations based on Covid situations to forecast for economic factors such as GDP, inflation, current account balances, Exim, etc. Pitch your topic with ease and precision using this COVID Impact Analysis Virus On Key Economic Indicators Ppt Pictures Inspiration PDF. This layout presents information on Covid Situation, Post Covid Situation, Current Account Balance. It is also available for immediate download and adjustment. So, changes can be made in the color, design, graphics or any other component to create a unique layout.
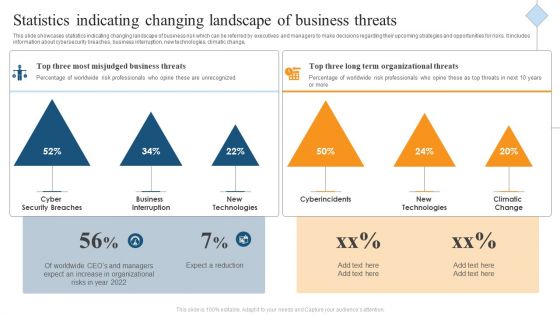
Statistics Indicating Changing Landscape Of Business Threats Ppt Model Design Templates PDF
This slide showcases statistics indicating changing landscape of business risk which can be referred by executives and managers to make decisions regarding their upcoming strategies and opportunities for risks. It includes information about cybersecurity breaches, business interruption, new technologies, climatic change, Persuade your audience using this Statistics Indicating Changing Landscape Of Business Threats Ppt Model Design Templates PDF. This PPT design covers one stages, thus making it a great tool to use. It also caters to a variety of topics including Cyber Security Breaches, Business Interruption, New Technologies. Download this PPT design now to present a convincing pitch that not only emphasizes the topic but also showcases your presentation skills.
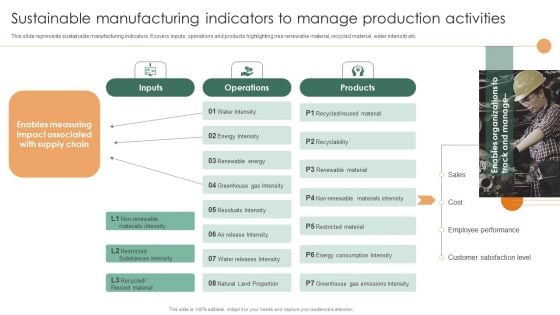
Smart Manufacturing Deployment Improve Production Procedures Sustainable Manufacturing Indicators Designs PDF
This slide represents sustainable manufacturing indicators. It covers inputs, operations and products highlighting nee renewable material, recycled material, water intensity etc.Take your projects to the next level with our ultimate collection of Smart Manufacturing Deployment Improve Production Procedures Sustainable Manufacturing Indicators Designs PDF. Slidegeeks has designed a range of layouts that are perfect for representing task or activity duration, keeping track of all your deadlines at a glance. Tailor these designs to your exact needs and give them a truly corporate look with your own brand colors they all make your projects stand out from the rest.
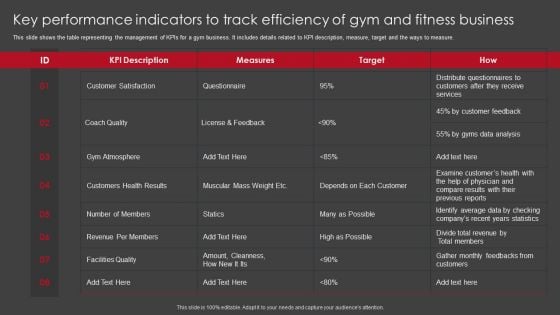
Key Performance Indicators To Track Efficiency Of Gym And Fitness Business Themes PDF
This slide shows the table representing the management of KPIs for a gym business. It includes details related to KPI description, measure, target and the ways to measure. Pitch your topic with ease and precision using this Key Performance Indicators To Track Efficiency Of Gym And Fitness Business Themes PDF. This layout presents information on Key Performance Indicators, Track Efficiency, Gym And Fitness Business. It is also available for immediate download and adjustment. So, changes can be made in the color, design, graphics or any other component to create a unique layout.
Multiple Project Progress Tracking Report Dashboard With Key Performance Indicators Brochure PDF
This slide shows the dashboard representing status of various projects and tracking their performance with the help of key performance indicators which are as follows schedule, budget, resources, risk and issues and quality of projects.Pitch your topic with ease and precision using this Multiple Project Progress Tracking Report Dashboard With Key Performance Indicators Brochure PDF. This layout presents information on Risks Issues, Quality Open Defects, Techno Blogger. It is also available for immediate download and adjustment. So, changes can be made in the color, design, graphics or any other component to create a unique layout.
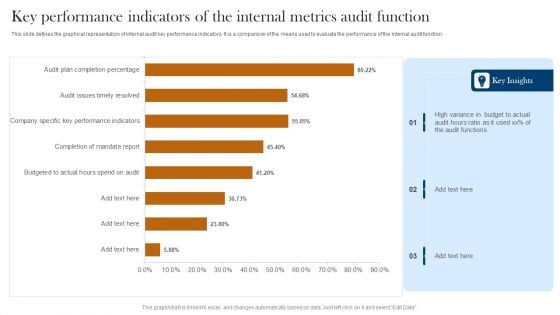
Key Performance Indicators Of The Internal Metrics Audit Function Infographics PDF
This slide defines the graphical representation of internal audit key performance indicators. It is a comparison of the means used to evaluate the performance of the internal audit function. Pitch your topic with ease and precision using this Key Performance Indicators Of The Internal Metrics Audit Function Infographics PDF. This layout presents information on High Variance, Budget To Actual, Audit Functions. It is also available for immediate download and adjustment. So, changes can be made in the color, design, graphics or any other component to create a unique layout.
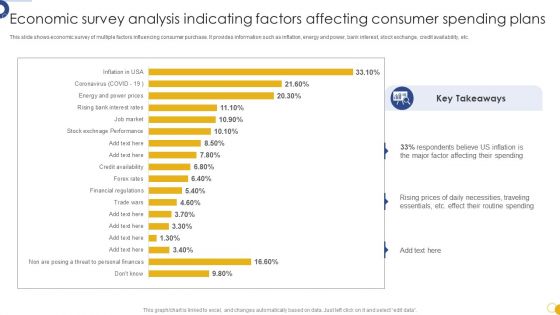
Economic Survey Analysis Indicating Factors Affecting Consumer Spending Plans Download PDF
This slide shows economic survey of multiple factors influencing consumer purchase. It provides information such as inflation, energy and power, bank interest, stock exchange, credit availability, etc. Pitch your topic with ease and precision using this Economic Survey Analysis Indicating Factors Affecting Consumer Spending Plans Download PDF. This layout presents information on Economic Survey Analysis, Indicating Factors Affecting, Consumer Spending Plans. It is also available for immediate download and adjustment. So, changes can be made in the color, design, graphics or any other component to create a unique layout.
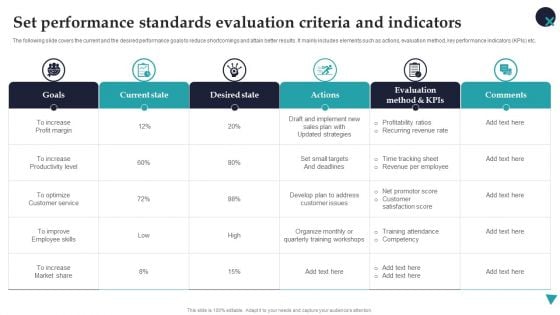
Set Performance Standards Evaluation Criteria And Indicators Employee Performance Management Designs PDF
The following slide covers the current and the desired performance goals to reduce shortcomings and attain better results. It mainly includes elements such as actions, evaluation method, key performance indicators KPIs etc. Take your projects to the next level with our ultimate collection of Set Performance Standards Evaluation Criteria And Indicators Employee Performance Management Designs PDF. Slidegeeks has designed a range of layouts that are perfect for representing task or activity duration, keeping track of all your deadlines at a glance. Tailor these designs to your exact needs and give them a truly corporate look with your own brand colors they all make your projects stand out from the rest.
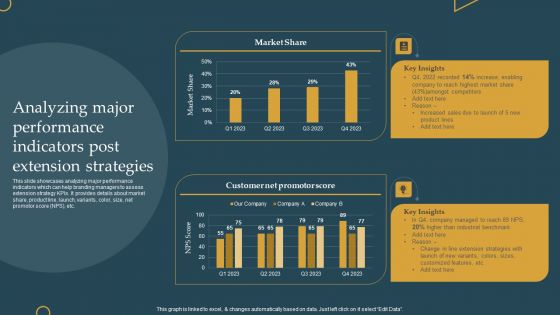
Advertising New Commodities Through Analyzing Major Performance Indicators Post Download PDF
This slide showcases analyzing major performance indicators which can help branding managers to assess extension strategy KPIs. It provides details about market share, product line, launch, variants, color, size, net promotor score NPS, etc. Boost your pitch with our creative Advertising New Commodities Through Analyzing Major Performance Indicators Post Download PDF. Deliver an awe-inspiring pitch that will mesmerize everyone. Using these presentation templates you will surely catch everyones attention. You can browse the ppts collection on our website. We have researchers who are experts at creating the right content for the templates. So you dont have to invest time in any additional work. Just grab the template now and use them.
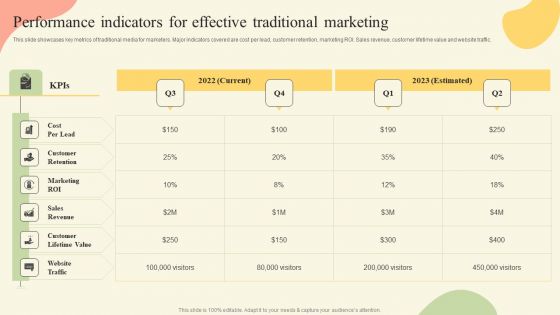
Offline Media Channel Analysis Performance Indicators For Effective Traditional Marketing Elements PDF
This slide showcases key metrics of traditional media for marketers. Major indicators covered are cost per lead, customer retention, marketing ROI. Sales revenue, customer lifetime value and website traffic. Want to ace your presentation in front of a live audience Our Offline Media Channel Analysis Performance Indicators For Effective Traditional Marketing Elements PDF can help you do that by engaging all the users towards you.. Slidegeeks experts have put their efforts and expertise into creating these impeccable powerpoint presentations so that you can communicate your ideas clearly. Moreover, all the templates are customizable, and easy-to-edit and downloadable. Use these for both personal and commercial use.
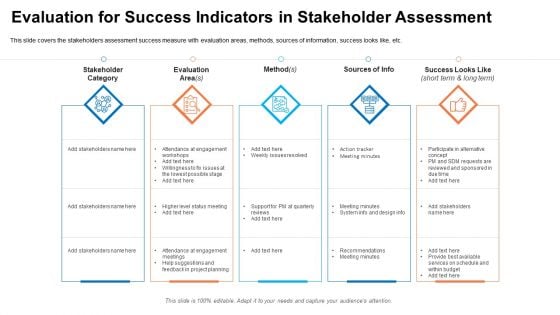
Evaluation For Success Indicators In Stakeholder Assessment Ppt Infographic Template Graphics Pictures PDF
This slide covers the stakeholders assessment success measure with evaluation areas, methods, sources of information, success looks like, etc. This is a evaluation for success indicators in stakeholder assessment ppt infographic template graphics pictures pdf template with various stages. Focus and dispense information on five stages using this creative set, that comes with editable features. It contains large content boxes to add your information on topics like stakeholder category, evaluation area, feedback in project planning. You can also showcase facts, figures, and other relevant content using this PPT layout. Grab it now.

Drug Indicator Extension In A Pharmaceuticals Company Decision Points Classification For SW Care Company Download PDF
This slide shows the decision point highlights of SW Care Company in terms of product selection, market size, market growth, price point, marketing strategy, selling strategy, R and D Research and Development Expenses etc. Deliver and pitch your topic in the best possible manner with this drug indicator extension in a pharmaceuticals company decision points classification for sw care company download pdf. Use them to share invaluable insights on market growth, market size, marketing strategy, manufacturing, price increase and impress your audience. This template can be altered and modified as per your expectations. So, grab it now.
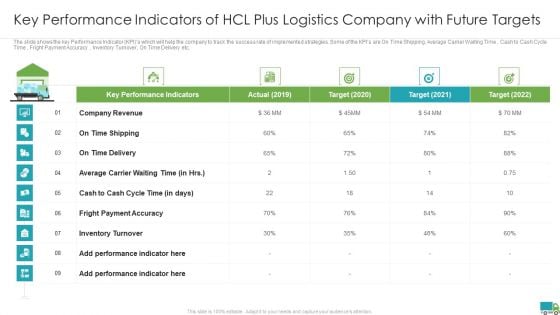
Generating Logistics Value Business Key Performance Indicators Of Hcl Plus Logistics Company With Future Sample PDF
The slide shows the key Performance Indicator KPIs which will help the company to track the success rate of implemented strategies. Some of the KPIs are On Time Shipping, Average Carrier Waiting Time, Cash to Cash Cycle Time, Fright Payment Accuracy, Inventory Turnover, On Time Delivery etc. Deliver and pitch your topic in the best possible manner with this generating logistics value business hcl plus logistics company business details with surplus funds elements pdf. Use them to share invaluable insights on company revenue, fright payment accuracy, inventory turnover and impress your audience. This template can be altered and modified as per your expectations. So, grab it now.
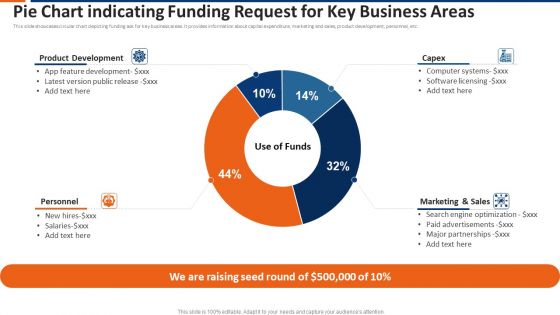
Pie Chart Indicating Funding Request For Key Business Areas Ppt Show Topics PDF
This slide showcases circular chart depicting funding ask for key business areas. It provides information about capital expenditure, marketing and sales, product development, personnel, etc. Pitch your topic with ease and precision using this pie chart indicating funding request for key business areas ppt show topics pdf. This layout presents information on product development, capex, marketing and sales, personnel. It is also available for immediate download and adjustment. So, changes can be made in the color, design, graphics or any other component to create a unique layout.
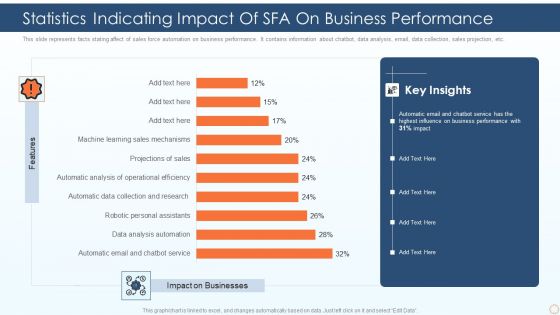
Statistics Indicating Impact Of SFA On Business Performance Ppt PowerPoint Presentation Gallery Outfit PDF
This slide represents facts stating affect of sales force automation on business performance. It contains information about chatbot, data analysis, email, data collection, sales projection, etc. Pitch your topic with ease and precision using this statistics indicating impact of sfa on business performance ppt powerpoint presentation gallery outfit pdf. This layout presents information on automatic email and chatbot service, data analysis automation, robotic personal assistants. It is also available for immediate download and adjustment. So, changes can be made in the color, design, graphics or any other component to create a unique layout.
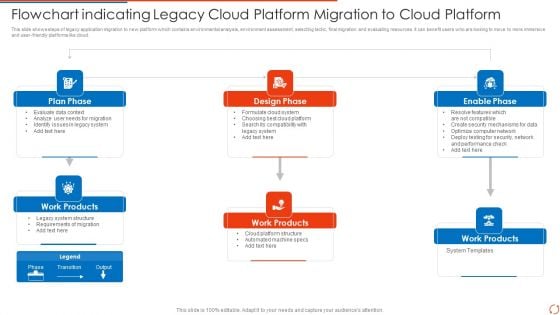
Flowchart Indicating Legacy Cloud Platform Migration To Cloud Platform Sample PDF
This slide shows steps of legacy application migration to new platform which contains environmental analysis, environment assessment, selecting tactic, final migration and evaluating resources. It can benefit users who are looking to move to more immersive and user-friendly platforms like cloud.Presenting Flowchart Indicating Legacy Cloud Platform Migration To Cloud Platform Sample PDF to dispense important information. This template comprises six stages. It also presents valuable insights into the topics including Plan Phase, Design Phase, Work Products. This is a completely customizable PowerPoint theme that can be put to use immediately. So, download it and address the topic impactfully.
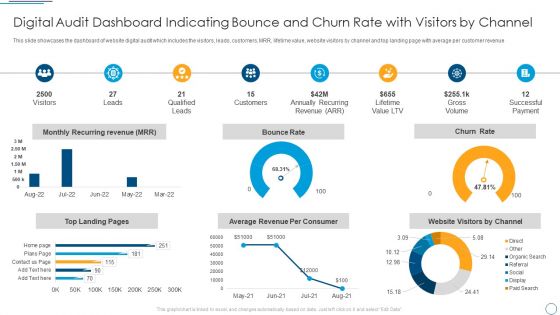
Digital Audit Dashboard Indicating Bounce And Churn Rate With Visitors By Channel Demonstration PDF
This slide showcases the dashboard of website digital audit which includes the visitors, leads, customers, MRR, lifetime value, website visitors by channel and top landing page with average per customer revenue.Deliver and pitch your topic in the best possible manner with this Digital Audit Dashboard Indicating Bounce And Churn Rate With Visitors By Channel Demonstration PDF. Use them to share invaluable insights on Qualified Leads, Annually Recurring, Successful Payment and impress your audience. This template can be altered and modified as per your expectations. So, grab it now.
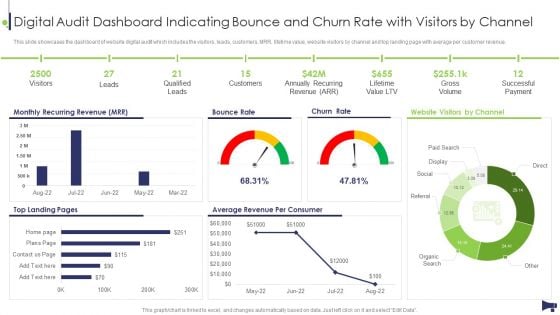
Website And Social Media Digital Audit Dashboard Indicating Bounce And Churn Rate Template PDF
This slide showcases the dashboard of website digital audit which includes the visitors, leads, customers, MRR, lifetime value, website visitors by channel and top landing page with average per customer revenue. Deliver and pitch your topic in the best possible manner with this Website And Social Media Digital Audit Dashboard Indicating Bounce And Churn Rate Template PDF. Use them to share invaluable insights on Monthly Recurring Revenue, Bounce Rate, Churn Rate and impress your audience. This template can be altered and modified as per your expectations. So, grab it now.
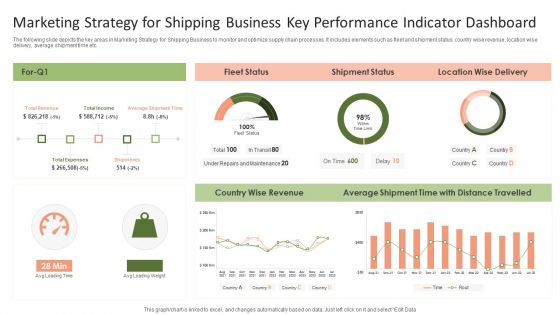
Marketing Strategy For Shipping Business Key Performance Indicator Dashboard Graphics PDF
The following slide depicts the key areas in Marketing Strategy for Shipping Business to monitor and optimize supply chain processes. It includes elements such as fleet and shipment status, country wise revenue, location wise delivery, average shipment time etc.Pitch your topic with ease and precision using this Marketing Strategy For Shipping Business Key Performance Indicator Dashboard Graphics PDF. This layout presents information on Shipment Status, Average Shipment, Wise Revenue. It is also available for immediate download and adjustment. So, changes can be made in the color, design, graphics or any other component to create a unique layout.
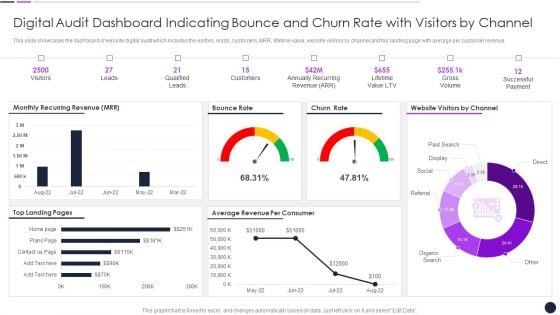
Digital Audit Dashboard Indicating Bounce And Churn Rate With Visitors By Channel Inspiration PDF
This slide showcases the dashboard of website digital audit which includes the visitors, leads, customers, MRR, lifetime value, website visitors by channel and top landing page with average per customer revenue.Deliver and pitch your topic in the best possible manner with this Digital Audit Dashboard Indicating Bounce And Churn Rate With Visitors By Channel Inspiration PDF. Use them to share invaluable insights on Qualified Leads, Annually Recurring, Lifetime Value and impress your audience. This template can be altered and modified as per your expectations. So, grab it now.

Digital Audit Dashboard Indicating Bounce And Churn Rate With Visitors By Channel Information PDF
This slide showcases the dashboard of website digital audit which includes the visitors, leads, customers, MRR, lifetime value, website visitors by channel and top landing page with average per customer revenue. Deliver an awe inspiring pitch with this creative Digital Audit Dashboard Indicating Bounce And Churn Rate With Visitors By Channel Information PDF bundle. Topics like Monthly Recurring Revenue, Bounce Rate, Churn Rate can be discussed with this completely editable template. It is available for immediate download depending on the needs and requirements of the user.
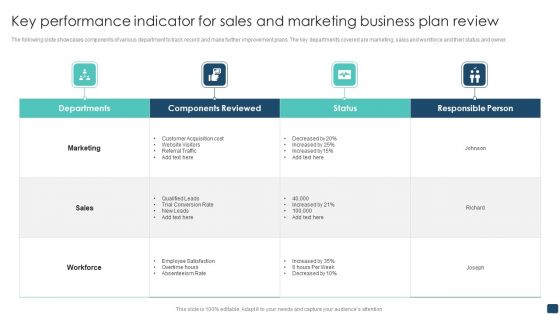
Key Performance Indicator For Sales And Marketing Business Plan Review Brochure PDF
The following slide showcases components of various department to track record and make further improvement plans. The key departments covered are marketing, sales and workforce and their status and owner. Pitch your topic with ease and precision using this Key Performance Indicator For Sales And Marketing Business Plan Review Brochure PDF. This layout presents information on Marketing, Sales, Workforce. It is also available for immediate download and adjustment. So, changes can be made in the color, design, graphics or any other component to create a unique layout.
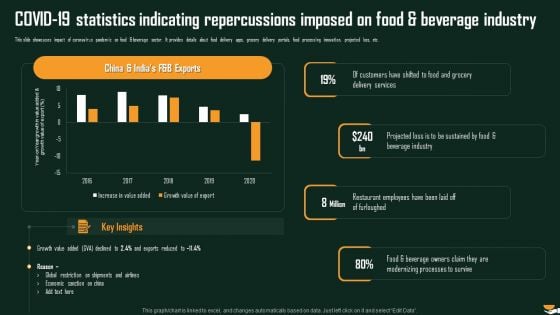
COVID 19 Statistics Indicating Repercussions Imposed On Food And Beverage Industry Demonstration PDF
This slide showcases impact of coronavirus pandemic on food beverage sector. It provides details about food delivery apps, grocery delivery portals, food processing innovation, projected loss, etc. Deliver and pitch your topic in the best possible manner with this COVID 19 Statistics Indicating Repercussions Imposed On Food And Beverage Industry Demonstration PDF. Use them to share invaluable insights on Delivery Services, Beverage Industry, Sustained Food and impress your audience. This template can be altered and modified as per your expectations. So, grab it now.
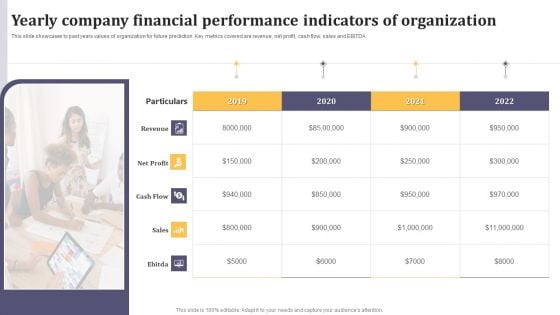
Yearly Company Financial Performance Indicators Of Organization Ppt Infographics Outline PDF
This slide showcases to past years values of organization for future prediction. Key metrics covered are revenue, net profit, cash flow, sales and EBITDA. Persuade your audience using this Yearly Company Financial Performance Indicators Of Organization Ppt Infographics Outline PDF. This PPT design covers five stages, thus making it a great tool to use. It also caters to a variety of topics including Revenue, Net Profit, Cash Flow. Download this PPT design now to present a convincing pitch that not only emphasizes the topic but also showcases your presentation skills.
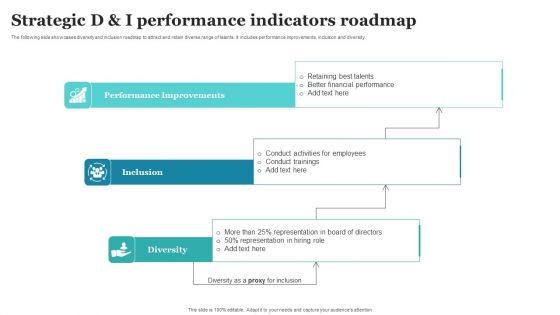
Strategic D And I Performance Indicators Roadmap Ppt PowerPoint Presentation Gallery Clipart PDF
The following slide showcases diversity and inclusion roadmap to attract and retain diverse range of talents. It includes performance improvements, inclusion and diversity. Persuade your audience using this Strategic D And I Performance Indicators Roadmap Ppt PowerPoint Presentation Gallery Clipart PDF. This PPT design covers three stages, thus making it a great tool to use. It also caters to a variety of topics including Performance Improvements, Inclusion, Diversity. Download this PPT design now to present a convincing pitch that not only emphasizes the topic but also showcases your presentation skills.
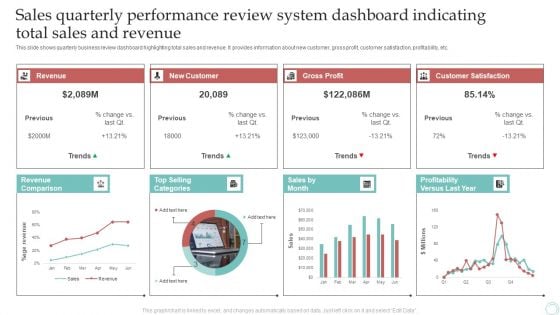
Sales Quarterly Performance Review System Dashboard Indicating Total Sales And Revenue Download PDF
This slide shows quarterly business review dashboard highlighting total sales and revenue. It provides information about new customer, gross profit, customer satisfaction, profitability, etc. Pitch your topic with ease and precision using this Sales Quarterly Performance Review System Dashboard Indicating Total Sales And Revenue Download PDF. This layout presents information on Revenue, New Customer, Gross Profit. It is also available for immediate download and adjustment. So, changes can be made in the color, design, graphics or any other component to create a unique layout.
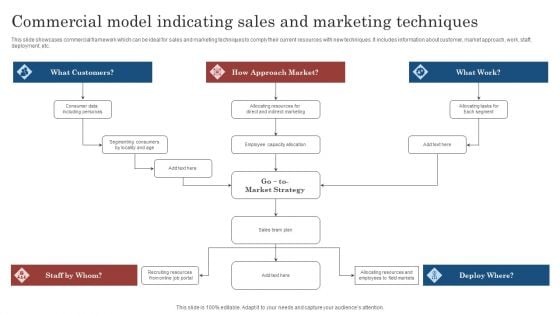
Commercial Model Indicating Sales And Marketing Techniques Ppt File Maker PDF
This slide showcases commercial framework which can be ideal for sales and marketing techniques to comply their current resources with new techniques. It includes information about customer, market approach, work, staff, deployment, etc. Persuade your audience using this Commercial Model Indicating Sales And Marketing Techniques Ppt File Maker PDF. This PPT design covers five stages, thus making it a great tool to use. It also caters to a variety of topics including Customers, Approach Market, Market Strategy . Download this PPT design now to present a convincing pitch that not only emphasizes the topic but also showcases your presentation skills.
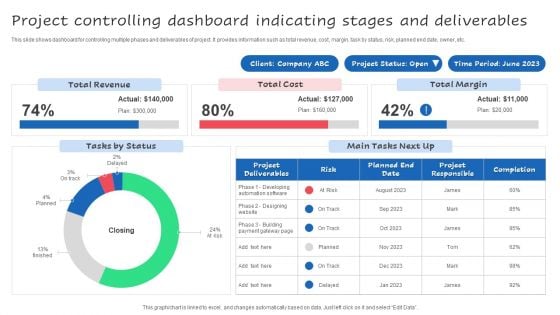
Project Controlling Dashboard Indicating Stages And Deliverables Ppt Styles Guide PDF
This slide shows dashboard for controlling multiple phases and deliverables of project. It provides information such as total revenue, cost, margin, task by status, risk, planned end date, owner, etc. Pitch your topic with ease and precision using this Project Controlling Dashboard Indicating Stages And Deliverables Ppt Styles Guide PDF. This layout presents information on Total Revenue, Total Margin, Total Cost. It is also available for immediate download and adjustment. So, changes can be made in the color, design, graphics or any other component to create a unique layout.

Graph Indicating Clinical Trial Phases Probability Of Success Medical Research Phases For Clinical Tests Graphics PDF
This slide compares and visually presents the success rate of each stage with preceding one of the clinical research procedures to represent the achievement of the drug efficacy objective of the firm. There are so many reasons you need a Graph Indicating Clinical Trial Phases Probability Of Success Medical Research Phases For Clinical Tests Graphics PDF. The first reason is you can not spend time making everything from scratch, Thus, Slidegeeks has made presentation templates for you too. You can easily download these templates from our website easily.
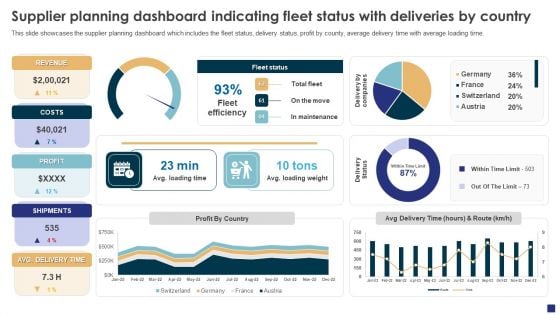
Comprehensive Guide To Ecommerce Supplier Planning Dashboard Indicating Fleet Status Mockup PDF
This slide showcases the supplier planning dashboard which includes the fleet status, delivery status, profit by county, average delivery time with average loading time. Want to ace your presentation in front of a live audience Our Comprehensive Guide To Ecommerce Supplier Planning Dashboard Indicating Fleet Status Mockup PDF can help you do that by engaging all the users towards you.. Slidegeeks experts have put their efforts and expertise into creating these impeccable powerpoint presentations so that you can communicate your ideas clearly. Moreover, all the templates are customizable, and easy-to-edit and downloadable. Use these for both personal and commercial use.
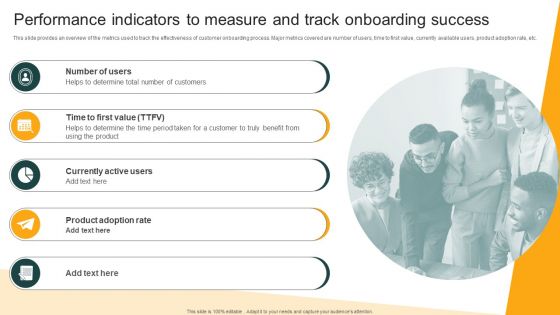
Client Onboarding Plan Performance Indicators To Measure And Track Onboarding Success Ideas PDF
This slide provides an overview of the metrics used to track the effectiveness of customer onboarding process. Major metrics covered are number of users, time to first value, currently available users, product adoption rate, etc. There are so many reasons you need a Client Onboarding Plan Performance Indicators To Measure And Track Onboarding Success Ideas PDF. The first reason is you can not spend time making everything from scratch, Thus, Slidegeeks has made presentation templates for you too. You can easily download these templates from our website easily.
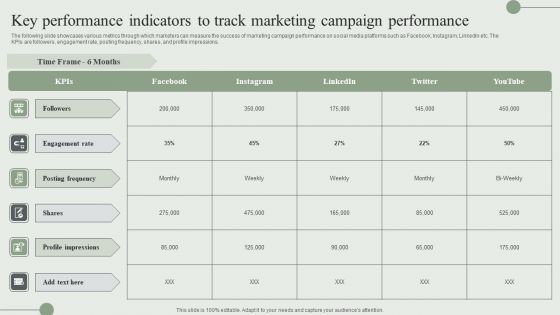
Key Performance Indicators To Track Marketing Campaign Performance Ppt PowerPoint Presentation File Ideas PDF
The following slide showcases various metrics through which marketers can measure the success of marketing campaign performance on social media platforms such as Facebook, Instagram, LinkedIn etc. The KPIs are followers, engagement rate, posting frequency, shares, and profile impressions. There are so many reasons you need a Key Performance Indicators To Track Marketing Campaign Performance Ppt PowerPoint Presentation File Ideas PDF. The first reason is you cannot spend time making everything from scratch, Thus, Slidegeeks has made presentation templates for you too. You can easily download these templates from our website easily.
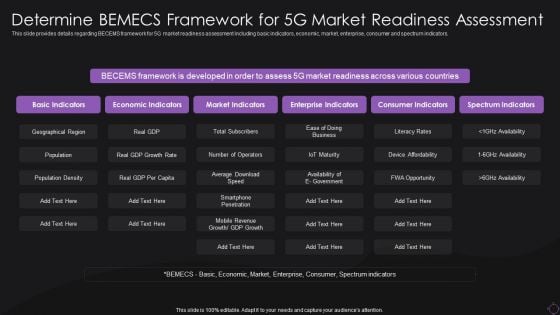
Determine Bemecs Framework For 5G Market Readiness Assessment Summary PDF
This slide provides details regarding BECEMS framework for 5G market readiness assessment including basic indicators, economic, market, enterprise, consumer and spectrum indicators. Deliver an awe inspiring pitch with this creative Determine Bemecs Framework For 5G Market Readiness Assessment Summary PDF bundle. Topics like Geographical Region, Economic Indicators, Enterprise Indicators can be discussed with this completely editable template. It is available for immediate download depending on the needs and requirements of the user.

Data Center Architecture Management Best Practices Introduction PDF
This slide covers data center infrastructure management best practices. It involves gauge resource requirements, adopt consistence system of record, implement monitoring and patch servers. Persuade your audience using this Data Center Architecture Management Best Practices Introduction PDF. This PPT design covers four stages, thus making it a great tool to use. It also caters to a variety of topics including Implement Ongoing Monitoring, Consistence System Of Record, Gauge Resource Requirements. Download this PPT design now to present a convincing pitch that not only emphasizes the topic but also showcases your presentation skills.
Data Centre Architecture Model Management Best Practices Ppt Icon Design Inspiration PDF
This slide covers data centre architecture model management best practices to improve the efficiency of the overall process. It involves gauging resource requirements, adopting a consistent system of record, and implementing monitoring and patching servers. Persuade your audience using this Data Centre Architecture Model Management Best Practices Ppt Icon Design Inspiration PDF. This PPT design covers four stages, thus making it a great tool to use. It also caters to a variety of topics including Gauge Resource Requirements, Consistence System Record, Implement Ongoing Monitoring, Patch Servers. Download this PPT design now to present a convincing pitch that not only emphasizes the topic but also showcases your presentation skills.
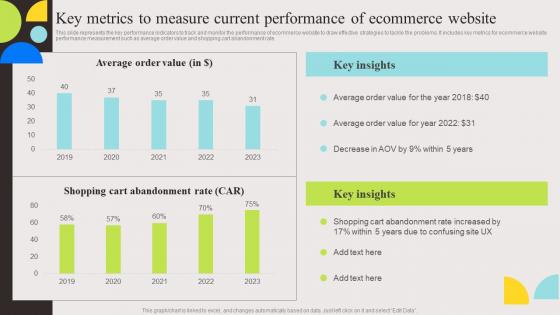
Key Metrics To Measure Current Evaluation And Deployment Of Enhanced Professional Pdf
This slide represents the key performance indicators to track and monitor the performance of ecommerce website to draw effective strategies to tackle the problems. It includes key metrics for ecommerce website performance measurement such as average order value and shopping cart abandonment rate. Are you searching for a Key Metrics To Measure Current Evaluation And Deployment Of Enhanced Professional Pdf that is uncluttered, straightforward, and original It is easy to edit, and you can change the colors to suit your personal or business branding. For a presentation that expresses how much effort you have put in, this template is ideal With all of its features, including tables, diagrams, statistics, and lists, it is perfect for a business plan presentation. Make your ideas more appealing with these professional slides. Download Key Metrics To Measure Current Evaluation And Deployment Of Enhanced Professional Pdf from Slidegeeks today. This slide represents the key performance indicators to track and monitor the performance of ecommerce website to draw effective strategies to tackle the problems. It includes key metrics for ecommerce website performance measurement such as average order value and shopping cart abandonment rate.
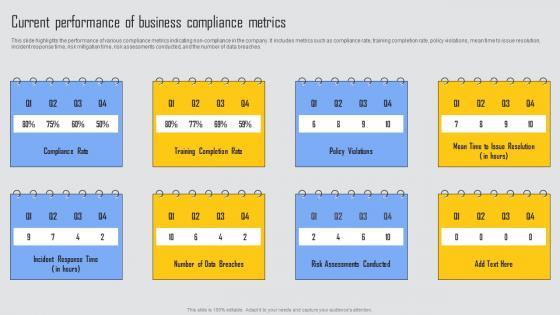
Current Performance Business Managing Risks And Establishing Trust Through Efficient Demonstration Pdf
This slide highlights the performance of various compliance metrics indicating non compliance in the company. It includes metrics such as compliance rate, training completion rate, policy violations, mean time to issue resolution, incident response time, risk mitigation time, risk assessments conducted, and the number of data breaches. Are you searching for a Current Performance Business Managing Risks And Establishing Trust Through Efficient Demonstration Pdf that is uncluttered, straightforward, and original Its easy to edit, and you can change the colors to suit your personal or business branding. For a presentation that expresses how much effort you have put in, this template is ideal With all of its features, including tables, diagrams, statistics, and lists, its perfect for a business plan presentation. Make your ideas more appealing with these professional slides. Download Current Performance Business Managing Risks And Establishing Trust Through Efficient Demonstration Pdf from Slidegeeks today. This slide highlights the performance of various compliance metrics indicating non compliance in the company. It includes metrics such as compliance rate, training completion rate, policy violations, mean time to issue resolution, incident response time, risk mitigation time, risk assessments conducted, and the number of data breaches.

Linkedin Content Strategies Tactical Content Marketing Plan On Linkedin MKT SS V
This slide covers plan to post content on LinkedIn platform. The purpose of this template is to provide an overview on content to be shared, goals, performance indications, action items for pages, LinkedIn slideshare ,groups sponsored updates and direct sponsored content. Present like a pro with Linkedin Content Strategies Tactical Content Marketing Plan On Linkedin MKT SS V. Create beautiful presentations together with your team, using our easy-to-use presentation slides. Share your ideas in real-time and make changes on the fly by downloading our templates. So whether you are in the office, on the go, or in a remote location, you can stay in sync with your team and present your ideas with confidence. With Slidegeeks presentation got a whole lot easier. Grab these presentations today. This slide covers plan to post content on LinkedIn platform. The purpose of this template is to provide an overview on content to be shared, goals, performance indications, action items for pages, LinkedIn slideshare ,groups sponsored updates and direct sponsored content.
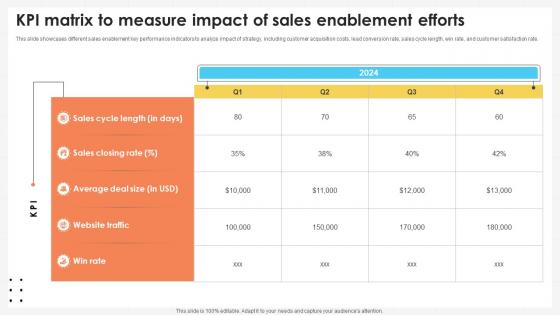
Business Development Team Kpi Matrix To Measure Impact Of Sales Enablement Efforts SA SS V
This slide showcases different sales enablement key performance indicators to analyze impact of strategy, including customer acquisition costs, lead conversion rate, sales cycle length, win rate, and customer satisfaction rate. Are you searching for a Business Development Team Kpi Matrix To Measure Impact Of Sales Enablement Efforts SA SS V that is uncluttered, straightforward, and original Its easy to edit, and you can change the colors to suit your personal or business branding. For a presentation that expresses how much effort you have put in, this template is ideal With all of its features, including tables, diagrams, statistics, and lists, its perfect for a business plan presentation. Make your ideas more appealing with these professional slides. Download Business Development Team Kpi Matrix To Measure Impact Of Sales Enablement Efforts SA SS V from Slidegeeks today. This slide showcases different sales enablement key performance indicators to analyze impact of strategy, including customer acquisition costs, lead conversion rate, sales cycle length, win rate, and customer satisfaction rate.

Phases Of Smart Grid Maturity Model Navigation Smart Grid Working
This slide represents the phases of smart grid maturity model navigation and includes preparation, survey workshop, analysis, aspirations workshop and wrap up. The findings of the compass poll will indicate the utilitys AS IS condition in each of the eight domains. Are you searching for a Phases Of Smart Grid Maturity Model Navigation Smart Grid Working that is uncluttered, straightforward, and original Its easy to edit, and you can change the colors to suit your personal or business branding. For a presentation that expresses how much effort you have put in, this template is ideal With all of its features, including tables, diagrams, statistics, and lists, its perfect for a business plan presentation. Make your ideas more appealing with these professional slides. Download Phases Of Smart Grid Maturity Model Navigation Smart Grid Working from Slidegeeks today. This slide represents the phases of smart grid maturity model navigation and includes preparation, survey workshop, analysis, aspirations workshop and wrap up. The findings of the compass poll will indicate the utilitys AS IS condition in each of the eight domains.
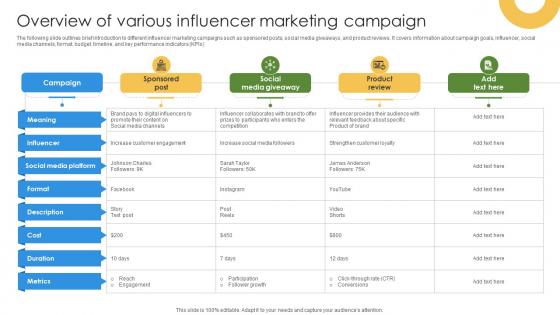
Marketing Growth Strategy To Overview Of Various Influencer Marketing Campaign Strategy SS V
The following slide outlines brief introduction to different influencer marketing campaigns such as sponsored posts, social media giveaways, and product reviews. It covers information about campaign goals, influencer, social media channels, format, budget, timeline, and key performance indicators KPIs. Present like a pro with Marketing Growth Strategy To Overview Of Various Influencer Marketing Campaign Strategy SS V. Create beautiful presentations together with your team, using our easy-to-use presentation slides. Share your ideas in real-time and make changes on the fly by downloading our templates. So whether you are in the office, on the go, or in a remote location, you can stay in sync with your team and present your ideas with confidence. With Slidegeeks presentation got a whole lot easier. Grab these presentations today. The following slide outlines brief introduction to different influencer marketing campaigns such as sponsored posts, social media giveaways, and product reviews. It covers information about campaign goals, influencer, social media channels, format, budget, timeline, and key performance indicators KPIs.
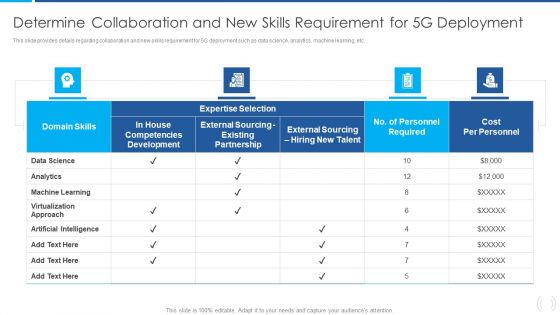
Proactive Method For 5G Deployment By Telecom Companies Determine Collaboration And New Skills Professional PDF
This slide provides details regarding collaboration and new skills requirement for 5G deployment such as data science, analytics, machine learning, etc. Deliver an awe inspiring pitch with this creative Proactive Method For 5G Deployment By Telecom Companies Determine Collaboration And New Skills Professional PDF bundle. Topics like Basic Indicators, Economic Indicators, Market Indicators can be discussed with this completely editable template. It is available for immediate download depending on the needs and requirements of the user.
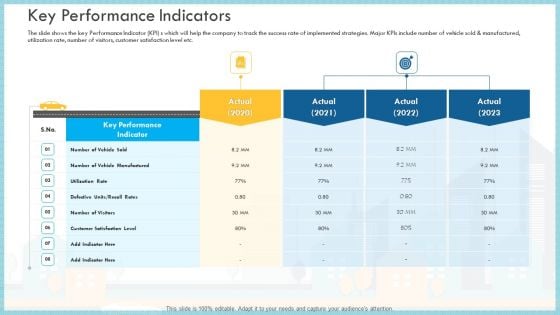
Loss Of Income And Financials Decline In An Automobile Organization Case Study Key Performance Indicators Brochure PDF
The slide shows the key Performance Indicator KPI s which will help the company to track the success rate of implemented strategies. Major KPIs include number of vehicle sold and manufactured, utilization rate, number of visitors, customer satisfaction level etc.Deliver an awe inspiring pitch with this creative loss of income and financials decline in an automobile organization case study key performance indicators brochure pdf bundle. Topics like key performance indicator, utilization rate, customer satisfaction level can be discussed with this completely editable template. It is available for immediate download depending on the needs and requirements of the user
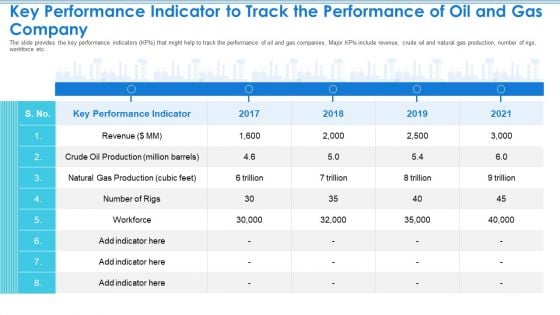
Case Competition Petroleum Sector Issues Key Performance Indicator To Track The Performance Of Oil And Gas Company Diagrams PDF
The slide provides the key performance indicators KPIs that might help to track the performance of oil and gas companies. Major KPIs include revenue, crude oil and natural gas production, number of rigs, workforce etc. Deliver and pitch your topic in the best possible manner with this case competition petroleum sector issues key performance indicator to track the performance of oil and gas company diagrams pdf. Use them to share invaluable insights on key performance indicator, revenue, 2017 to 2021 and impress your audience. This template can be altered and modified as per your expectations. So, grab it now.
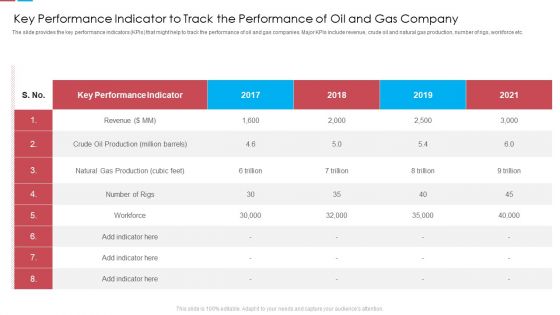
Key Performance Indicator To Track The Performance Of Oil And Gas Company Ppt Ideas Graphics Design PDF
The slide provides the key performance indicators KPIs that might help to track the performance of oil and gas companies. Major KPIs include revenue, crude oil and natural gas production, number of rigs, workforce etc. Deliver an awe inspiring pitch with this creative key performance indicator to track the performance of oil and gas company ppt ideas graphics design pdf bundle. Topics like key performance indicator to track the performance of oil and gas company can be discussed with this completely editable template. It is available for immediate download depending on the needs and requirements of the user.


 Continue with Email

 Home
Home


