Meter Slides
Robotic Process Automation RPA For Digital Transformation Journey PPT Slide DT SS V
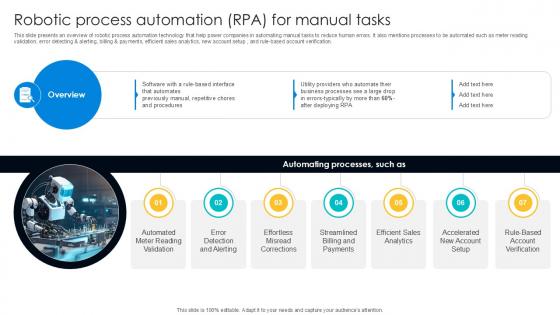
This slide presents an overview of robotic process automation technology that help power companies in automating manual tasks to reduce human errors. It also mentions processes to be automated such as meter reading validation, error detecting and alerting, billing and payments, efficient sales analytics, new account setup , and rule-based account verification. Retrieve professionally designed Rule-Based Account Verification, Accelerated New Account Setup, Efficient Sales Analytics to effectively convey your message and captivate your listeners. Save time by selecting pre-made slideshows that are appropriate for various topics, from business to educational purposes. These themes come in many different styles, from creative to corporate, and all of them are easily adjustable and can be edited quickly. Access them as PowerPoint templates or as Google Slides themes. You do not have to go on a hunt for the perfect presentation because Slidegeeks got you covered from everywhere. This slide presents an overview of robotic process automation technology that help power companies in automating manual tasks to reduce human errors. It also mentions processes to be automated such as meter reading validation, error detecting and alerting, billing and payments, efficient sales analytics, new account setup , and rule-based account verification.

Customer Service Team Review Dashboard Powerpoint Slide Rules
This is a customer service team review dashboard powerpoint slide rules. This is a four stage process. The stages in this process are dashboard, meter, financials, speed, measure.
Balanced Scorecard Leading And Lagging Indicators Powerpoint Slide
This is a balanced scorecard leading and lagging indicators powerpoint slide. This is a four stage process. The stages in this process are dashboard, business, marketing, technology, meter.
Framework Indicating Corporate Sustainability Innovation Ppt Slide SS
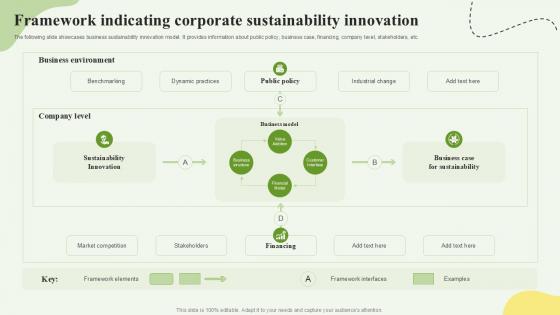
The following slide showcases strategic account action plan on quarter basis for breaking annual planning in small parts and achieve goals effectively. It involves account objectives and strategies to review the outcomes of last quarter and improve it. Crafting an eye-catching presentation has never been more straightforward. Let your presentation shine with this tasteful yet straightforward Framework Indicating Corporate Sustainability Innovation Ppt Slide SS template. It offers a minimalistic and classy look that is great for making a statement. The colors have been employed intelligently to add a bit of playfulness while still remaining professional. Construct the ideal Framework Indicating Corporate Sustainability Innovation Ppt Slide SS that effortlessly grabs the attention of your audience Begin now and be certain to wow your customers The following slide showcases strategic account action plan on quarter basis for breaking annual planning in small parts and achieve goals effectively. It involves account objectives and strategies to review the outcomes of last quarter and improve it.
Key Success Indicators Dashboard Ppt PowerPoint Presentation Infographics Slide Portrait
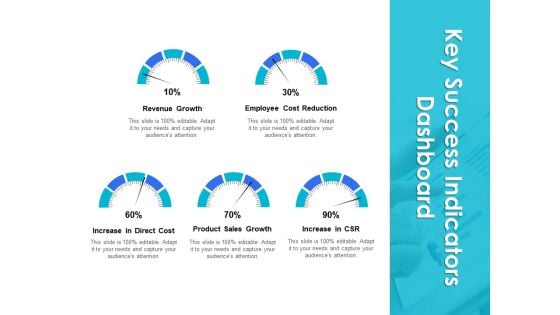
Presenting this set of slides with name key success indicators dashboard ppt powerpoint presentation infographics slide portrait. The topics discussed in these slides are revenue growth, employee cost reduction, increase in direct cost, product sales growth, increase in csr. This is a completely editable PowerPoint presentation and is available for immediate download. Download now and impress your audience.
Key Measures For Judging Success Powerpoint Slide Ideas
This is a key measures for judging success powerpoint slide ideas. This is a eight stage process. The stages in this process are marketing, management, strategy, success, business.
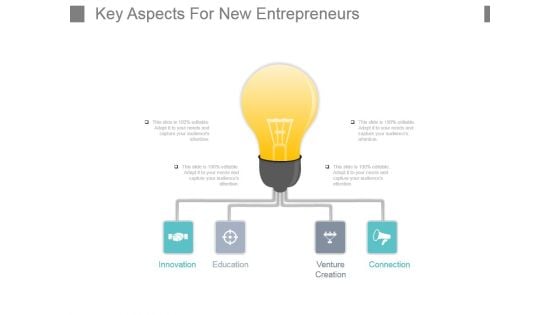
Key Aspects For New Entrepreneurs Powerpoint Slide Ideas
This is a key aspects for new entrepreneurs powerpoint slide ideas. This is a four stage process. The stages in this process are innovation, education, venture creation, connection.
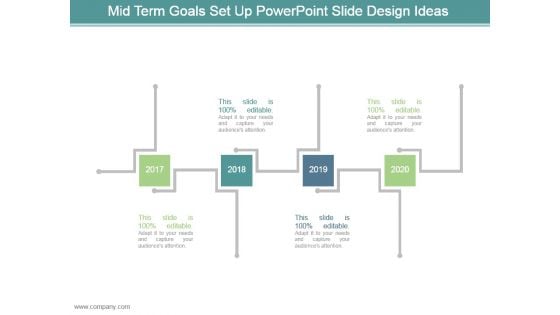
Mid Term Goals Set Up Powerpoint Slide Design Ideas
This is a mid term goals set up powerpoint slide design ideas. This is a four stage process. The stages in this process are arrows, business, marketing, planning, years.
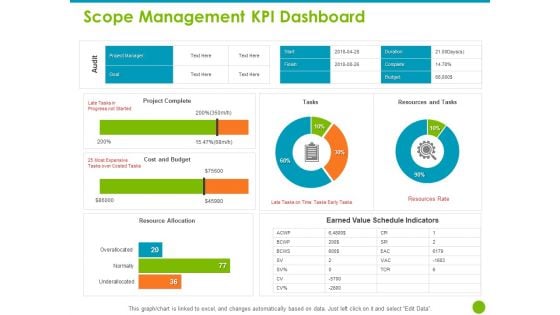
Project Capabilities Scope Management KPI Dashboard Ppt Slide Download PDF
Presenting this set of slides with name project capabilities scope management kpi dashboard ppt slide download pdf. The topics discussed in these slides are project complete, cost and budget, resource allocation, earned value schedule indicators, resources and tasks. This is a completely editable PowerPoint presentation and is available for immediate download. Download now and impress your audience.
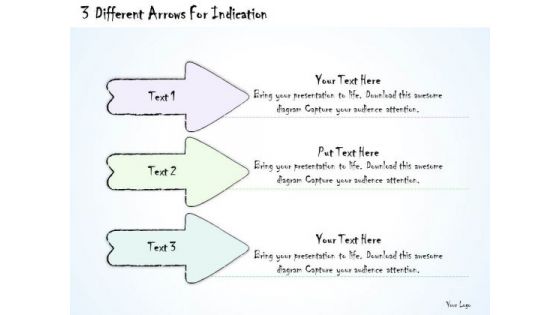
Ppt Slide 3 Different Arrows For Indication Consulting Firms
Get Out Of The Dock With Our PPT Slide 3 different arrows for indication consulting firms Powerpoint Templates. Your Mind Will Be Set Free.
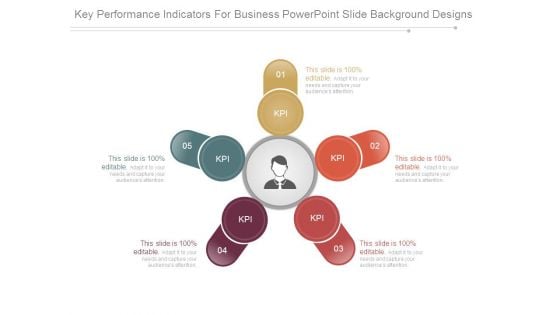
Key Performance Indicators For Business Powerpoint Slide Background Designs
This is a key performance indicators for business powerpoint slide background designs. This is a five stage process. The stages in this process are kpi.
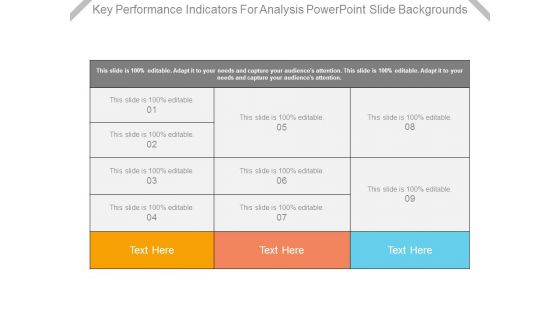
Key Performance Indicators For Analysis Powerpoint Slide Backgrounds
This is a key performance indicators for analysis powerpoint slide backgrounds. This is a nine stage process. The stages in this process are business, marketing, management.
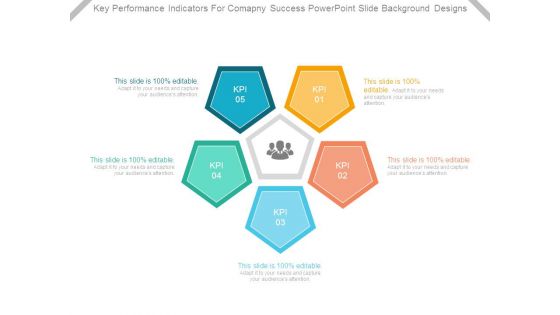
Key Performance Indicators For Company Success Powerpoint Slide Background Designs
This is a key performance indicators for company success powerpoint slide background designs. This is a five stage process. The stages in this process are kpi.
Financial Key Performance Indicators Table Powerpoint Slide Deck
This is a financial key performance indicators table powerpoint slide deck. This is a six stage process. The stages in this process are business, strategy, marketing, success, table.
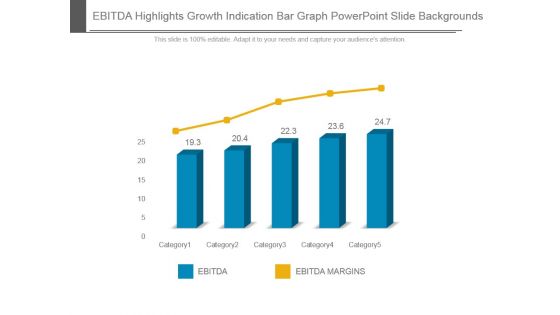
Ebitda Highlights Growth Indication Bar Graph Powerpoint Slide Backgrounds
This is a ebitda highlights growth indication bar graph powerpoint slide backgrounds. This is a five stage process. The stages in this process are ebitda, ebitda margins, category.
Customer Service Performance Indicators Ppt Powerpoint Presentation Ideas Slide Cpb
This is a customer service performance indicators ppt powerpoint presentation ideas slide cpb. This is a five stage process. The stages in this process are customer service performance indicators.
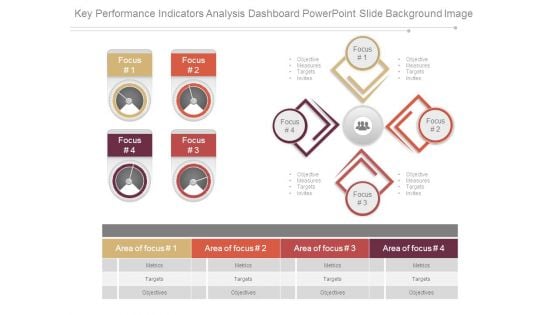
Key Performance Indicators Analysis Dashboard Powerpoint Slide Background Image
This is a key performance indicators analysis dashboard powerpoint slide background image. This is a four stage process. The stages in this process are focus, objective measures targets invites, area of focus, metrics, targets, objectives.
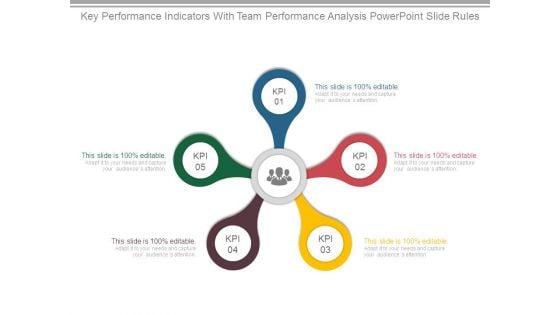
Key Performance Indicators With Team Performance Analysis Powerpoint Slide Rules
This is a key performance indicators with team performance analysis powerpoint slide rules. This is a five stage process. The stages in this process are business, strategy, marketing, success, process, icons.

Key Performance Indicators For Area Of Focus Powerpoint Slide Backgrounds
This is a key performance indicators for area of focus powerpoint slide backgrounds. This is a four stage process. The stages in this process are area of focus, metrics, targets, objectives, focus, measures, invites, vision and strategy.
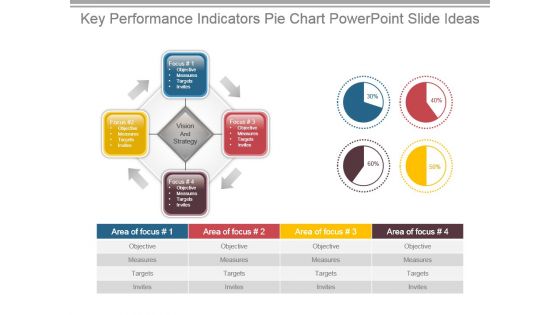
Key Performance Indicators Pie Chart Powerpoint Slide Ideas
This is a key performance indicators pie chart powerpoint slide ideas. This is a four stage process. The stages in this process are focus, objectives, measures, targets, invites, vision and strategy, area of focus.
6 Point Goal For Company Management Ppt PowerPoint Presentation Slide
This is a 6 point goal for company management ppt powerpoint presentation slide. This is a six stage process. The stages in this process are agenda, business, strategy, icons, hexagon, marketing.
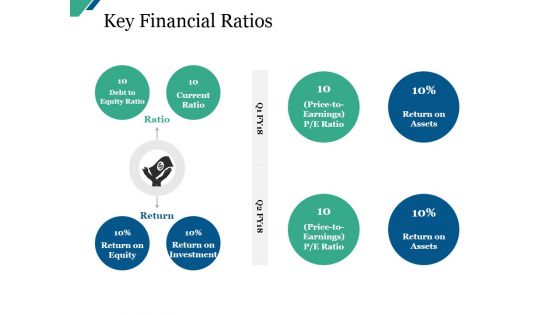
Key Financial Ratios Ppt PowerPoint Presentation Infographic Template Master Slide
This is a key financial ratios ppt powerpoint presentation infographic template master slide. This is a eight stage process. The stages in this process are debt to equity ratio, current ratio, return on equity, return on investment.
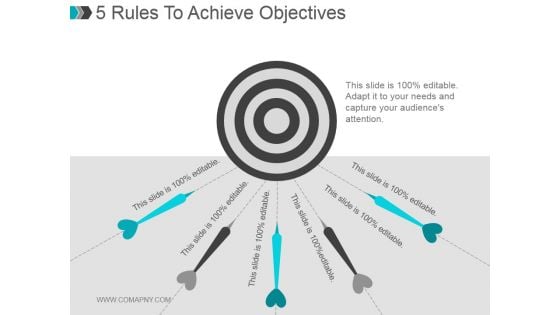
5 Rules To Achieve Objectives Ppt PowerPoint Presentation Slide
This is a 5 rules to achieve objectives ppt powerpoint presentation slide. This is a one stage process. The stages in this process are business, arrows, target, strategy, success.
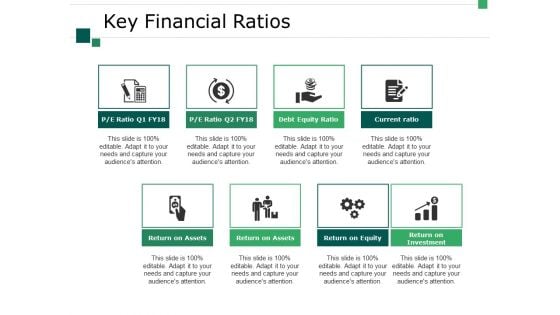
Key Financial Ratios Ppt PowerPoint Presentation Outline Slide
This is a key financial ratios ppt powerpoint presentation outline slide. This is a eight stage process. The stages in this process are return on assets, return on equity, return on investment, current ratio, debt equity ratio.
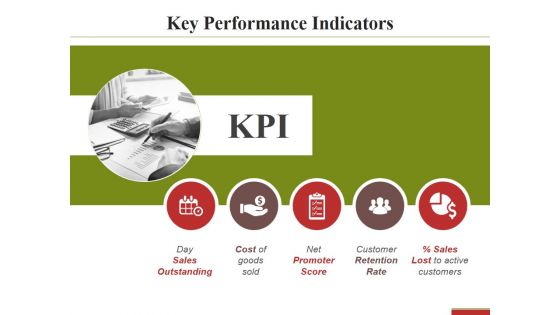
Key Performance Indicators Template 2 Ppt PowerPoint Presentation Pictures Slide
This is a key performance indicators template 2 ppt powerpoint presentation pictures slide. This is a five stage process. The stages in this process are day sales outstanding, cost of goods sold, net promoter score.
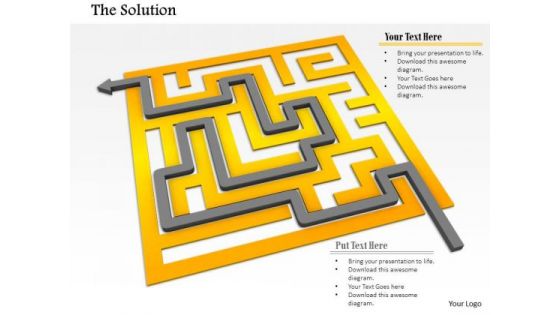
Stock Photo Arrow Indicating Solution Path Of Maze Pwerpoint Slide
This conceptual image is designed with graphic of maze and arrow. In this image maze shows the concept of problem while arrow is reflecting the idea of solution. Build a innovative presentation for displaying the complexity of problem solving topic. Use this image for business, sales and marketing related presentations.
Strategies To Conduct Business Smoothly Ppt Slide Examples
Plot Strategic Model Ppt Diagram Powerpoint Slide Deck Samples
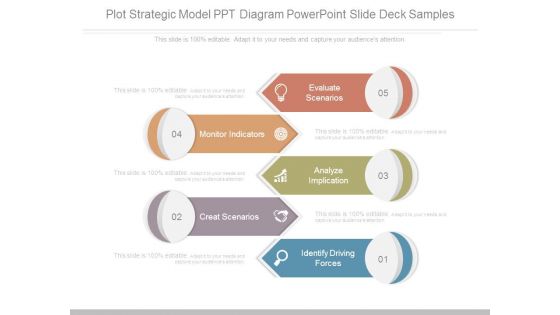
This is a plot strategic model ppt diagram powerpoint slide deck samples. This is a five stage process. The stages in this process are evaluate scenarios, monitor indicators, analyze implication, create scenarios, identify driving forces.
Reverse SCM Reverse Logistics Management Ppt Slide PDF
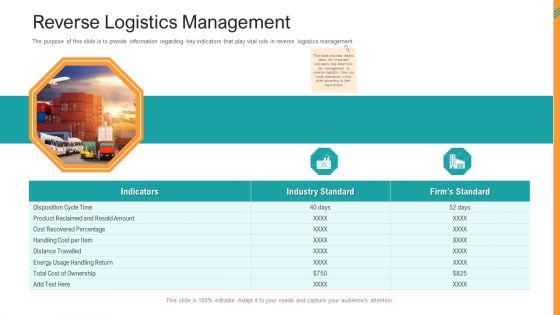
The purpose of this slide is to provide information regarding key indicators that play vital role in reverse logistics management. Deliver an awe-inspiring pitch with this creative reverse scm reverse logistics management ppt slide pdf bundle. Topics like reverse logistics management can be discussed with this completely editable template. It is available for immediate download depending on the needs and requirements of the user.
PowerPoint Template Chart Circular Arrow Ppt Slide Designs
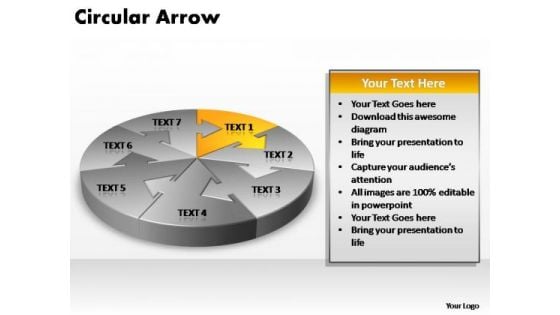
PowerPoint Template Chart Circular Arrow PPT Slide Designs-The arrows indicate the progression of the process. Constant monitoring of the processes provides you with opportunities to concentrate on the core competencies in your business and improve the standards for more effective results.-PowerPoint Template Chart Circular Arrow PPT Slide Designs Our PowerPoint Template Chart Circular Arrow Ppt Slide Designs will be a feather in your cap. They will add to your enduring charm.

PowerPoint Slide Designs Leadership Arrows In Circle Ppt Design
PowerPoint Slide Designs Leadership Arrows In Circle PPT Design-The arrows indicate the progression of the process. Constant monitoring of the processes provides you with opportunities to concentrate on the core competencies in your business and improve the standards for more effective results.-PowerPoint Slide Designs Leadership Arrows In Circle PPT Design Embarrass your brother with our PowerPoint Slide Designs Leadership Arrows In Circle Ppt Design. Just download, type and present.
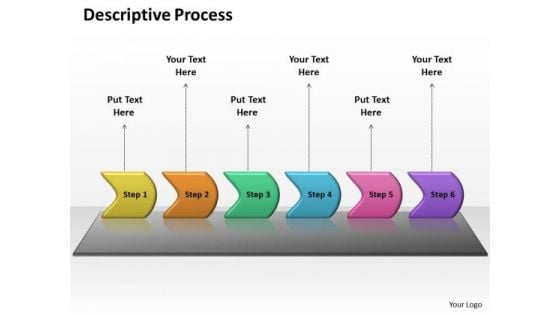
Ppt Six PowerPoint Slide Numbers Linear Process Templates
PPT six powerpoint slide numbers linear process Templates-This Linear Process diagram provides a visual representation of the steps in a business process-PPT six powerpoint slide numbers linear process Templates-Aim, Arrow, Arrowheads, Badge, Border, Click, Connection, Curve, Design, Direction, Download, Element, Fuchsia, Icon, Illustration, Indicator, Internet, Magenta, Mark, Object, Orientation, Pointer, Shadow, Shape, Sign Acquire the fame you deserve. Our Ppt Six PowerPoint Slide Numbers Linear Process Templates will aid you to achieve acclaim.
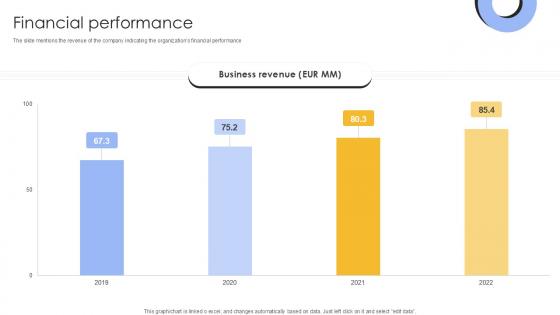
Financial Performance Investment Company Investor Funding Elevator Ppt Slide
The slide mentions the revenue of the company indicating the organizations financial performance. Find a pre-designed and impeccable Financial Performance Investment Company Investor Funding Elevator Ppt Slide. The templates can ace your presentation without additional effort. You can download these easy-to-edit presentation templates to make your presentation stand out from others. So, what are you waiting for Download the template from Slidegeeks today and give a unique touch to your presentation. The slide mentions the revenue of the company indicating the organizations financial performance
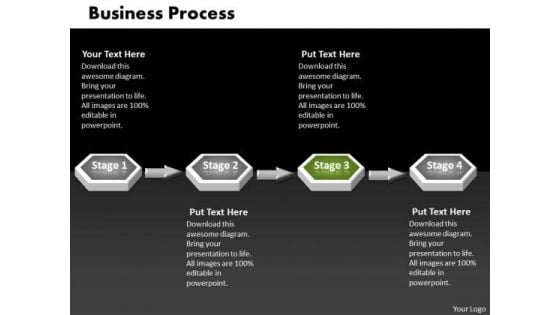
Ppt Green PowerPoint Slide Stage 3d Sequential Linear Process Templates
PPT green powerpoint slide stage 3d sequential linear process Templates-This Business PowerPoint Diagram shows 3d linear abstraction to represent Business related issues. It uses four stages. It indicates employment, field, function, game, line, and livelihood. It is helpful to organize information. -PPT green powerpoint slide stage 3d sequential linear process Templates-arrow, art, basic, blank, business, capital, chart, chevron, clip, clipart, colorful, conglomerates, consumer, copy, cyclical, energy, financial, flow, goods, graph, graphic, healthcare, illustration, infographic, information, investment, isolated, market, materials, non, round, sectors, services, slide, space, stock, technology, text, Make a fancy impression with our Ppt Green PowerPoint Slide Stage 3d Sequential Linear Process Templates. You will be at the top of your game.
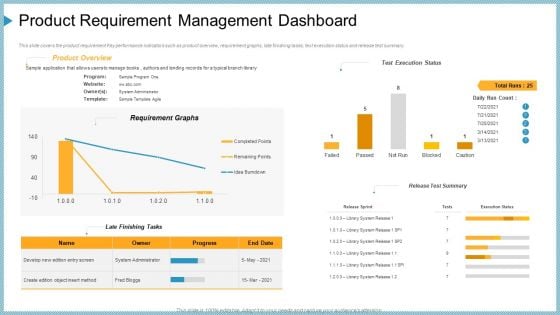
Product Requirement Management Dashboard Ppt File Slide PDF
This slide covers the product requirement Key performance indicators such as product overview, requirement graphs, late finishing tasks, text execution status and release test summary. Deliver an awe-inspiring pitch with this creative product requirement management dashboard ppt file slide pdf bundle. Topics like product requirement management dashboard can be discussed with this completely editable template. It is available for immediate download depending on the needs and requirements of the user.
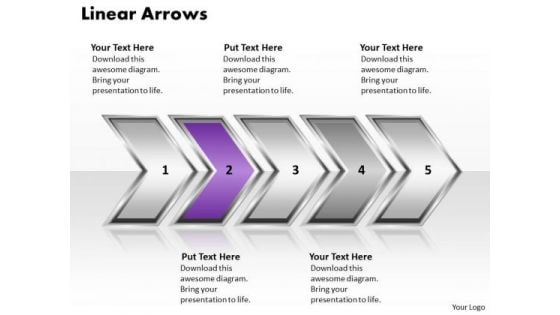
Ppt Linear Demonstration Of Arrows Diagram PowerPoint Slide Text Templates
PPT linear demonstration of arrows diagram powerpoint slide text Templates-This disarm can be used to organize information so that it can be accessed more easily. Pin-point the manner and processes for your team to follow an order. Step by step develop the entire picture and project it onto their minds-PPT linear demonstration of arrows diagram powerpoint slide text Templates-Aim, Arrow, Arrowheads, Badge, Border, Click, Connection, Curve, Design, Direction, Download, Element, Fuchsia, Icon, Illustration, Indicator, Internet, Magenta, Mark, Object, Orientation, Pointer, Shadow, Shape, Sign Search everywhere but find it here. Our Ppt Linear Demonstration Of Arrows Diagram PowerPoint Slide Text Templates catalogue will have it right there.
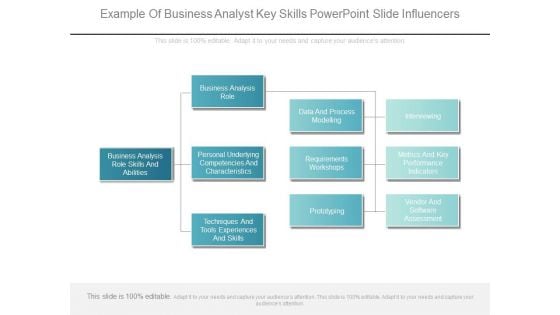
Example Of Business Analyst Key Skills Powerpoint Slide Influencers
This is a example of business analyst key skills powerpoint slide influencers. This is a three stage process. The stages in this process are business analysis role skills and abilities, business analysis role, personal underlying competencies and characteristics, techniques and tools experiences and skills, data and process modelling, requirements workshops, prototyping, interviewing, metrics and key performance indicators, vendor and software assessment.

Signature For Sports Tournament Championship Proposal Ppt Slide PDF
Deliver an awe-inspiring pitch with this creative signature for sports tournament championship proposal ppt slide pdf bundle. Topics like indicate, intention, project can be discussed with this completely editable template. It is available for immediate download depending on the needs and requirements of the user.
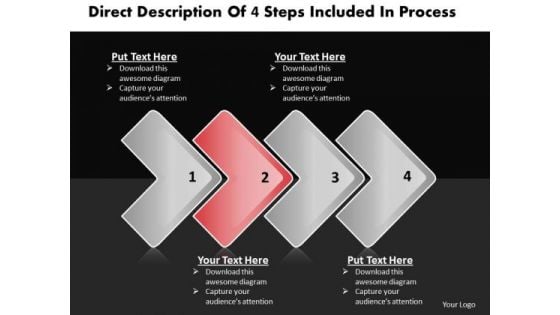
Ppt Horizontal PowerPoint Slide Numbers Included Process 3 Business Templates
PPT horizontal powerpoint slide numbers included process 3 Business Templates-This diagram provides a graphical view of different aspects of a business plan and the relationships between them. Use this circular PPT abstraction to establish a link between your personal methodology and action research possibilities. The ideas and plans are on your fingertips. Now imprint them on the minds of your audience via our slides.-PPT horizontal powerpoint slide numbers included process 3 Business Templates-Aim, Arrow, Arrowheads, Badge, Border, Click, Connection, Curve, Design, Direction, Download, Element, Fuchsia, Icon, Illustration, Indicator, Internet, Magenta, Mark, Object, Orientation, Pointer, Shadow, Shape, Sign Keep your thoughts evergreen with our Ppt Horizontal PowerPoint Slide Numbers Included Process 3 Business Templates. They will stay fresh and relevant for long.
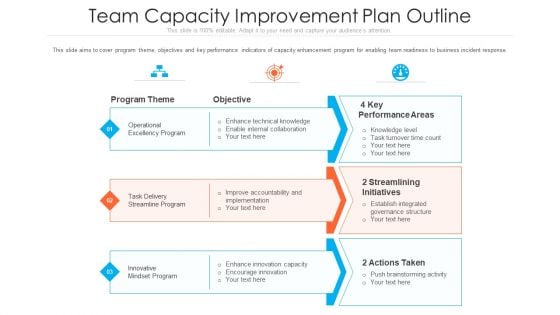
Team Capacity Improvement Plan Outline Ppt Styles Slide PDF
This slide aims to cover program theme, objectives and key performance indicators of capacity enhancement program for enabling team readiness to business incident response. Presenting team capacity improvement plan outline ppt styles slide pdf to provide visual cues and insights. Share and navigate important information on three stages that need your due attention. This template can be used to pitch topics like performance areas, innovative, implementation. In addtion, this PPT design contains high resolution images, graphics, etc, that are easily editable and available for immediate download.

Percent Change In Workplace Productivity Ppt Summary Slide Portrait
Following slide illustrates informational stats about percent change in workplace productivity. Here the graph indicates that workplace productivity gets decreased by 1.6 percent in 2022 as compared to 2023 stats. Formulating a presentation can take up a lot of effort and time, so the content and message should always be the primary focus. The visuals of the PowerPoint can enhance the presenters message, so our Percent Change In Workplace Productivity Ppt Summary Slide Portrait was created to help save time. Instead of worrying about the design, the presenter can concentrate on the message while our designers work on creating the ideal templates for whatever situation is needed. Slidegeeks has experts for everything from amazing designs to valuable content, we have put everything into Percent Change In Workplace Productivity Ppt Summary Slide Portrait.
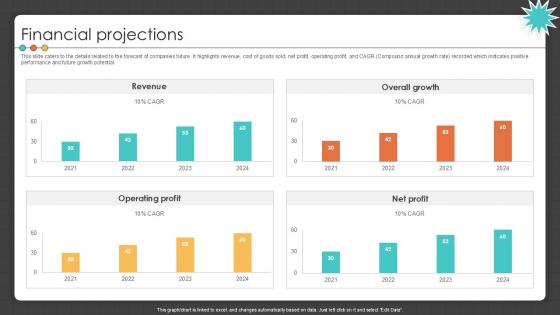
Financial Projections Manufacturing Control Software Company Investor PPT Slide
This slide caters to the details related to the forecast of companies future. It highlights revenue, cost of goods sold, net profit, operating profit, and CAGR Compound annual growth rate recorded which indicates positive performance and future growth potential. Slidegeeks is here to make your presentations a breeze with Financial Projections Manufacturing Control Software Company Investor PPT Slide With our easy-to-use and customizable templates, you can focus on delivering your ideas rather than worrying about formatting. With a variety of designs to choose from, you are sure to find one that suits your needs. And with animations and unique photos, illustrations, and fonts, you can make your presentation pop. So whether you are giving a sales pitch or presenting to the board, make sure to check out Slidegeeks first This slide caters to the details related to the forecast of companies future. It highlights revenue, cost of goods sold, net profit, operating profit, and CAGR Compound annual growth rate recorded which indicates positive performance and future growth potential.
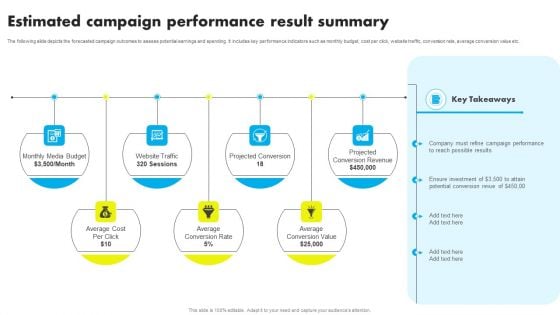
Estimated Campaign Performance Result Summary Ppt Slide PDF
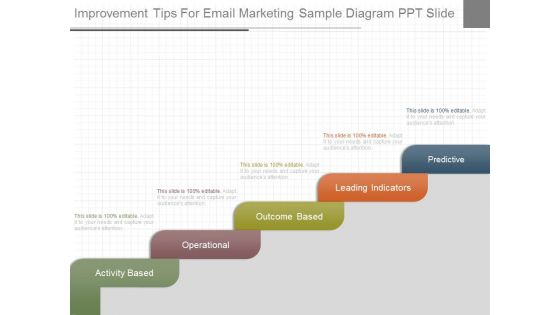
Improvement Tips For Email Marketing Sample Diagram Ppt Slide
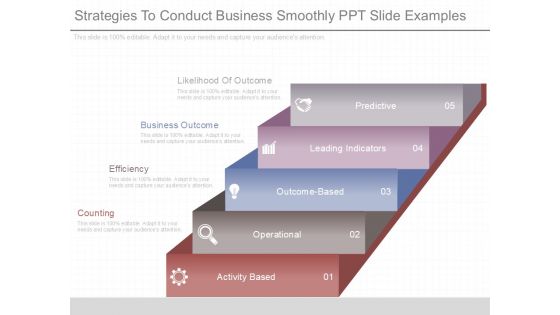
This is a improvement tips for email marketing sample diagram ppt slide. This is a five stage process. The stages in this process are activity based, operational, outcome based, leading indicators, predictive.
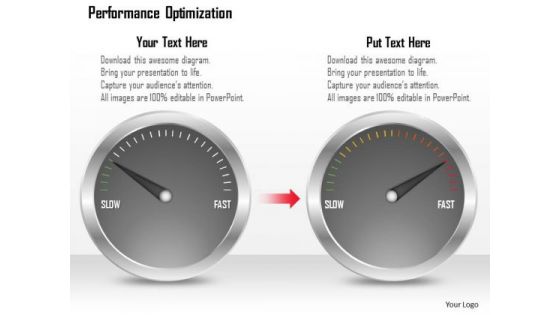
Business Framework Performance Optimization PowerPoint Presentation
Explain the concept of performance optimization with this exclusive template slide. This PPT diagram slide contains the graphic of two meters with maximum ratings. Use this PPT diagram slide and build exclusive presentation for your viewers.
Business Framework Client Satisfaction Levels PowerPoint Presentation
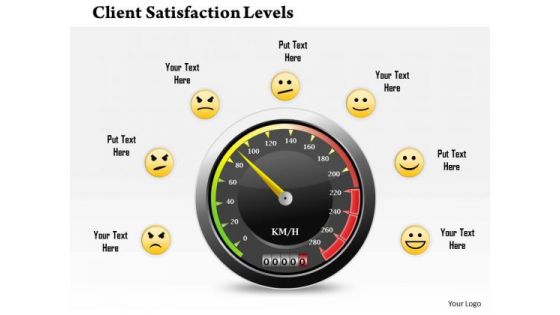
Graphic of black meter has been used to design this business diagram. This business slide displays the concept of client satisfaction with different levels. Use this editable diagram for customer and business related presentations.
Managing IT Operating System Infrastructure KPI Dashboard Showing Project Revenue Diagrams PDF
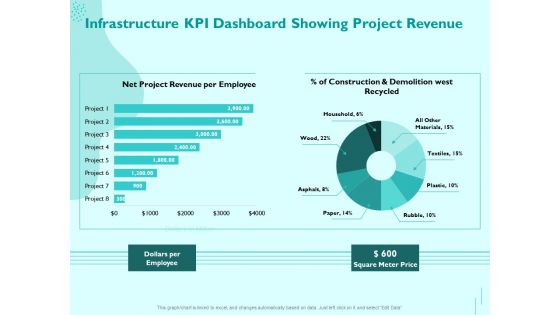
Presenting this set of slides with name managing it operating system infrastructure kpi dashboard showing project revenue diagrams pdf. The topics discussed in these slides are dollars per employee, square meter price. This is a completely editable PowerPoint presentation and is available for immediate download. Download now and impress your audience.

Basketball Teams Playing With Each Other At Tournament Ppt PowerPoint Presentation Visual Aids Ideas PDF
Presenting this set of slides with name customer satisfaction rating meter feedback rating scale sale services excellent ppt powerpoint presentation complete deck. The topics discussed in these slide is basketball teams playing with each other at tournament. This is a completely editable PowerPoint presentation and is available for immediate download. Download now and impress your audience.

Manufacturing Plant Sustainability Dashboard Indicating Sourcing And Consumption Ppt Slide SS
The following slide showcases business sustainability innovation model. It provides information about public policy, business case, financing, company level, stakeholders, etc. The Manufacturing Plant Sustainability Dashboard Indicating Sourcing And Consumption Ppt Slide SS is a compilation of the most recent design trends as a series of slides. It is suitable for any subject or industry presentation, containing attractive visuals and photo spots for businesses to clearly express their messages. This template contains a variety of slides for the user to input data, such as structures to contrast two elements, bullet points, and slides for written information. Slidegeeks is prepared to create an impression. The following slide showcases business sustainability innovation model. It provides information about public policy, business case, financing, company level, stakeholders, etc.
Self Performance Assessment Gauge Vector Icon Ppt PowerPoint Presentation Gallery Slide PDF
Persuade your audience using this self performance assessment gauge vector icon ppt powerpoint presentation gallery slide pdf. This PPT design covers three stages, thus making it a great tool to use. It also caters to a variety of topics including self performance assessment gauge vector icon. Download this PPT design now to present a convincing pitch that not only emphasizes the topic but also showcases your presentation skills.

Women Football Referee Indicating Rule Breaking Punishment Ppt PowerPoint Presentation Gallery Slide PDF
Presenting this set of slides with name women football referee indicating rule breaking punishment ppt powerpoint presentation gallery slide pdf. The topics discussed in these slide is women football referee indicating rule breaking punishment. This is a completely editable PowerPoint presentation and is available for immediate download. Download now and impress your audience.
Progress Indicator Ring Slide To Focus On The Existing Customers Rules PDF
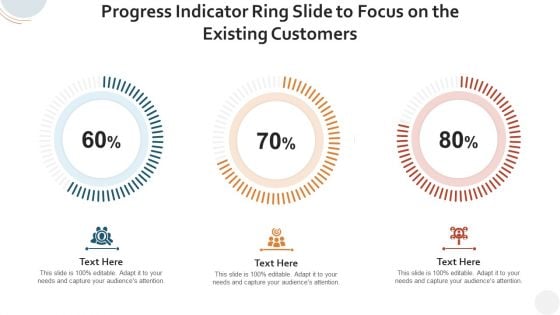
Showcasing this set of slides titled progress indicator ring slide to focus on the existing customers rules pdf. The topics addressed in these templates are progress indicator ring slide to focus on the existing customers. All the content presented in this PPT design is completely editable. Download it and make adjustments in color, background, font etc. as per your unique business setting.
Monthly Line Chart Indicating Monthly Data Comparison Ppt PowerPoint Presentation Model Slide Portrait
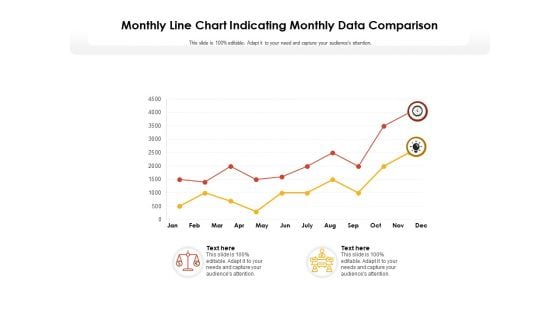
Showcasing this set of slides titled monthly line chart indicating monthly data comparison ppt powerpoint presentation model slide portrait. The topics addressed in these templates are monthly line chart indicating monthly data comparison. All the content presented in this PPT design is completely editable. Download it and make adjustments in color, background, font etc. as per your unique business setting.
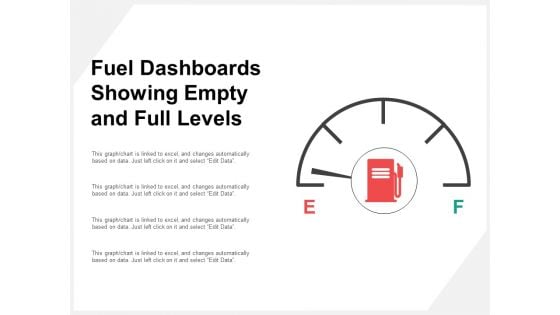
Fuel Dashboards Showing Empty And Full Levels Ppt PowerPoint Presentation Professional Slide Portrait
This is a fuel dashboards showing empty and full levels ppt powerpoint presentation professional slide portrait. This is a four stage process. The stages in this process are fuel gauge, gas gauge, fuel containers.
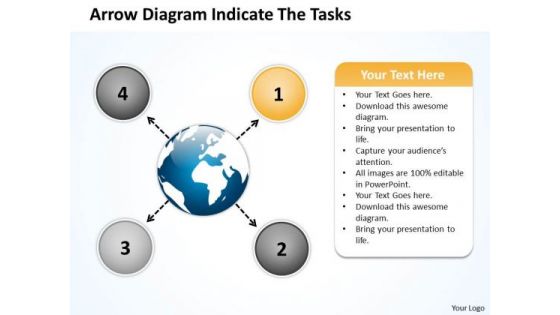
Arrow Diagram Indicate The Tasks Ppt Circular Flow Layout Process PowerPoint Slide
We present our arrow diagram indicate the tasks ppt Circular Flow Layout Process PowerPoint Slide.Download our Process and Flows PowerPoint Templates because the vision of being the market leader is clear to you. Download our Arrows PowerPoint Templates because this is a good example of the strength of teamwork. Use our Business PowerPoint Templates because this template helps you to delve on these thoughts and brief your team on the value of your depth of understanding of the subject. Download and present our Circle Charts PowerPoint Templates because the mind is always whirring with new ideas. Present our Flow Charts PowerPoint Templates because you know your business and have a vision for it.Use these PowerPoint slides for presentations relating to Arrows, choice, connect, design, direction, flows, four, info graph, instruction, layout, manual, marketing, modern, one, option, order, page, paper, pointing, process, product, promotion, sequence, simple, special, step, symbol. The prominent colors used in the PowerPoint template are Orange, Gray, Black. Presenters tell us our arrow diagram indicate the tasks ppt Circular Flow Layout Process PowerPoint Slide will help you be quick off the draw. Just enter your specific text and see your points hit home. Professionals tell us our design PowerPoint templates and PPT Slides are specially created by a professional team with vast experience. They diligently strive to come up with the right vehicle for your brilliant Ideas. PowerPoint presentation experts tell us our arrow diagram indicate the tasks ppt Circular Flow Layout Process PowerPoint Slide are Reminiscent. The feedback we get is that our direction PowerPoint templates and PPT Slides are effectively colour coded to prioritise your plans They automatically highlight the sequence of events you desire. Use our arrow diagram indicate the tasks ppt Circular Flow Layout Process PowerPoint Slide are Clever. Use our info PowerPoint templates and PPT Slides are Colorful. Get things going for you with our Arrow Diagram Indicate The Tasks Ppt Circular Flow Layout Process PowerPoint Slide. The audience will be in a favourable mood.
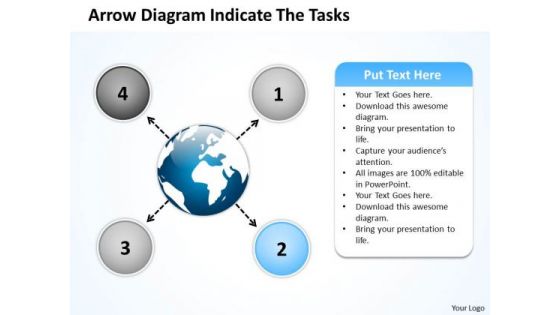
Arrow Diagram Indicate The Tasks Circular Flow Layout Process PowerPoint Slide
We present our arrow diagram indicate the tasks Circular Flow Layout Process PowerPoint Slide.Use our Process and Flows PowerPoint Templates because the atmosphere in the worplace is electric. Download and present our Arrows PowerPoint Templates because you know that the core of any organisation is the people who work for it. Use our Business PowerPoint Templates because the majestic tiger lord of all it surveys.It exudes power even when it is in repose. Download and present our Circle Charts PowerPoint Templates because you have a handle on all the targets, a master of the game, the experienced and consummate juggler. Download our Flow Charts PowerPoint Templates because this Layout can explain the relevance of the different layers and stages in getting down to your core competence, ability and desired result.Use these PowerPoint slides for presentations relating to Arrows, choice, connect, design, direction, flows, four, info graph, instruction, layout, manual, marketing, modern, one, option, order, page, paper, pointing, process, product, promotion, sequence, simple, special, step, symbol. The prominent colors used in the PowerPoint template are Blue light, Blue, Black. Presenters tell us our arrow diagram indicate the tasks Circular Flow Layout Process PowerPoint Slide are Stylish. Professionals tell us our info PowerPoint templates and PPT Slides are Fashionable. PowerPoint presentation experts tell us our arrow diagram indicate the tasks Circular Flow Layout Process PowerPoint Slide will make the presenter look like a pro even if they are not computer savvy. The feedback we get is that our connect PowerPoint templates and PPT Slides are Fashionable. Use our arrow diagram indicate the tasks Circular Flow Layout Process PowerPoint Slide are Zippy. Use our four PowerPoint templates and PPT Slides are Royal. Be a proactive manager with our Arrow Diagram Indicate The Tasks Circular Flow Layout Process PowerPoint Slide. They will make you look good.

PR Plan Approaches With Rethink Goals Ppt PowerPoint Presentation Summary Slide Download
Presenting this set of slides with name pr plan approaches with rethink goals ppt powerpoint presentation summary slide download. This is a three stage process. The stages in this process are rethink goals, gauge impact on search, long term narrative vs episodic campaign. This is a completely editable PowerPoint presentation and is available for immediate download. Download now and impress your audience.
Key Financial Ratios Template 2 Ppt PowerPoint Presentation Icon Slide Download
This is a key financial ratios template 2 ppt powerpoint presentation icon slide download. This is a six stage process. The stages in this process are price to earnings, debt to equity ratio, current ratio, return on, equity, return on , assets, return on investment.
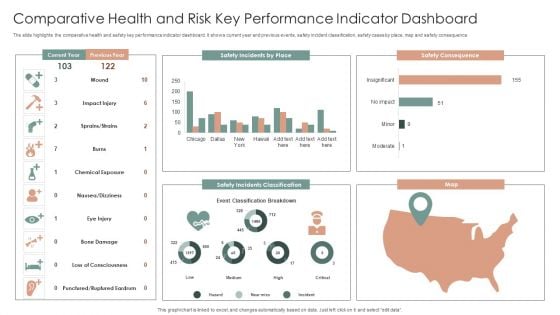
Comparative Health And Risk Key Performance Indicator Dashboard Ppt Portfolio Slide PDF
The slide highlights the comparative health and safety key performance indicator dashboard. It shows current year and previous events, safety incident classification, safety cases by place, map and safety consequence. Showcasing this set of slides titled Comparative Health And Risk Key Performance Indicator Dashboard Ppt Portfolio Slide PDF. The topics addressed in these templates are Safety Consequence, Safety Incidents Classification, Map. All the content presented in this PPT design is completely editable. Download it and make adjustments in color, background, font etc. as per your unique business setting.
Drug Indicator Extension In A Pharmaceuticals Company Case Competition Icons Slide Portrait PDF
Introducing our well designed drug indicator extension in a pharmaceuticals company case competition icons slide portrait pdf set of slides. The slide displays editable icons to enhance your visual presentation. The icons can be edited easily. So customize according to your business to achieve a creative edge. Download and share it with your audience.


 Continue with Email

 Home
Home


