Metrics Dashboard
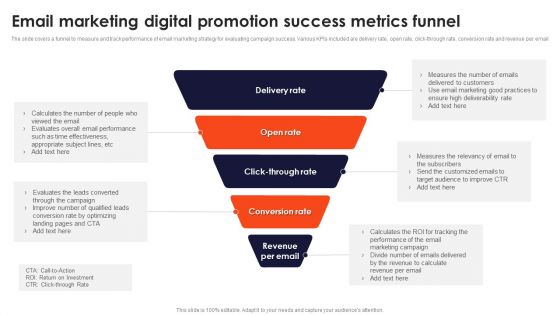
Email Marketing Digital Promotion Success Metrics Funnel Infographics PDF
The slide covers a funnel to measure and track performance of email marketing strategy for evaluating campaign success. Various KPIs included are delivery rate, open rate, click-through rate, conversion rate and revenue per email. Presenting Email Marketing Digital Promotion Success Metrics Funnel Infographics PDF to dispense important information. This template comprises Four stages. It also presents valuable insights into the topics including Delivery Rate, Open Rate, Conversion Rate. This is a completely customizable PowerPoint theme that can be put to use immediately. So, download it and address the topic impactfully.

Metrics And Objectives To Measure Employees Performance Clipart PDF
The purpose of this slide is to showcase different KPIs and objectives used to measure employee efficiency. The KPI could be Revenue per employee profit per employee average task completion rate and utilization rate. Showcasing this set of slides titled Metrics And Objectives To Measure Employees Performance Clipart PDF. The topics addressed in these templates are Utilization Rate, Profit Per Employee, Revenue Per Employee. All the content presented in this PPT design is completely editable. Download it and make adjustments in color, background, font etc. as per your unique business setting.
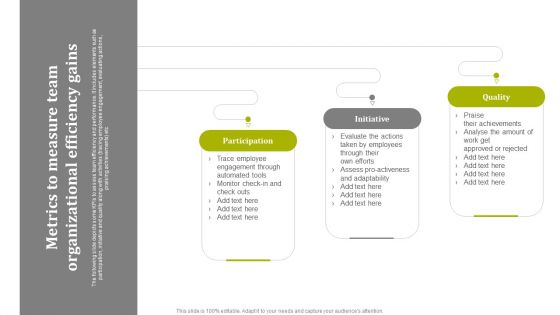
Metrics To Measure Team Organizational Efficiency Gains Professional PDF
The following slide depicts some KPIs to assess team efficiency and performance. It includes elements such as participation, initiative and quality along with activities tracing employee engagement, evaluating actions, praising achievements etc. Persuade your audience using this Metrics To Measure Team Organizational Efficiency Gains Professional PDF. This PPT design covers three stages, thus making it a great tool to use. It also caters to a variety of topics including Participation, Initiative, Quality. Download this PPT design now to present a convincing pitch that not only emphasizes the topic but also showcases your presentation skills.
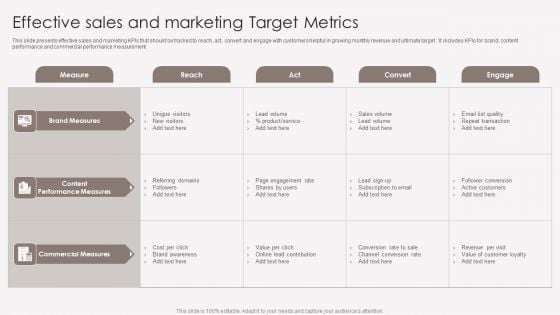
Effective Sales And Marketing Target Metrics Mockup PDF
This slide presents effective sales and marketing KPIs that should be tracked to reach, act, convert and engage with customers helpful in growing monthly revenue and ultimate target . It includes KPIs for brand, content performance and commercial performance measurement. Pitch your topic with ease and precision using this Effective Sales And Marketing Target Metrics Mockup PDF. This layout presents information on Brand Measures, Content Performance Measures, Commercial Measures. It is also available for immediate download and adjustment. So, changes can be made in the color, design, graphics or any other component to create a unique layout.
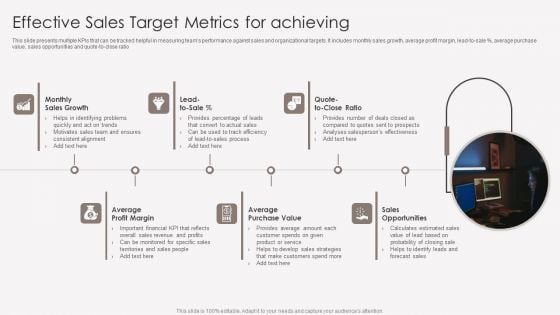
Effective Sales Target Metrics For Achieving Elements PDF
This slide presents multiple KPIs that can be tracked helpful in measuring teams performance against sales and organizational targets. It includes monthly sales growth, average profit margin, lead to sale, average purchase value, sales opportunities and quote to close ratio. Presenting Effective Sales Target Metrics For Achieving Elements PDF to dispense important information. This template comprises six stages. It also presents valuable insights into the topics including Monthly Sales Growth, Average Purchase Value, Sales Opportunities. This is a completely customizable PowerPoint theme that can be put to use immediately. So, download it and address the topic impactfully.
Metrics Scorecard With Internal Objectives And Customer Satisfaction Icons PDF
The purpose of this slide is to showcase different KPIs for company business. Information covered in this slide is related to financial status, business growth, internal objectives and customer satisfaction. Showcasing this set of slides titled Metrics Scorecard With Internal Objectives And Customer Satisfaction Icons PDF. The topics addressed in these templates are Financial Status, Customer Satisfaction, Internal Objectives. All the content presented in this PPT design is completely editable. Download it and make adjustments in color, background, font etc. as per your unique business setting.
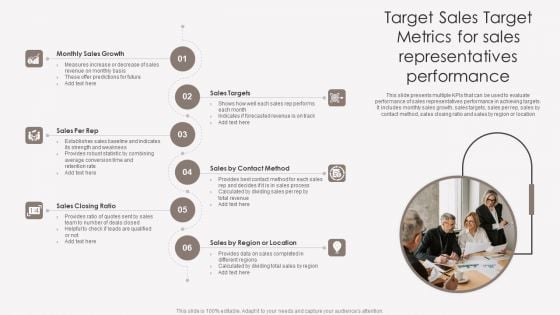
Target Sales Target Metrics For Sales Representatives Performance Ideas PDF
This slide presents multiple KPIs that can be used to evaluate performance of sales representatives performance in achieving targets. It includes monthly sales growth, sales targets, sales per rep, sales by contact method, sales closing ratio and sales by region or location. Persuade your audience using this Target Sales Target Metrics For Sales Representatives Performance Ideas PDF. This PPT design covers six stages, thus making it a great tool to use. It also caters to a variety of topics including Monthly Sales Growth, Sales Closing Ratio, Region Or Location. Download this PPT design now to present a convincing pitch that not only emphasizes the topic but also showcases your presentation skills.
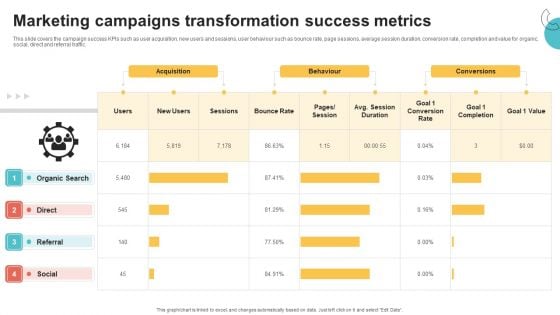
Digital Marketing Toolkit Marketing Campaigns Transformation Success Metrics Rules PDF
This slide covers the campaign success KPIs such as user acquisition, new users and sessions, user behaviour such as bounce rate, page sessions, average session duration, conversion rate, completion and value for organic, social, direct and referral traffic. Make sure to capture your audiences attention in your business displays with our gratis customizable Digital Marketing Toolkit Marketing Campaigns Transformation Success Metrics Rules PDF. These are great for business strategies, office conferences, capital raising or task suggestions. If you desire to acquire more customers for your tech business and ensure they stay satisfied, create your own sales presentation with these plain slides.
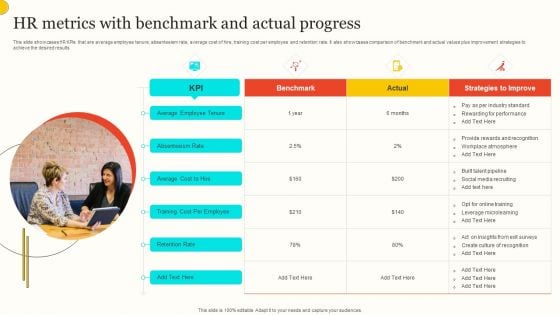
HR Metrics With Benchmark And Actual Progress Background PDF
This slide showcases HR KPIs that are average employee tenure, absenteeism rate, average cost of hire, training cost per employee and retention rate. It also showcases comparison of benchmark and actual values plus improvement strategies to achieve the desired results. Presenting HR Metrics With Benchmark And Actual Progress Background PDF to dispense important information. This template comprises one stages. It also presents valuable insights into the topics including Average Employee Tenure, Absenteeism Rate, Average Cost Hire. This is a completely customizable PowerPoint theme that can be put to use immediately. So, download it and address the topic impactfully.
Open Risks And Issues Metrics For Software Development Icons PDF
This slide displays analytics to offer real-time data and insights on application programming project to keep it on schedule. It further includes details about change requests and bugs. Pitch your topic with ease and precision using this Open Risks And Issues Metrics For Software Development Icons PDF. This layout presents information on Priority, Risks, Change Requests. It is also available for immediate download and adjustment. So, changes can be made in the color, design, graphics or any other component to create a unique layout.
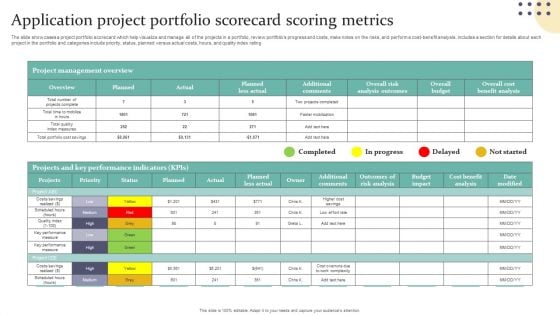
Application Project Portfolio Scorecard Scoring Metrics Information PDF
The slide showcases a project portfolio scorecard which help visualize and manage all of the projects in a portfolio, review portfolios progress and costs, make notes on the risks, and perform a cost-benefit analysis. includes a section for details about each project in the portfolio and categories include priority, status, planned versus actual costs, hours, and quality index rating. Showcasing this set of slides titled Application Project Portfolio Scorecard Scoring Metrics Information PDF. The topics addressed in these templates are Project Management Overview, Projects Key Performance Indicators, Additional Comments. All the content presented in this PPT design is completely editable. Download it and make adjustments in color, background, font etc. as per your unique business setting.
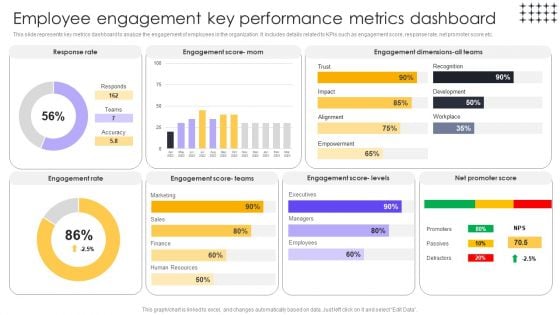
Tools For HR Business Analytics Employee Engagement Key Performance Metrics Brochure PDF
This slide represents key metrics dashboard to analyze the engagement of employees in the organization. It includes details related to KPIs such as engagement score, response rate, net promoter score etc. Make sure to capture your audiences attention in your business displays with our gratis customizable Tools For HR Business Analytics Employee Engagement Key Performance Metrics Brochure PDF. These are great for business strategies, office conferences, capital raising or task suggestions. If you desire to acquire more customers for your tech business and ensure they stay satisfied, create your own sales presentation with these plain slides.
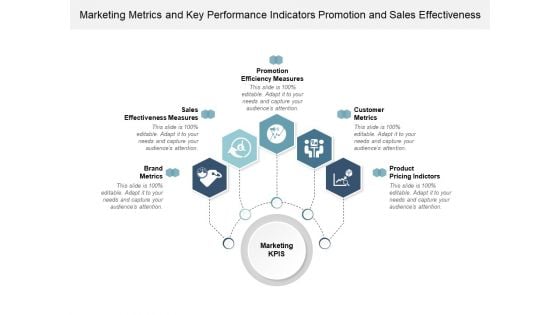
Marketing Metrics And Key Performance Indicators Promotion And Sales Effectiveness Ppt Powerpoint Presentation Infographics Graphics Example
This is a marketing metrics and key performance indicators promotion and sales effectiveness ppt powerpoint presentation infographics graphics example. This is a five stage process. The stages in this process are dashboard, kpi, metrics.
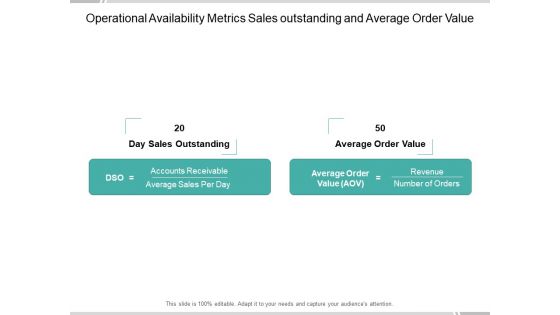
Operational Availability Metrics Sales Outstanding And Average Order Value Ppt Powerpoint Presentation Infographic Template Introduction
This is a operational availability metrics sales outstanding and average order value ppt powerpoint presentation infographic template introduction. This is a two stage process. The stages in this process are availability kpi, availability dashboard, availability metrics.
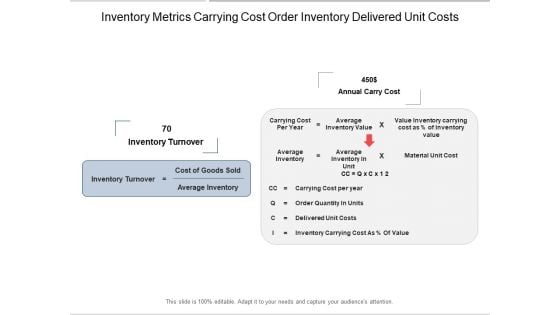
Inventory Metrics Carrying Cost Order Inventory Delivered Unit Costs Ppt Powerpoint Presentation Layouts Guidelines
This is a inventory metrics carrying cost order inventory delivered unit costs ppt powerpoint presentation layouts guidelines. This is a two stage process. The stages in this process are availability kpi, availability dashboard, availability metrics.
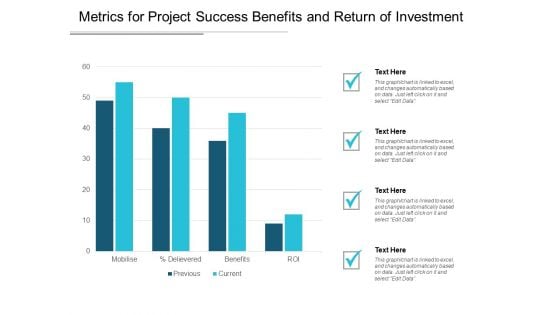
Metrics For Project Success Benefits And Return Of Investment Ppt PowerPoint Presentation Pictures Structure
This is a metrics for project success benefits and return of investment ppt powerpoint presentation pictures structure. This is a four stage process. The stages in this process are project dashboard, project kpis, project metrics.

Metrics In Project Management Planning Design Development Ppt PowerPoint Presentation Outline Show
This is a metrics in project management planning design development ppt powerpoint presentation outline show. This is a two stage process. The stages in this process are project dashboard, project kpis, project metrics.
Project Management Metrics And Variances Schedule Variance And Test Defect Ppt PowerPoint Presentation Icon Influencers
This is a project management metrics and variances schedule variance and test defect ppt powerpoint presentation icon influencers. This is a five stage process. The stages in this process are project dashboard, project kpis, project metrics.
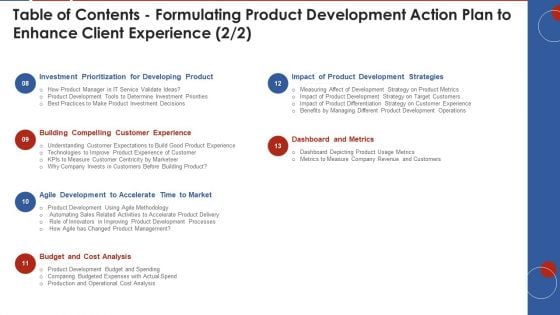
Table Of Contents Formulating Product Development Action Plan To Enhance Client Experience Metrics Themes PDF
Deliver and pitch your topic in the best possible manner with this table of contents formulating product development action plan to enhance client experience metrics themes pdf. Use them to share invaluable insights on investment prioritization, agile development, cost analysis, dashboard and metrics, development strategies and impress your audience. This template can be altered and modified as per your expectations. So, grab it now.
Inventory Metrics Carrying Cost Order Inventory Delivered Unit Costs Ppt PowerPoint Presentation Icon Example
Presenting this set of slides with name inventory metrics carrying cost order inventory delivered unit costs ppt powerpoint presentation icon example. The topics discussed in these slides are availability kpi, availability dashboard, availability metrics. This is a completely editable PowerPoint presentation and is available for immediate download. Download now and impress your audience.
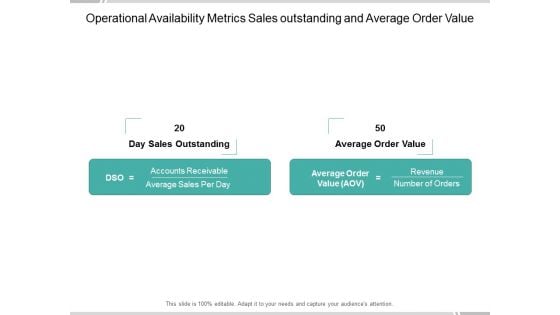
Operational Availability Metrics Sales Outstanding And Average Order Value Ppt PowerPoint Presentation Ideas Tips
Presenting this set of slides with name operational availability metrics sales outstanding and average order value ppt powerpoint presentation ideas tips. The topics discussed in these slides are availability kpi, availability dashboard, availability metrics. This is a completely editable PowerPoint presentation and is available for immediate download. Download now and impress your audience.
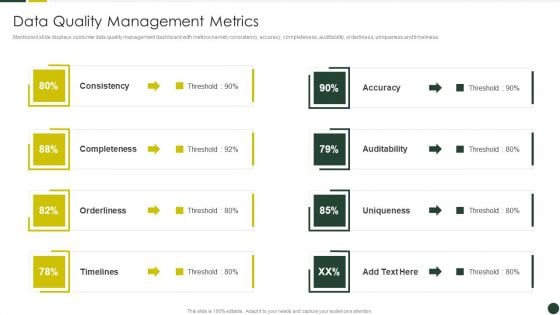
Quality Management Plan Templates Set 2 Data Quality Management Metrics Structure PDF
Mentioned slide displays customer data quality management dashboard with metrics namely consistency, accuracy, completeness, auditability, orderliness, uniqueness and timeliness. Deliver an awe inspiring pitch with this creative Quality Management Plan Templates Set 2 Data Quality Management Metrics Structure PDF bundle. Topics like Consistency, Completeness, Orderliness can be discussed with this completely editable template. It is available for immediate download depending on the needs and requirements of the user.
CRM System Deployment Plan Implementation Steps Determine Metrics Supporting Icons PDF
This slide covers various KPIs that need to be measured to achieve organizational goals. It includes metrics such as salespersons performance report, number of leads converted, leads generated through campaigns, monthly sales report, number of unresolved cases, etc. This is a CRM System Deployment Plan Implementation Steps Determine Metrics Supporting Icons PDF template with various stages. Focus and dispense information on one stages using this creative set, that comes with editable features. It contains large content boxes to add your information on topics like Report And Dashboard, Metrics, Resource. You can also showcase facts, figures, and other relevant content using this PPT layout. Grab it now.
Collection Of Quality Assurance PPT Data Quality Management Metrics Information PDF
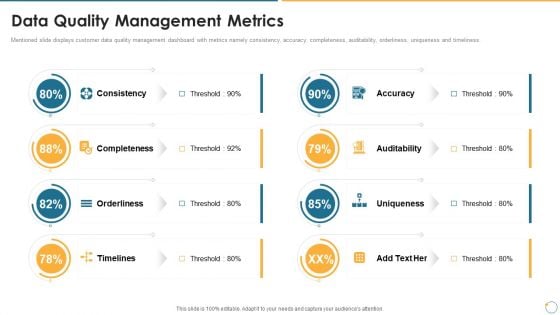
Mentioned slide displays customer data quality management dashboard with metrics namely consistency, accuracy, completeness, auditability, orderliness, uniqueness and timeliness. This is a collection of quality assurance ppt data quality management metrics information pdf template with various stages. Focus and dispense information on eight stages using this creative set, that comes with editable features. It contains large content boxes to add your information on topics like accuracy, auditability, consistency, completeness, uniqueness. You can also showcase facts, figures, and other relevant content using this PPT layout. Grab it now.
Quality Assurance Templates Set 2 Data Quality Management Metrics Pictures PDF
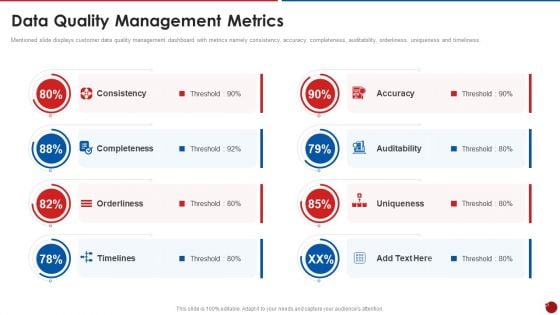
Mentioned slide displays customer data quality management dashboard with metrics namely consistency, accuracy, completeness, auditability, orderliness, uniqueness and timeliness. Presenting quality assurance templates set 2 data quality management metrics pictures pdf to provide visual cues and insights. Share and navigate important information on eight stages that need your due attention. This template can be used to pitch topics like consistency, completeness, orderliness, timelines, accuracy. In addtion, this PPT design contains high resolution images, graphics, etc, that are easily editable and available for immediate download.
QA Plan Set 2 Data Quality Management Metrics Ppt PowerPoint Presentation Gallery Background Image PDF
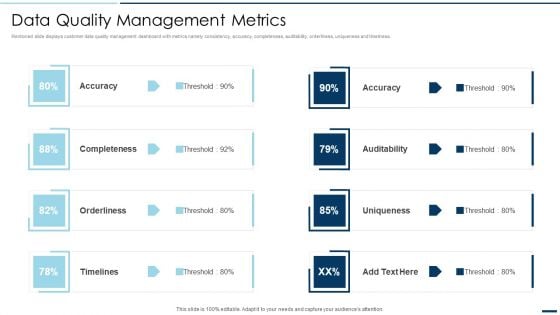
Mentioned slide displays customer data quality management dashboard with metrics namely consistency, accuracy, completeness, auditability, orderliness, uniqueness and timeliness. Presenting QA Plan Set 2 Data Quality Management Metrics Ppt PowerPoint Presentation Gallery Background Image PDF to provide visual cues and insights. Share and navigate important information on eight stages that need your due attention. This template can be used to pitch topics like Accuracy Completeness, Orderliness Timelines. In addtion, this PPT design contains high resolution images, graphics, etc, that are easily editable and available for immediate download.
Supply Chain Logistics Metrics For Order Fulfilment Ppt PowerPoint Presentation Infographic Template Information
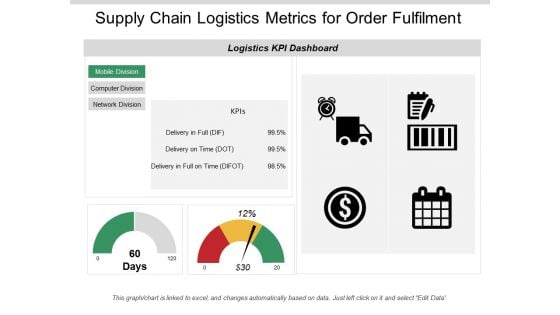
This is a supply chain logistics metrics for order fulfilment ppt powerpoint presentation infographic template information. This is a two stage process. The stages in this process are logistics performance, logistics dashboard, logistics kpis.

Supply Chain Metrics Fleet Efficiency Loading Time And Weight Ppt PowerPoint Presentation Portfolio Guidelines
This is a supply chain metrics fleet efficiency loading time and weight ppt powerpoint presentation portfolio guidelines. This is a four stage process. The stages in this process are logistics performance, logistics dashboard, logistics kpis.
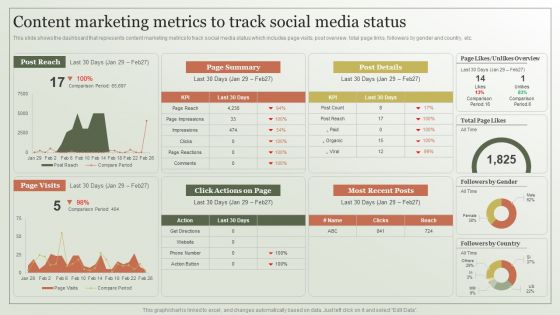
Content Marketing Strategy Content Marketing Metrics To Track Social Media Template PDF
This slide shows the dashboard that represents content marketing metrics to track social media status which includes page visits, post overview, total page links, followers by gender and country, etc. Slidegeeks is one of the best resources for PowerPoint templates. You can download easily and regulate Content Marketing Strategy Content Marketing Metrics To Track Social Media Template PDFfor your personal presentations from our wonderful collection. A few clicks is all it takes to discover and get the most relevant and appropriate templates. Use our Templates to add a unique zing and appeal to your presentation and meetings. All the slides are easy to edit and you can use them even for advertisement purposes.
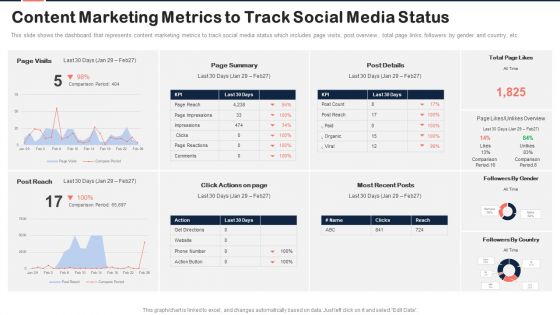
Implementing Content Marketing Plan To Nurture Leads Content Marketing Metrics To Track Diagrams PDF
This slide shows the dashboard that represents content marketing metrics to track social media status which includes page visits, post overview, total page links, followers by gender and country, etc. Crafting an eye catching presentation has never been more straightforward. Let your presentation shine with this tasteful yet straightforward Implementing Content Marketing Plan To Nurture Leads Content Marketing Metrics To Track Diagrams PDF template. It offers a minimalistic and classy look that is great for making a statement. The colors have been employed intelligently to add a bit of playfulness while still remaining professional. Construct the ideal Implementing Content Marketing Plan To Nurture Leads Content Marketing Metrics To Track Diagrams PDF that effortlessly grabs the attention of your audience Begin now and be certain to wow your customers.
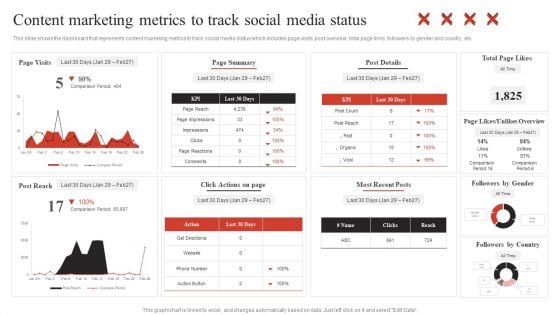
Developing Content Marketing Content Marketing Metrics To Track Social Media Themes PDF
This slide shows the dashboard that represents content marketing metrics to track social media status which includes page visits, post overview, total page links, followers by gender and country, etc. Do you have to make sure that everyone on your team knows about any specific topic I yes, then you should give Developing Content Marketing Content Marketing Metrics To Track Social Media Themes PDF a try. Our experts have put a lot of knowledge and effort into creating this impeccable Developing Content Marketing Content Marketing Metrics To Track Social Media Themes PDF. You can use this template for your upcoming presentations, as the slides are perfect to represent even the tiniest detail. You can download these templates from the Slidegeeks website and these are easy to edit. So grab these today.
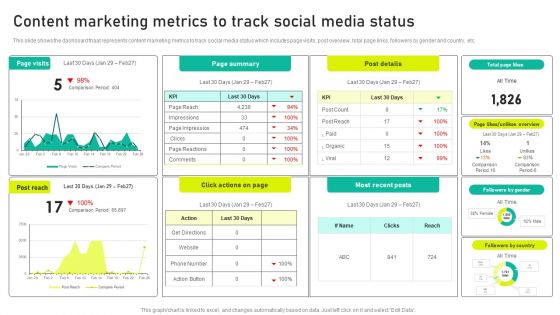
Content Marketing Metrics To Track Social Media Status Ppt Pictures Show PDF
This slide shows the dashboard thaat represents content marketing metrics to track social media status which includes page visits, post overview, total page links, followers by gender and country, etc. Formulating a presentation can take up a lot of effort and time, so the content and message should always be the primary focus. The visuals of the PowerPoint can enhance the presenters message, so our Content Marketing Metrics To Track Social Media Status Ppt Pictures Show PDF was created to help save time. Instead of worrying about the design, the presenter can concentrate on the message while our designers work on creating the ideal templates for whatever situation is needed. Slidegeeks has experts for everything from amazing designs to valuable content, we have put everything into Content Marketing Metrics To Track Social Media Status Ppt Pictures Show PDF.
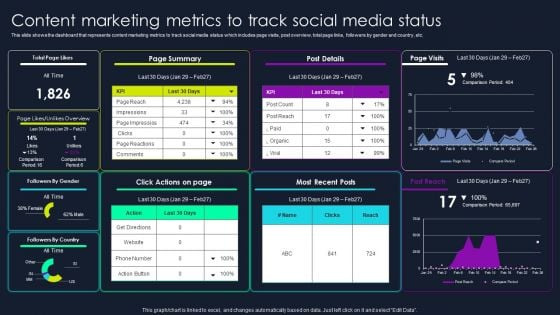
Lead Nurturing Tactics For Lead Generation Content Marketing Metrics To Track Social Media Status Topics PDF
This slide shows the dashboard that represents content marketing metrics to track social media status which includes page visits, post overview, total page links, followers by gender and country, etc. Slidegeeks is here to make your presentations a breeze with Lead Nurturing Tactics For Lead Generation Content Marketing Metrics To Track Social Media Status Topics PDF With our easy to use and customizable templates, you can focus on delivering your ideas rather than worrying about formatting. With a variety of designs to choose from, you are sure to find one that suits your needs. And with animations and unique photos, illustrations, and fonts, you can make your presentation pop. So whether you are giving a sales pitch or presenting to the board, make sure to check out Slidegeeks first.
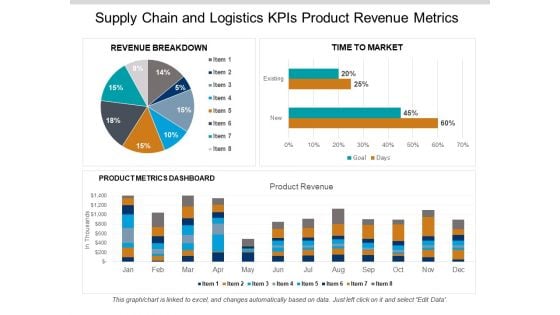
Supply Chain And Logistics Kpis Product Revenue Metrics Ppt PowerPoint Presentation Gallery Aids
This is a supply chain and logistics kpis product revenue metrics ppt powerpoint presentation gallery aids. This is a three stage process. The stages in this process are logistics performance, logistics dashboard, logistics kpis.
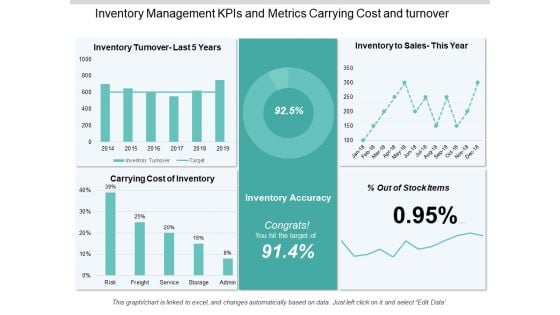
Inventory Management Kpis And Metrics Carrying Cost And Turnover Ppt PowerPoint Presentation Information
This is a inventory management kpis and metrics carrying cost and turnover ppt powerpoint presentation information. This is a five stage process. The stages in this process are logistics performance, logistics dashboard, logistics kpis.
Logistics Kpis And Metrics Percentage Of Orders Delivered Ppt PowerPoint Presentation Icon
This is a logistics kpis and metrics percentage of orders delivered ppt powerpoint presentation icon. This is a five stage process. The stages in this process are logistics performance, logistics dashboard, logistics kpis.
Metrics For Digital Marketing And Conversion Tracking Ppt PowerPoint Presentation Pictures Icon
This is a metrics for digital marketing and conversion tracking ppt powerpoint presentation pictures icon. This is a four stage process. The stages in this process are marketing analytics, marketing performance, marketing discovery.
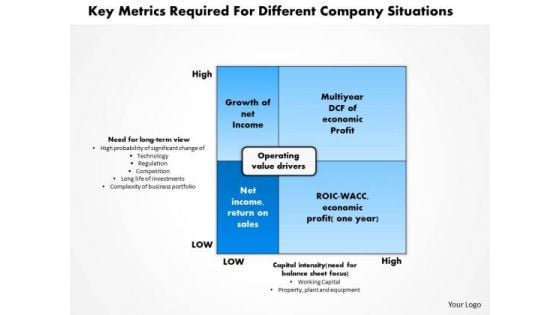
Business Framework Key Metrics Required For Different Company Situations PowerPoint Presentation
This diagram has been designed with framework of key metrics required for different company situations. This diagram contains rectangle of operating value drivers with four sections inside it representing terms like growth of net Income, multiyear DCF of economic profit, net income, return on sales, ROIC-WACC, and economic profit. Use this as a major element in streamlining any business process.
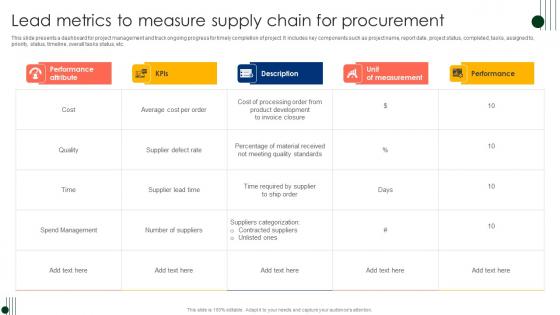
Lead Metrics To Measure Supply Chain For Procurement Ppt Professional Design Inspiration Pdf
This slide presents a dashboard for project management and track ongoing progress for timely completion of project. It includes key components such as project name, report date, project status, completed, tasks, assigned to, priority, status, timeline, overall tasks status, etc. Showcasing this set of slides titled Lead Metrics To Measure Supply Chain For Procurement Ppt Professional Design Inspiration Pdf. The topics addressed in these templates are Project Status, Completed, Tasks, Assigned To, Priority. All the content presented in this PPT design is completely editable. Download it and make adjustments in color, background, font etc. as per your unique business setting. This slide presents a dashboard for project management and track ongoing progress for timely completion of project. It includes key components such as project name, report date, project status, completed, tasks, assigned to, priority, status, timeline, overall tasks status, etc.
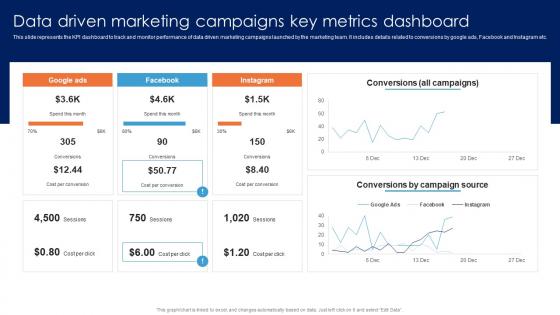
Data Driven Marketing Campaigns Key Metrics Guide For Data Driven Advertising Guidelines Pdf
This slide represents the KPI dashboard to track and monitor performance of data driven marketing campaigns launched by the marketing team. It includes details related to conversions by google ads, Facebook and Instagram etc.The Data Driven Marketing Campaigns Key Metrics Guide For Data Driven Advertising Guidelines Pdf is a compilation of the most recent design trends as a series of slides. It is suitable for any subject or industry presentation, containing attractive visuals and photo spots for businesses to clearly express their messages. This template contains a variety of slides for the user to input data, such as structures to contrast two elements, bullet points, and slides for written information. Slidegeeks is prepared to create an impression. This slide represents the KPI dashboard to track and monitor performance of data driven marketing campaigns launched by the marketing team. It includes details related to conversions by google ads, Facebook and Instagram etc.
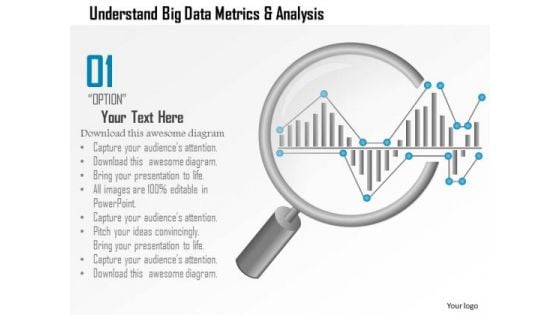
Business Diagram Understand Big Data Metrics And Analysis Showing By Magnifying Glass Ppt Slide
This PPT slide has been designed with big data metrics and magnifying glass. This diagram helps to portray concept of data analysis and data search. Download this diagram to make professional presentations.
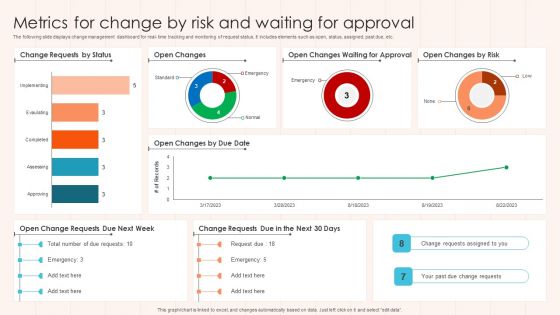
Metrics For Change By Risk And Waiting For Approval Diagrams PDF
The following slide displays change management dashboard for real- time tracking and monitoring of request status. It includes elements such as open, status, assigned, past due, etc. Pitch your topic with ease and precision using this Metrics For Change By Risk And Waiting For Approval Diagrams PDF This layout presents information on Approval, Risk, Status. It is also available for immediate download and adjustment. So, changes can be made in the color, design, graphics or any other component to create a unique layout.
Metrics For Change Tracking By Status And Alert Level Microsoft PDF
This slide displays dashboard for better understanding of change configuration management in the organization. It includes tickets by tech group, request type, activity, etc. Showcasing this set of slides titled Metrics For Change Tracking By Status And Alert Level Microsoft PDF The topics addressed in these templates are Tickets Activity, Status, Alert Level. All the content presented in this PPT design is completely editable. Download it and make adjustments in color, background, font etc. as per your unique business setting.
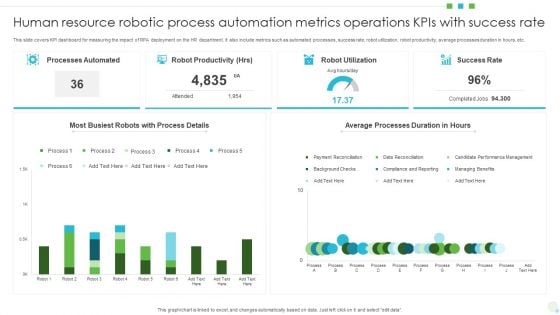
Human Resource Robotic Process Automation Metrics Operations Kpis With Success Rate Themes PDF
This slide covers KPI dashboard for measuring the impact of RPA deployment on the HR department. It also include metrics such as automated processes, success rate, robot utilization, robot productivity, average processes duration in hours, etc. Showcasing this set of slides titled Human Resource Robotic Process Automation Metrics Operations Kpis With Success Rate Themes PDF. The topics addressed in these templates are Processes Automated, Robot Productivity, Robot Utilization. All the content presented in this PPT design is completely editable. Download it and make adjustments in color, background, font etc. as per your unique business setting.
Robotic Process Automation Metrics Tracker With Work Item Statistics Information PDF
This slide covers the RPA dashboard for analysing process data status. It also includes process details such as run success rate, inputs, processing, fail, output, robotic run minutes, total value generated, work items processed. Pitch your topic with ease and precision using this Robotic Process Automation Metrics Tracker With Work Item Statistics Information PDF. This layout presents information on Robotic Process Automation, Metrics Tracker, Work Item Statistics. It is also available for immediate download and adjustment. So, changes can be made in the color, design, graphics or any other component to create a unique layout.
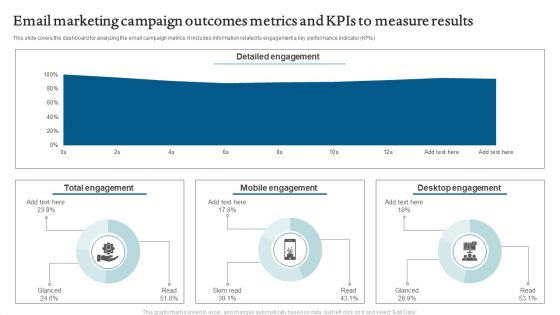
Email Marketing Campaign Outcomes Metrics And Kpis To Measure Results Rules PDF
This slide depicts the dashboard for analyzing the results of email campaign and social media marketing. It includes information related to the comparison, statistics, usage, etc. Showcasing this set of slides titled Email Marketing Campaign Outcomes Metrics And Kpis To Measure Results Rules PDF. The topics addressed in these templates are Detailed Engagement, Mobile Engagement, Desktop Engagement. All the content presented in this PPT design is completely editable. Download it and make adjustments in color, background, font etc. as per your unique business setting.
Customer Satisfaction Metrics With NPR And Customer Effort Score Ppt Icon Graphics Tutorials PDF
The slide carries a dashboard to evaluate customer experience for bringing advancement in existing products. Various KPIs used to measure customer experience are NPS Net Promoter Score and CES Customer Effort Score. Showcasing this set of slides titled Customer Satisfaction Metrics With NPR And Customer Effort Score Ppt Icon Graphics Tutorials PDF. The topics addressed in these templates are Net Promoter Score, Customer Effort Score, Product Service Reviews. All the content presented in this PPT design is completely editable. Download it and make adjustments in color, background, font etc. as per your unique business setting.
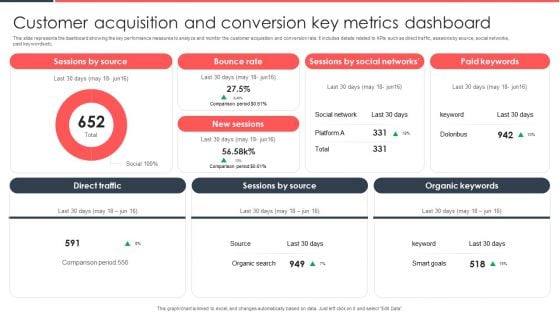
Implementing Management System To Enhance Ecommerce Processes Customer Acquisition And Conversion Key Metrics Pictures PDF
This slide represents the dashboard showing the key performance measures to analyze and monitor the customer acquisition and conversion rate. It includes details related to KPIs such as direct traffic, sessions by source, social networks, paid keywords etc. Presenting this PowerPoint presentation, titled Implementing Management System To Enhance Ecommerce Processes Customer Acquisition And Conversion Key Metrics Pictures PDF, with topics curated by our researchers after extensive research. This editable presentation is available for immediate download and provides attractive features when used. Download now and captivate your audience. Presenting this Implementing Management System To Enhance Ecommerce Processes Customer Acquisition And Conversion Key Metrics Pictures PDF. Our researchers have carefully researched and created these slides with all aspects taken into consideration. This is a completely customizable Implementing Management System To Enhance Ecommerce Processes Customer Acquisition And Conversion Key Metrics Pictures PDF that is available for immediate downloading. Download now and make an impact on your audience. Highlight the attractive features available with our PPTs.
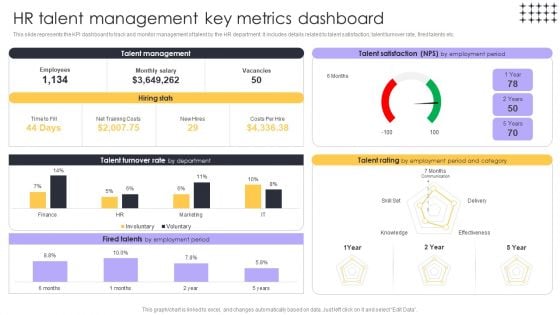
Tools For HR Business Analytics HR Talent Management Key Metrics Structure PDF
This slide represents the KPI dashboard to track and monitor management of talent by the HR department. It includes details related to talent satisfaction, talent turnover rate, fired talents etc. This modern and well-arranged Tools For HR Business Analytics HR Talent Management Key Metrics Structure PDF provides lots of creative possibilities. It is very simple to customize and edit with the Powerpoint Software. Just drag and drop your pictures into the shapes. All facets of this template can be edited with Powerpoint, no extra software is necessary. Add your own material, put your images in the places assigned for them, adjust the colors, and then you can show your slides to the world, with an animated slide included.
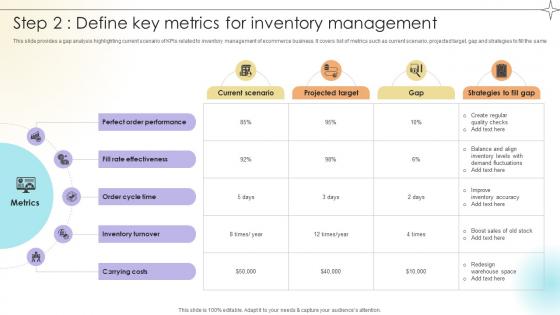
Step 2 Define Key Metrics For Inventory Management Data Analytics SS V
This slide provides a gap analysis highlighting current scenario of KPIs related to inventory management of ecommerce business. It covers list of metrics such as current scenario, projected target, gap and strategies to fill the same.Make sure to capture your audiences attention in your business displays with our gratis customizable Step 2 Define Key Metrics For Inventory Management Data Analytics SS V. These are great for business strategies, office conferences, capital raising or task suggestions. If you desire to acquire more customers for your tech business and ensure they stay satisfied, create your own sales presentation with these plain slides. This slide provides a gap analysis highlighting current scenario of KPIs related to inventory management of ecommerce business. It covers list of metrics such as current scenario, projected target, gap and strategies to fill the same.
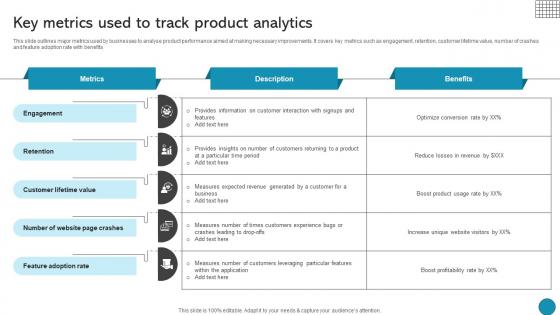
Key Metrics Used To Track Product Analytics Driving Business Success Integrating Product
This slide outlines major metrics used by businesses to analyse product performance aimed at making necessary improvements. It covers key metrics such as engagement, retention, customer lifetime value, number of crashes and feature adoption rate with benefits Find a pre-designed and impeccable Key Metrics Used To Track Product Analytics Driving Business Success Integrating Product. The templates can ace your presentation without additional effort. You can download these easy-to-edit presentation templates to make your presentation stand out from others. So, what are you waiting for Download the template from Slidegeeks today and give a unique touch to your presentation. This slide outlines major metrics used by businesses to analyse product performance aimed at making necessary improvements. It covers key metrics such as engagement, retention, customer lifetime value, number of crashes and feature adoption rate with benefits
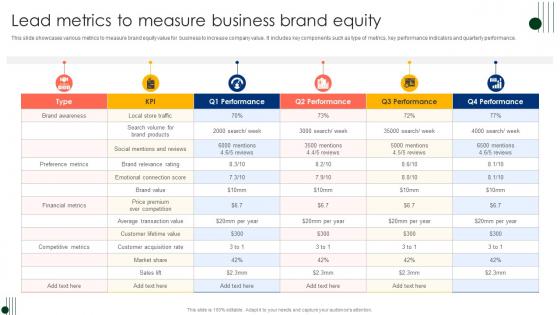
Lead Metrics To Measure Business Brand Equity Ppt Inspiration Model Pdf
This slide showcases various metrics to measure brand equity value for business to increase company value. It includes key components such as type of metrics, key performance indicators and quarterly performance. Showcasing this set of slides titled Lead Metrics To Measure Business Brand Equity Ppt Inspiration Model Pdf. The topics addressed in these templates are Key Performance Indicators, Quarterly Performance, KPI. All the content presented in this PPT design is completely editable. Download it and make adjustments in color, background, font etc. as per your unique business setting. This slide showcases various metrics to measure brand equity value for business to increase company value. It includes key components such as type of metrics, key performance indicators and quarterly performance.

Key Metrics Used To Track Product Analytics Product Analytics Implementation Data Analytics V
This slide outlines major metrics used by businesses to analyse product performance aimed at making necessary improvements. It covers key metrics such as engagement, retention, customer lifetime value, number of crashes and feature adoption rate with benefits Do you know about Slidesgeeks Key Metrics Used To Track Product Analytics Product Analytics Implementation Data Analytics V These are perfect for delivering any kind od presentation. Using it, create PowerPoint presentations that communicate your ideas and engage audiences. Save time and effort by using our pre-designed presentation templates that are perfect for a wide range of topic. Our vast selection of designs covers a range of styles, from creative to business, and are all highly customizable and easy to edit. Download as a PowerPoint template or use them as Google Slides themes. This slide outlines major metrics used by businesses to analyse product performance aimed at making necessary improvements. It covers key metrics such as engagement, retention, customer lifetime value, number of crashes and feature adoption rate with benefits

Impact Of Blockchain Integration On Key Metrics Supply Chain Evolution Harnessing The Power BCT SS V
This slide depicts the positive impact integration of blockchain has on various metrics within supply chain ecosystem of an organization. It includes before and after analysis with relevant key insights. Create an editable Impact Of Blockchain Integration On Key Metrics Supply Chain Evolution Harnessing The Power BCT SS V that communicates your idea and engages your audience. Whether you are presenting a business or an educational presentation, pre-designed presentation templates help save time. Impact Of Blockchain Integration On Key Metrics Supply Chain Evolution Harnessing The Power BCT SS V is highly customizable and very easy to edit, covering many different styles from creative to business presentations. Slidegeeks has creative team members who have crafted amazing templates. So, go and get them without any delay. This slide depicts the positive impact integration of blockchain has on various metrics within supply chain ecosystem of an organization. It includes before and after analysis with relevant key insights.
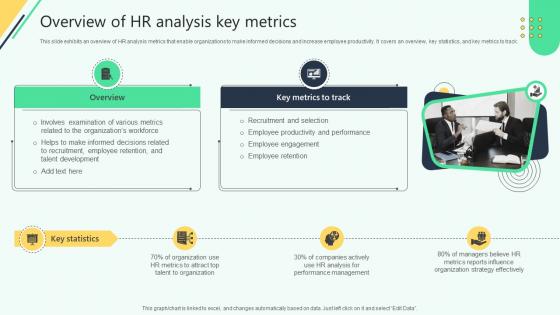
Overview Of Hr Analysis Key Metrics Analysing Hr Data For Effective Decision Making
This slide exhibits an overview of HR analysis metrics that enable organizations to make informed decisions and increase employee productivity. It covers an overview, key statistics, and key metrics to track. Slidegeeks is one of the best resources for PowerPoint templates. You can download easily and regulate Overview Of Hr Analysis Key Metrics Analysing Hr Data For Effective Decision Making for your personal presentations from our wonderful collection. A few clicks is all it takes to discover and get the most relevant and appropriate templates. Use our Templates to add a unique zing and appeal to your presentation and meetings. All the slides are easy to edit and you can use them even for advertisement purposes. This slide exhibits an overview of HR analysis metrics that enable organizations to make informed decisions and increase employee productivity. It covers an overview, key statistics, and key metrics to track.

Lead Metrics For Software Performance Testing Ppt Show Visual Aids Pdf
This slide highlights various key performance indicators to track and calculate product success in market. It includes key metrics such as net promoter score, client retention rate, active user percentage, customer lifetime value and churn rate. Showcasing this set of slides titled Lead Metrics For Software Performance Testing Ppt Show Visual Aids Pdf. The topics addressed in these templates are Client Retention Rate, Active User Percentage, Customer Lifetime. All the content presented in this PPT design is completely editable. Download it and make adjustments in color, background, font etc. as per your unique business setting. This slide highlights various key performance indicators to track and calculate product success in market. It includes key metrics such as net promoter score, client retention rate, active user percentage, customer lifetime value and churn rate.
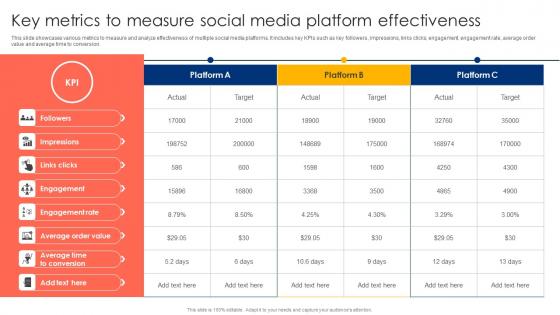
Key Metrics To Measure Social Media Platform Effectiveness Ppt Layouts Background Designs Pdf
This slide showcases various metrics to measure and analyze effectiveness of multiple social media platforms. It includes key KPIs such as key followers, impressions, links clicks, engagement, engagement rate, average order value and average time to conversion. Showcasing this set of slides titled Key Metrics To Measure Social Media Platform Effectiveness Ppt Layouts Background Designs Pdf. The topics addressed in these templates are Engagement, Engagement Rate, Average Order. All the content presented in this PPT design is completely editable. Download it and make adjustments in color, background, font etc. as per your unique business setting. This slide showcases various metrics to measure and analyze effectiveness of multiple social media platforms. It includes key KPIs such as key followers, impressions, links clicks, engagement, engagement rate, average order value and average time to conversion.
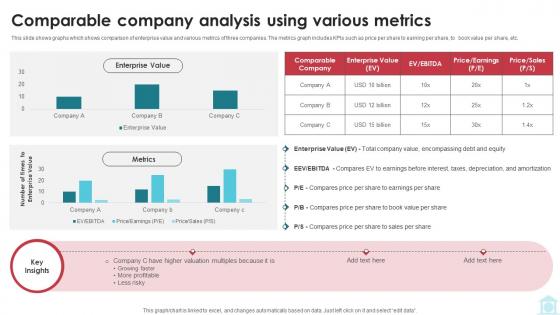
Comparable Company Analysis Using Various Metrics Mastering Investment Banking Fin SS V
This slide shows graphs which shows comparison of enterprise value and various metrics of three companies. The metrics graph includes KPIs such as price per share to earning per share, to book value per share, etc. Get a simple yet stunning designed Comparable Company Analysis Using Various Metrics Mastering Investment Banking Fin SS V It is the best one to establish the tone in your meetings. It is an excellent way to make your presentations highly effective. So, download this PPT today from Slidegeeks and see the positive impacts. Our easy-to-edit Comparable Company Analysis Using Various Metrics Mastering Investment Banking Fin SS V can be your go-to option for all upcoming conferences and meetings. So, what are you waiting for Grab this template today. This slide shows graphs which shows comparison of enterprise value and various metrics of three companies. The metrics graph includes KPIs such as price per share to earning per share, to book value per share, etc.
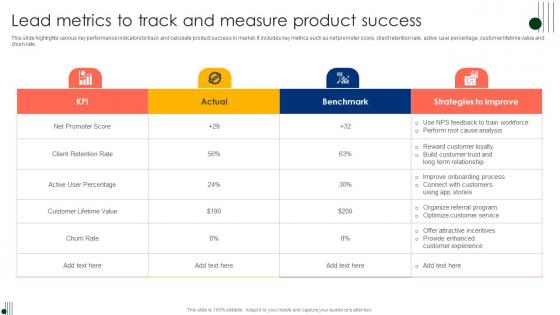
Lead Metrics To Track And Measure Product Success Ppt Visual Aids Ideas Pdf
This slide highlights various key performance indicators to track and calculate product success in market. It includes key metrics such as net promoter score, client retention rate, active user percentage, customer lifetime value and churn rate. Showcasing this set of slides titled Lead Metrics To Track And Measure Product Success Ppt Visual Aids Ideas Pdf. The topics addressed in these templates are Client Retention Rate, Active User Percentage, Customer Lifetime. All the content presented in this PPT design is completely editable. Download it and make adjustments in color, background, font etc. as per your unique business setting. This slide highlights various key performance indicators to track and calculate product success in market. It includes key metrics such as net promoter score, client retention rate, active user percentage, customer lifetime value and churn rate.
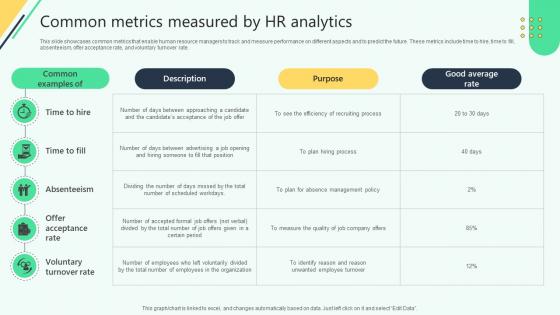
Common Metrics Measured By Hr Analytics Analysing Hr Data For Effective Decision Making
This slide showcases common metrics that enable human resource managers to track and measure performance on different aspects and to predict the future. These metrics include time to hire, time to fill,absenteeism, offer acceptance rate, and voluntary turnover rate. Slidegeeks is here to make your presentations a breeze with Common Metrics Measured By Hr Analytics Analysing Hr Data For Effective Decision Making With our easy-to-use and customizable templates, you can focus on delivering your ideas rather than worrying about formatting. With a variety of designs to choose from, you are sure to find one that suits your needs. And with animations and unique photos, illustrations, and fonts, you can make your presentation pop. So whether you are giving a sales pitch or presenting to the board, make sure to check out Slidegeeks first This slide showcases common metrics that enable human resource managers to track and measure performance on different aspects and to predict the future. These metrics include time to hire, time to fill,absenteeism, offer acceptance rate, and voluntary turnover rate.


 Continue with Email

 Home
Home


