Metrics Dashboard
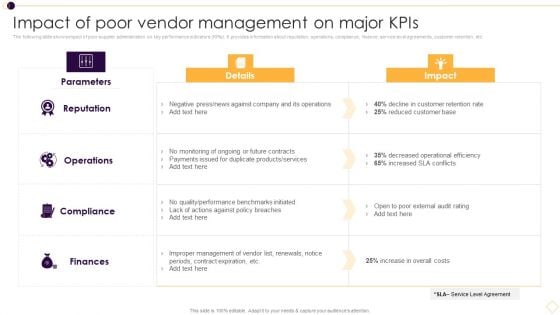
Supplier Management For Enhanced SCM And Procurement Impact Of Poor Vendor Management On Major Kpis Clipart PDF
The following slide shows impact of poor supplier administration on key performance indicators KPIs. It provides information about reputation, operations, compliance, finance, service level agreements, customer retention, etc. Deliver an awe inspiring pitch with this creative Supplier Management For Enhanced SCM And Procurement Impact Of Poor Vendor Management On Major Kpis Clipart PDF bundle. Topics like Quality Or Performance, Improper Management, Increase In Overall can be discussed with this completely editable template. It is available for immediate download depending on the needs and requirements of the user.
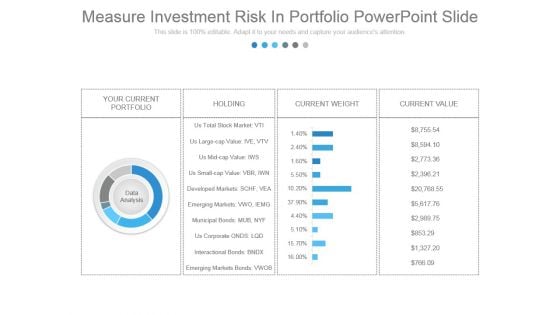
Measure Investment Risk In Portfolio Powerpoint Slide
This is a measure investment risk in portfolio powerpoint slide. This is a four stage process. The stages in this process are your current portfolio, holding, current weight, current value, data analysis, us total stock market vti, us large cap value ive vtv, us mid cap value iws, us small cap value vbr iwn, developed markets schf, vea, emerging markets vwo, iemg, municipal bonds mub, nyf, us corporate onds lqd, interactional bonds bndx, emerging markets bonds vwob.
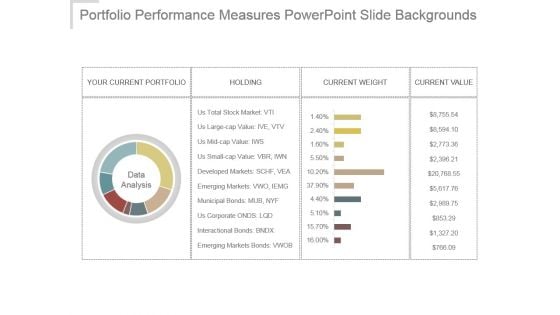
Portfolio Performance Measures Powerpoint Slide Backgrounds
This is a portfolio performance measures powerpoint slide backgrounds. This is a seven stage process. The stages in this process are your current portfolio, holding, current weight, current value, data analysis, us total stock market vti, us large cap value ive vtv, us mid cap value iws, us small cap value vbr iwn, developed markets schf vea, emerging markets vwo iemg, municipal bonds mub nyf, us corporate onds lqd, interactional bonds bndx, emerging markets bonds vwob.

Developing Data Collection Plan DMAIC Methodology To Maintain PPT Template
This slide shows introduction of measure phase in six sigma process improvement to measure quality performance of current workflow. It includes description and major goals, etc. Do you have an important presentation coming up Are you looking for something that will make your presentation stand out from the rest Look no further than Developing Data Collection Plan DMAIC Methodology To Maintain PPT Template. With our professional designs, you can trust that your presentation will pop and make delivering it a smooth process. And with Slidegeeks, you can trust that your presentation will be unique and memorable. So why wait Grab Developing Data Collection Plan DMAIC Methodology To Maintain PPT Template today and make your presentation stand out from the rest This slide shows introduction of measure phase in six sigma process improvement to measure quality performance of current workflow. It includes description and major goals, etc.
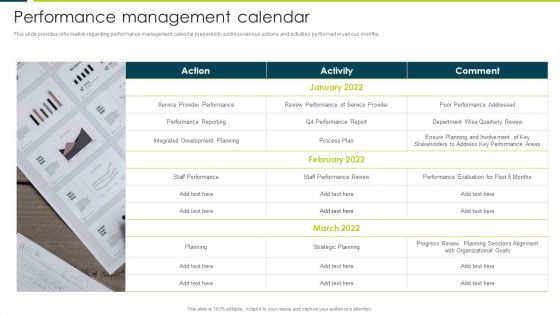
Employee Productivity Evaluation Across Company Performance Management Calendar Infographics PDF
This slide provides information regarding performance management calendar prepared to address various actions and activities performed in various months.Deliver and pitch your topic in the best possible manner with this Employee Productivity Evaluation Across Company Performance Management Calendar Infographics PDF. Use them to share invaluable insights on Performance Reporting, Integrated Development, Staff Performance and impress your audience. This template can be altered and modified as per your expectations. So, grab it now.
Social Network Playbook Social Media Kpi Analytics Measurement Ppt Icon Demonstration PDF
This template covers key performance indicator KPI to determine the performance against the company objectives. These Social media KPIs would be focusing on social engagements, content reach, purchase leads and conversions. Deliver an awe inspiring pitch with this creative social network playbook social media kpi analytics measurement ppt icon demonstration pdf bundle. Topics like social media kpi analytics measurement can be discussed with this completely editable template. It is available for immediate download depending on the needs and requirements of the user.

Brand Measurement Data Analysis Ppt PowerPoint Presentation Complete Deck With Slides
Improve your presentation delivery using this brand measurement data analysis ppt powerpoint presentation complete deck with slides. Support your business vision and objectives using this well-structured PPT deck. This template offers a great starting point for delivering beautifully designed presentations on the topic of your choice. Comprising fourteen this professionally designed template is all you need to host discussion and meetings with collaborators. Each slide is self-explanatory and equipped with high-quality graphics that can be adjusted to your needs. Therefore, you will face no difficulty in portraying your desired content using this PPT slideshow. This PowerPoint slideshow contains every important element that you need for a great pitch. It is not only editable but also available for immediate download and utilization. The color, font size, background, shapes everything can be modified to create your unique presentation layout. Therefore, download it now.
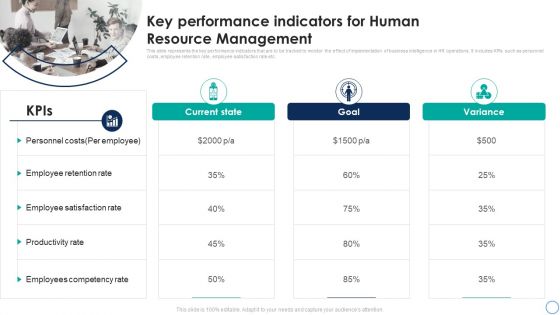
Business Analytics Application Key Performance Indicators For Human Resource Topics PDF
This slide represents the key performance indicators that are to be tracked to monitor the effect of implementation of business intelligence in HR operations. It includes KPIs such as personnel costs, employee retention rate, employee satisfaction rate etc. The Business Analytics Application Key Performance Indicators For Human Resource Topics PDF is a compilation of the most recent design trends as a series of slides. It is suitable for any subject or industry presentation, containing attractive visuals and photo spots for businesses to clearly express their messages. This template contains a variety of slides for the user to input data, such as structures to contrast two elements, bullet points, and slides for written information. Slidegeeks is prepared to create an impression.
Productivity Performance Ppt PowerPoint Presentation Infographic Template Graphics Download Cpb
Presenting this set of slides with name productivity performance ppt powerpoint presentation infographic template graphics download cpb. This is a two stage process. The stages in this process are productivity performance. This is a completely editable PowerPoint presentation and is available for immediate download. Download now and impress your audience.
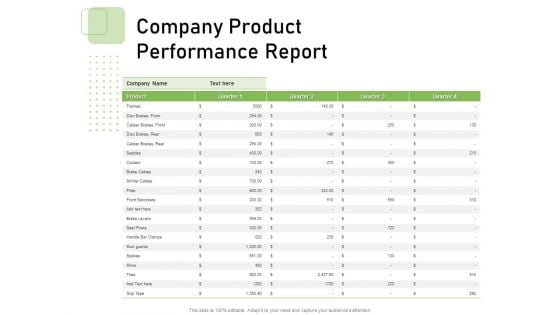
Company Product Performance Report Ppt PowerPoint Presentation Infographics Summary PDF
Presenting this set of slides with name company product performance report ppt powerpoint presentation infographics summary pdf. The topics discussed in these slides are product, quarter, performance report. This is a completely editable PowerPoint presentation and is available for immediate download. Download now and impress your audience.
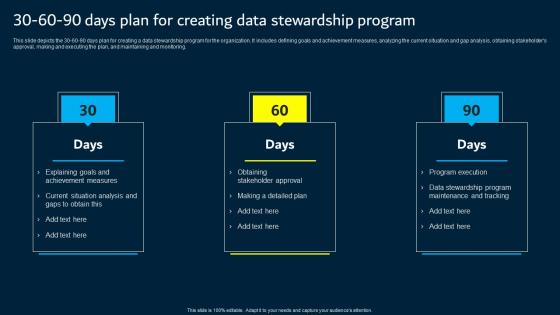
30 60 90 Days Plan For Creating Data Stewardship Program Data Custodianship Inspiration Pdf
This slide depicts the 30 60 90 days plan for creating a data stewardship program for the organization. It includes defining goals and achievement measures, analyzing the current situation and gap analysis, obtaining stakeholder s approval, making and executing the plan, and maintaining and monitoring. Do you have an important presentation coming up Are you looking for something that will make your presentation stand out from the rest Look no further than 30 60 90 Days Plan For Creating Data Stewardship Program Data Custodianship Inspiration Pdf. With our professional designs, you can trust that your presentation will pop and make delivering it a smooth process. And with Slidegeeks, you can trust that your presentation will be unique and memorable. So why wait Grab 30 60 90 Days Plan For Creating Data Stewardship Program Data Custodianship Inspiration Pdf today and make your presentation stand out from the rest This slide depicts the 30 60 90 days plan for creating a data stewardship program for the organization. It includes defining goals and achievement measures, analyzing the current situation and gap analysis, obtaining stakeholder s approval, making and executing the plan, and maintaining and monitoring.
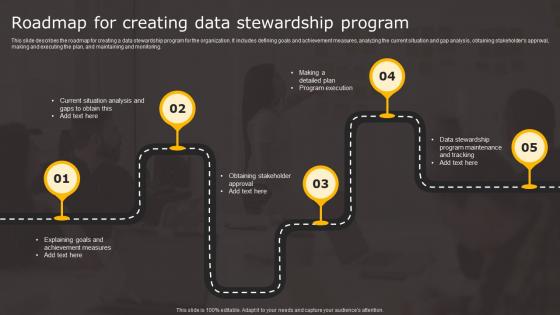
Data Stewardship In Business Processes Roadmap Creating Data Stewardship Infographics Pdf
This slide describes the roadmap for creating a data stewardship program for the organization. It includes defining goals and achievement measures, analyzing the current situation and gap analysis, obtaining stakeholders approval, making and executing the plan, and maintaining and monitoring. Crafting an eye catching presentation has never been more straightforward. Let your presentation shine with this tasteful yet straightforward Data Stewardship In Business Processes Roadmap Creating Data Stewardship Infographics Pdf template. It offers a minimalistic and classy look that is great for making a statement. The colors have been employed intelligently to add a bit of playfulness while still remaining professional. Construct the ideal Data Stewardship In Business Processes Roadmap Creating Data Stewardship Infographics Pdf that effortlessly grabs the attention of your audience Begin now and be certain to wow your customers This slide describes the roadmap for creating a data stewardship program for the organization. It includes defining goals and achievement measures, analyzing the current situation and gap analysis, obtaining stakeholders approval, making and executing the plan, and maintaining and monitoring.
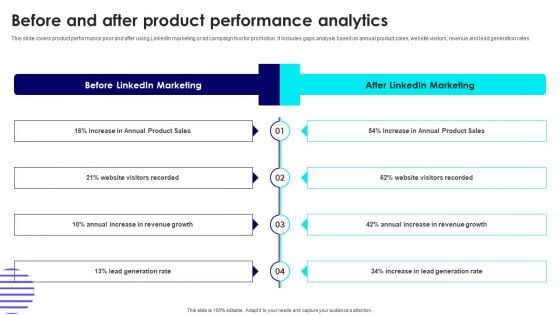
Before And After Product Performance Analytics Infographics PDF
This slide covers product performance prior and after using LinkedIn marketing or ad campaign tool for promotion. It includes gaps analysis based on annual product sales, website visitors, revenue and lead generation rates. Presenting this PowerPoint presentation, titled Before And After Product Performance Analytics Infographics PDF, with topics curated by our researchers after extensive research. This editable presentation is available for immediate download and provides attractive features when used. Download now and captivate your audience. Presenting this Before And After Product Performance Analytics Infographics PDF. Our researchers have carefully researched and created these slides with all aspects taken into consideration. This is a completely customizable Before And After Product Performance Analytics Infographics PDF that is available for immediate downloading. Download now and make an impact on your audience. Highlight the attractive features available with our PPTs.
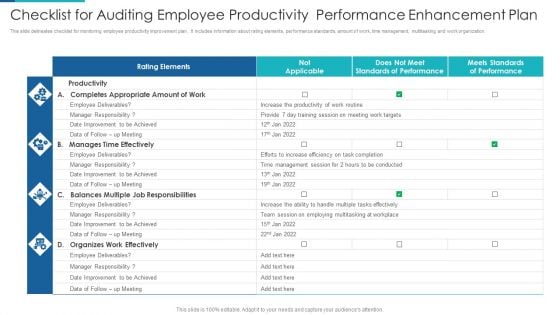
Checklist For Auditing Employee Productivity Performance Enhancement Plan Infographics PDF
This slide delineates checklist for monitoring employee productivity improvement plan . It includes information about rating elements, performance standards, amount of work, time management, multitasking and work organization. Showcasing this set of slides titled Checklist For Auditing Employee Productivity Performance Enhancement Plan Infographics PDF. The topics addressed in these templates are Productivity, Management, Team. All the content presented in this PPT design is completely editable. Download it and make adjustments in color, background, font etc. as per your unique business setting.
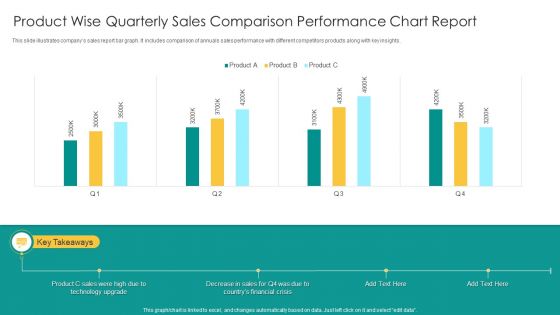
Product Wise Quarterly Sales Comparison Performance Chart Report Infographics PDF
This slide illustrates companys sales report bar graph. It includes comparison of annuals sales performance with different competitors products along with key insights. Showcasing this set of slides titled Product Wise Quarterly Sales Comparison Performance Chart Report Infographics PDF. The topics addressed in these templates are Product C Sales, Technology Upgrade, Financial Crisis. All the content presented in this PPT design is completely editable. Download it and make adjustments in color, background, font etc. as per your unique business setting.
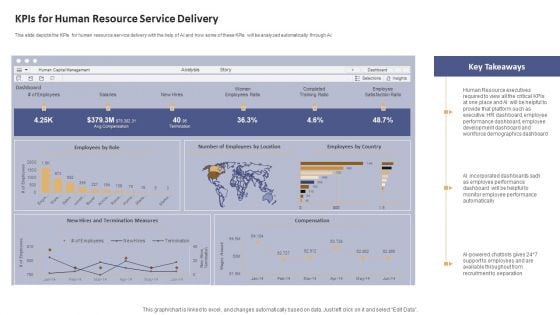
Data Processing Services Delivery Kpis For Human Resource Service Delivery Background PDF
This slide depicts the KPIs for human resource service delivery with the help of AI and how some of these KPIs will be analyzed automatically through AI. Deliver and pitch your topic in the best possible manner with this Data Processing Services Delivery Kpis For Human Resource Service Delivery Background PDF. Use them to share invaluable insights on Employees Role, Compensation, Employees Country and impress your audience. This template can be altered and modified as per your expectations. So, grab it now.
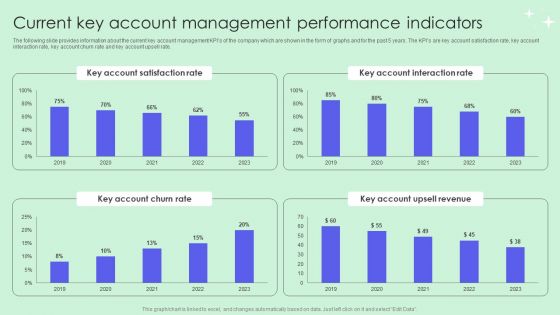
Current Key Account Management Performance Indicators Pictures PDF
The following slide provides information about the current key account management KPIs of the company which are shown in the form of graphs and for the past 5 years. The KPIs are key account satisfaction rate, key account interaction rate, key account churn rate and key account upsell rate. Are you in need of a template that can accommodate all of your creative concepts This one is crafted professionally and can be altered to fit any style. Use it with Google Slides or PowerPoint. Include striking photographs, symbols, depictions, and other visuals. Fill, move around, or remove text boxes as desired. Test out color palettes and font mixtures. Edit and save your work, or work with colleagues. Download Current Key Account Management Performance Indicators Pictures PDF and observe how to make your presentation outstanding. Give an impeccable presentation to your group and make your presentation unforgettable.

5 Kpis To Monitor And Track Network Service Assessment Information PDF
Mentioned slide outlines various kpis which can be used by IT reps to monitor network performance. The kpis mentioned in the template are latency, network jitter, packet loss, throughput and mean opinion score. It also covers information about objective, strategies implemented and actual performance of each kpis. Showcasing this set of slides titled 5 Kpis To Monitor And Track Network Service Assessment Information PDF. The topics addressed in these templates are Strategies Implemented, Network Security, Quality. All the content presented in this PPT design is completely editable. Download it and make adjustments in color, background, font etc. as per your unique business setting.
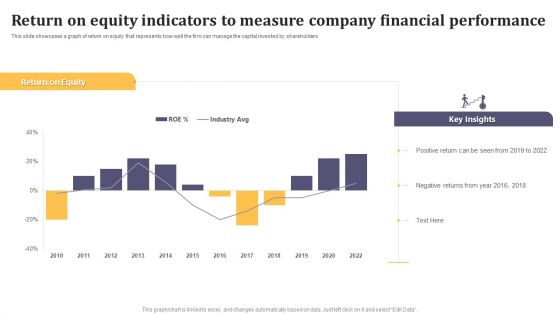
Return On Equity Indicators To Measure Company Financial Performance Mockup PDF
This slide showcases a graph of return on equity that represents how well the firm can manage the capital invested by shareholders. Pitch your topic with ease and precision using this Return On Equity Indicators To Measure Company Financial Performance Mockup PDF. This layout presents information on Return On Equity, Key Insights, Positive Return. It is also available for immediate download and adjustment. So, changes can be made in the color, design, graphics or any other component to create a unique layout.
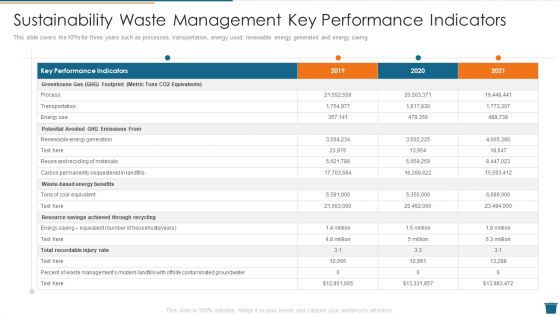
Sustainability Waste Management Key Performance Indicators Inspiration PDF
This slide covers the KPIs for three years such as processes, transportation, energy used, renewable energy generated and energy saving Deliver and pitch your topic in the best possible manner with this sustainability waste management key performance indicators inspiration pdf. Use them to share invaluable insights on recycling of materials, achieved, potential and impress your audience. This template can be altered and modified as per your expectations. So, grab it now.
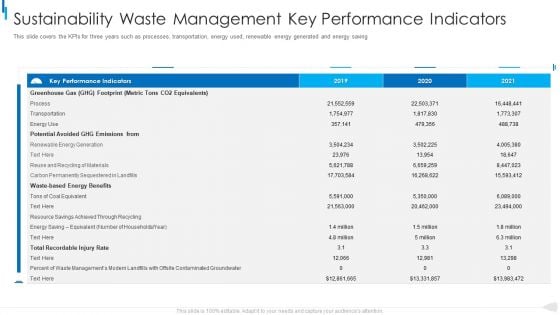
MSW Management Sustainability Waste Management Key Performance Indicators Download PDF
This slide covers the KPIs for three years such as processes, transportation, energy used, renewable energy generated and energy saving. Deliver and pitch your topic in the best possible manner with this MSW Management Sustainability Waste Management Key Performance Indicators Download Pdf. Use them to share invaluable insights on greenhouse, potential avoided, recordable and impress your audience. This template can be altered and modified as per your expectations. So, grab it now.
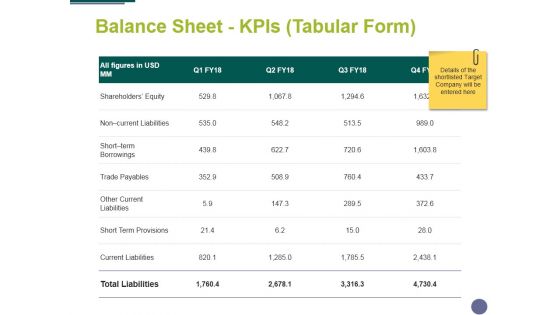
Balance Sheet Kpis Tabular Form Template 1 Ppt PowerPoint Presentation File Visual Aids
This is a balance sheet kpis tabular form template 1 ppt powerpoint presentation file visual aids. This is a four stage process balance sheet kpis tabular form template 1 ppt powerpoint presentation file visual aids. The stages in this process are business, management, compere, strategy, table.

Kpis Associated With IT Simplification Projects Ppt PowerPoint Presentation Professional Elements
Presenting this set of slides with name kpis associated with it simplification projects ppt powerpoint presentation professional elements. The topics discussed in these slides are customer required, time required, kpis associated. This is a completely editable PowerPoint presentation and is available for immediate download. Download now and impress your audience.
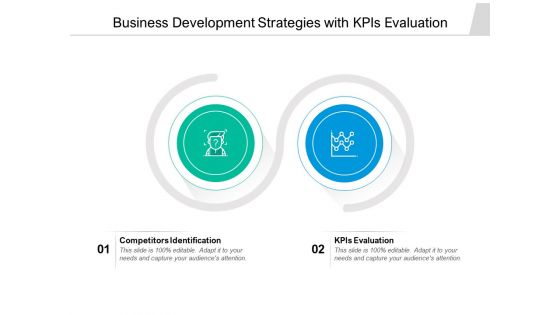
Business Development Strategies With Kpis Evaluation Ppt PowerPoint Presentation Layouts Example PDF
Presenting this set of slides with name business development strategies with kpis evaluation ppt powerpoint presentation layouts example pdf. This is a two stage process. The stages in this process are competitors identification, kpis evaluation. This is a completely editable PowerPoint presentation and is available for immediate download. Download now and impress your audience.

KPIS To Assess Business Performance Ppt PowerPoint Presentation File Themes PDF
Presenting this set of slides with name kpis to assess business performance ppt powerpoint presentation file themes pdf. This is a one stage process. The stage in this process is kpis to assess business performance. This is a completely editable PowerPoint presentation and is available for immediate download. Download now and impress your audience.
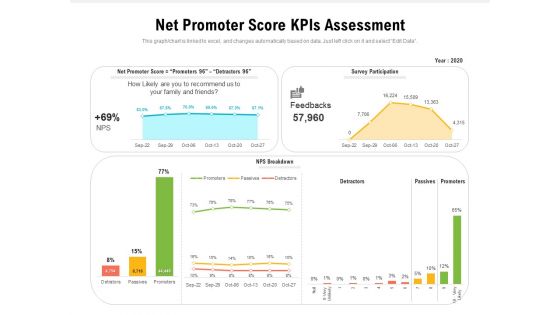
Net Promoter Score Kpis Assessment Ppt PowerPoint Presentation Gallery Slide PDF
Presenting this set of slides with name net promoter score kpis assessment ppt powerpoint presentation gallery slide pdf. The topics discussed in these slide is net promoter score kpis assessment. This is a completely editable PowerPoint presentation and is available for immediate download. Download now and impress your audience.
Digital Marketing Mobile Kpis With Success Rate Ppt PowerPoint Presentation Icon Layouts PDF
Showcasing this set of slides titled digital marketing mobile kpis with success rate ppt powerpoint presentation icon layouts pdf. The topics addressed in these templates are digital marketing mobile kpis with success rate. All the content presented in this PPT design is completely editable. Download it and make adjustments in color, background, font etc. as per your unique business setting.
Employee Kpis With Dollar Sign Vector Icon Ppt PowerPoint Presentation Model Clipart PDF
Presenting employee kpis with dollar sign vector icon ppt powerpoint presentation model clipart pdf to dispense important information. This template comprises one stages. It also presents valuable insights into the topics including employee kpis with dollar sign vector icon. This is a completely customizable PowerPoint theme that can be put to use immediately. So, download it and address the topic impactfully.
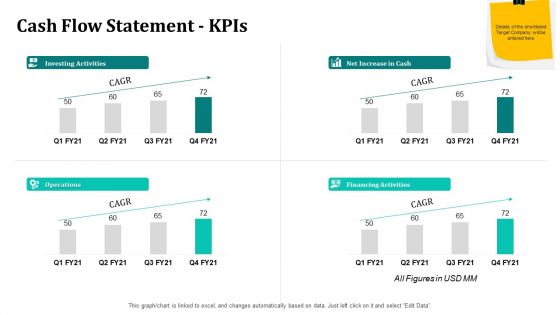
Merger And Acquisition Strategy For Inorganic Growth Cash Flow Statement Kpis Ppt Infographics Show PDF
Deliver an awe inspiring pitch with this creative merger and acquisition strategy for inorganic growth cash flow statement KPIs ppt infographics show pdf bundle. Topics like investing activities, net increase in cash, financing activities, operations, cash flow statement KPIs can be discussed with this completely editable template. It is available for immediate download depending on the needs and requirements of the user.
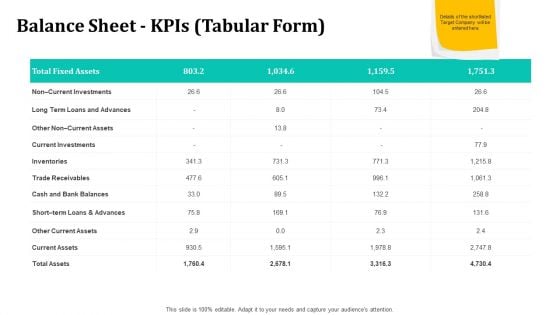
Merger And Acquisition Strategy For Inorganic Growth Balance Sheet Kpis Tabular Form Current Assets Ideas PDF
Deliver an awe inspiring pitch with this creative merger and acquisition strategy for inorganic growth balance sheet KPIs tabular form current assets ideas pdf bundle. Topics like current investments, long term loans and advances, current assets, balance sheet KPIs tabular form can be discussed with this completely editable template. It is available for immediate download depending on the needs and requirements of the user.
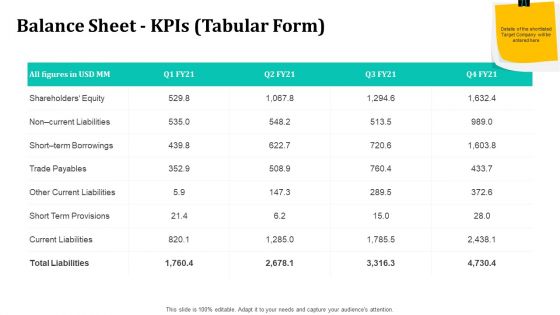
Merger And Acquisition Strategy For Inorganic Growth Balance Sheet Kpis Tabular Form Designs PDF
Deliver and pitch your topic in the best possible manner with this merger and acquisition strategy for inorganic growth balance sheet KPIs tabular form designs pdf. Use them to share invaluable insights on balance sheet KPIs tabular form and impress your audience. This template can be altered and modified as per your expectations. So, grab it now.
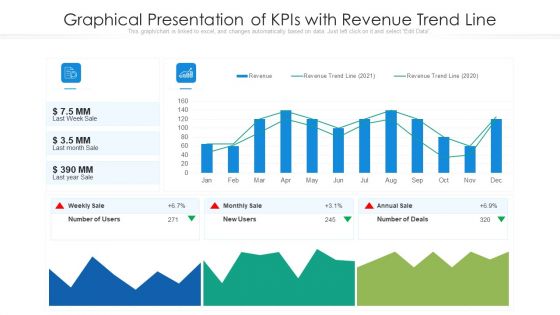
Graphical Presentation Of Kpis With Revenue Trend Line Ppt Inspiration Example Introduction PDF
Deliver and pitch your topic in the best possible manner with this graphical presentation of kpis with revenue trend line ppt inspiration example introduction pdf. Use them to share invaluable insights on graphical presentation of kpis with revenue trend line and impress your audience. This template can be altered and modified as per your expectations. So, grab it now.
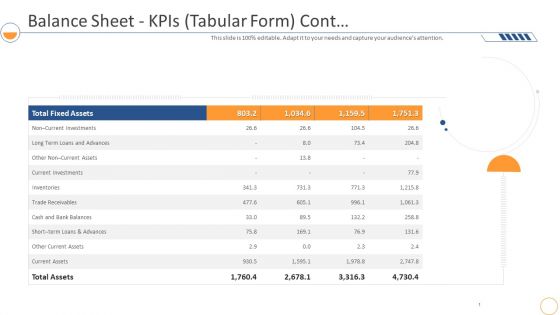
Monthly Company Performance Analysisbalance Sheet Kpis Tabular Form Cont Slides PDF
Deliver an awe inspiring pitch with this creative monthly company performance analysisbalance sheet kpis tabular form cont slides pdf bundle. Topics like balance sheet kpis tabular form can be discussed with this completely editable template. It is available for immediate download depending on the needs and requirements of the user.
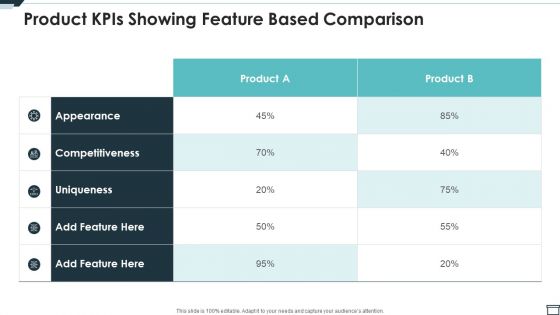
Product Kpis Showing Feature Based Comparison Ppt PowerPoint Presentation Gallery Layouts PDF
Pitch your topic with ease and precision using this product kpis showing feature based comparison ppt powerpoint presentation gallery layouts pdf. This layout presents information on product kpis showing feature based comparison. It is also available for immediate download and adjustment. So, changes can be made in the color, design, graphics or any other component to create a unique layout.
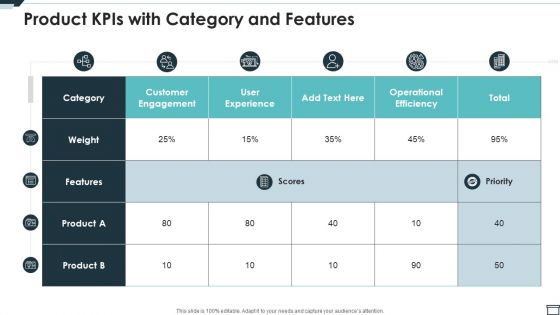
Product Kpis With Category And Features Ppt PowerPoint Presentation Gallery Templates PDF
Pitch your topic with ease and precision using this product kpis with category and features ppt powerpoint presentation gallery templates pdf. This layout presents information on product kpis with category and features. It is also available for immediate download and adjustment. So, changes can be made in the color, design, graphics or any other component to create a unique layout.
Agile Scrum Kpis Icon For Evidence Based Management Ppt Portfolio Slide Download PDF
Presenting Agile Scrum Kpis Icon For Evidence Based Management Ppt Portfolio Slide Download PDF to dispense important information. This template comprises one stages. It also presents valuable insights into the topics including Agile Scrum, Kpis Icon, Evidence Based Management. This is a completely customizable PowerPoint theme that can be put to use immediately. So, download it and address the topic impactfully.
Customer Success KPIS To Generate Revenue Icon Ppt PowerPoint Presentation Styles Slideshow PDF
Showcasing this set of slides titled Customer Success KPIS To Generate Revenue Icon Ppt PowerPoint Presentation Styles Slideshow PDF. The topics addressed in these templates are Customer Success, KPIs To Generate, Revenue Icon. All the content presented in this PPT design is completely editable. Download it and make adjustments in color, background, font etc. as per your unique business setting.

Kpis To Track The Performance Of Email Marketing Techniques Ppt PowerPoint Presentation Gallery Ideas PDF
Mentioned slide outlines various KPIs which can be used by the marketing department to analyze the performance of email marketing strategy. It covers information about KPIs such as click-through rate, conversion rate, bounce rate and list growth rate. Showcasing this set of slides titled kpis to track the performance of email marketing techniques ppt powerpoint presentation gallery ideas pdf. The topics addressed in these templates are conversion rate, bounce rate, list growth rate. All the content presented in this PPT design is completely editable. Download it and make adjustments in color, background, font etc. as per your unique business setting.
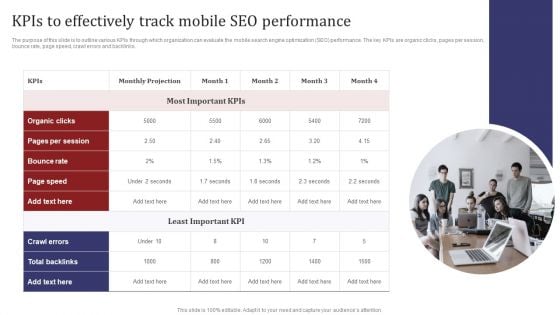
Mobile Search Engine Optimization Plan Kpis To Effectively Track Mobile SEO Performance Diagrams PDF
The purpose of this slide is to outline various KPIs through which organization can evaluate the mobile search engine optimization SEO performance. The key KPIs are organic clicks, pages per session, bounce rate, page speed, crawl errors and backlinks. There are so many reasons you need a Mobile Search Engine Optimization Plan Kpis To Effectively Track Mobile SEO Performance Diagrams PDF. The first reason is you can not spend time making everything from scratch, Thus, Slidegeeks has made presentation templates for you too. You can easily download these templates from our website easily.
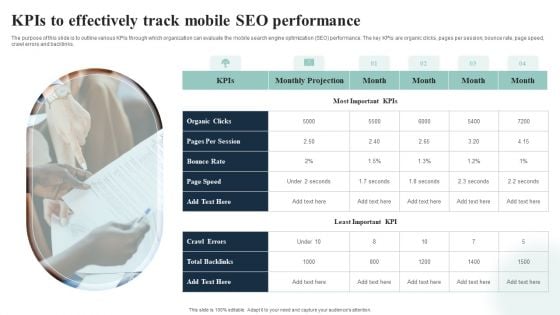
Introduction To Mobile SEM Kpis To Effectively Track Mobile SEO Performance Information PDF
The purpose of this slide is to outline various KPIs through which organization can evaluate the mobile search engine optimization SEO performance. The key KPIs are organic clicks, pages per session, bounce rate, page speed, crawl errors and backlinks. From laying roadmaps to briefing everything in detail, our templates are perfect for you. You can set the stage with your presentation slides. All you have to do is download these easy to edit and customizable templates. Introduction To Mobile SEM Kpis To Effectively Track Mobile SEO Performance Information PDF will help you deliver an outstanding performance that everyone would remember and praise you for. Do download this presentation today.
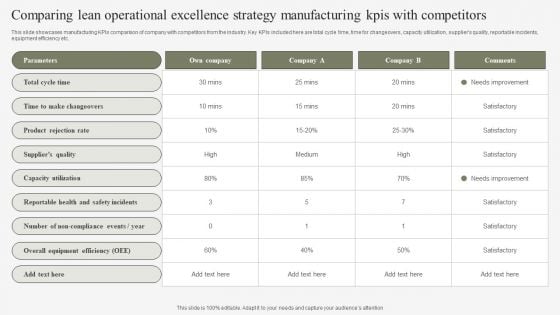
Comparing Lean Operational Excellence Strategy Manufacturing Kpis With Competitors Mockup PDF
This slide showcases manufacturing KPIs comparison of company with competitors from the industry. Key KPIs included here are total cycle time, time for changeovers, capacity utilization, suppliers quality, reportable incidents, equipment efficiency etc. Pitch your topic with ease and precision using this Comparing Lean Operational Excellence Strategy Manufacturing Kpis With Competitors Mockup PDF. This layout presents information on Parameters, Rejection Rate, Quality. It is also available for immediate download and adjustment. So, changes can be made in the color, design, graphics or any other component to create a unique layout.
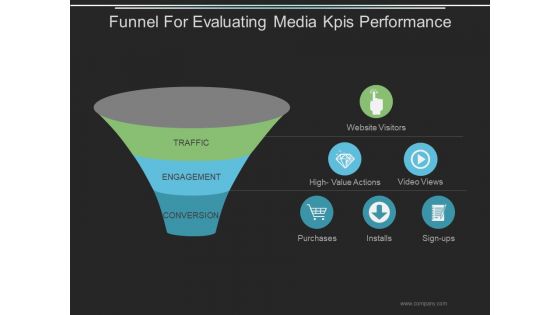
Funnel For Evaluating Media Kpis Performance Ppt PowerPoint Presentation Design Templates
This is a funnel for evaluating media kpis performance ppt powerpoint presentation design templates. This is a three stage process. The stages in this process are business, marketing, funnel, purchase, management.
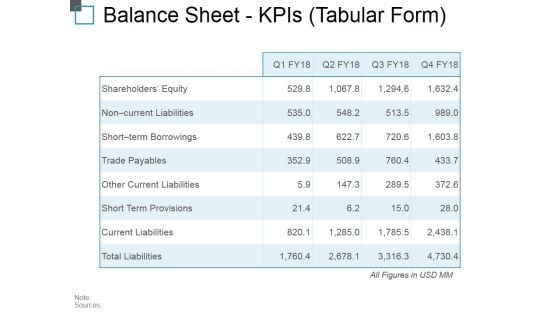
Balance Sheet Kpis Tabular Form Ppt PowerPoint Presentation Outline Background Image
This is a balance sheet kpis tabular form ppt powerpoint presentation outline background image. This is a four stage process. The stages in this process are current assets, current liabilities, total assets, total liabilities.
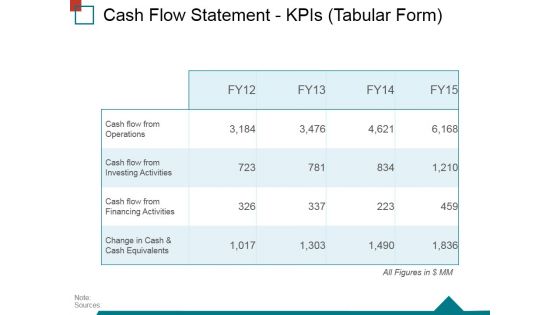
Cash Flow Statement Kpis Tabular Form Ppt PowerPoint Presentation Gallery Good
This is a cash flow statement kpis tabular form ppt powerpoint presentation gallery good. This is a four stage process. The stages in this process are operations, financing activities, investing activities, net increase in cash.

Balance Sheet Kpis Template 1 Ppt PowerPoint Presentation Ideas Master Slide
This is a balance sheet kpis template 1 ppt powerpoint presentation ideas master slide. This is a four stage process. The stages in this process are shareholders equity, non current liabilities, short term borrowings, trade payables, other current liabilities.
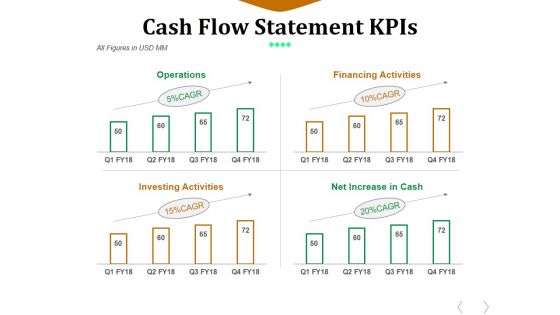
Cash Flow Statement Kpis Template 1 Ppt PowerPoint Presentation Outline Deck
This is a cash flow statement kpis template 1 ppt powerpoint presentation outline deck. This is a four stage process. The stages in this process are operations, financing activities, investing activities, net increase in cash.
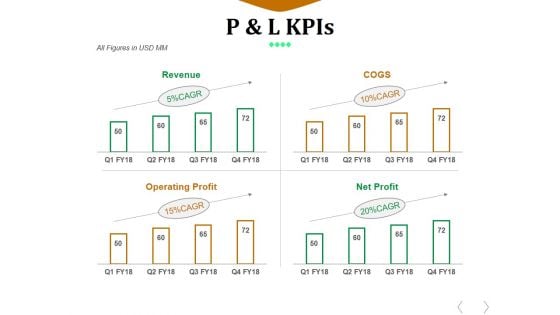
P And L Kpis Template 1 Ppt PowerPoint Presentation Design Ideas
This is a p and l kpis template 1 ppt powerpoint presentation design ideas. This is a four stage process. The stages in this process are revenue, cogs, operating profit, net profit.
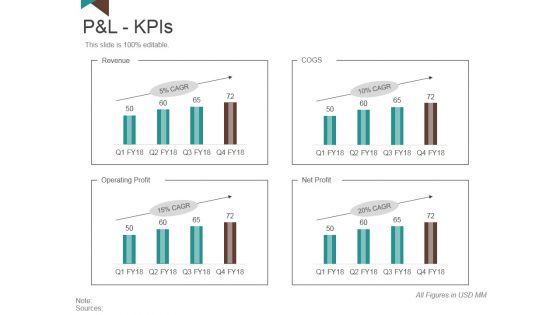
P And L Kpis Template 1 Ppt PowerPoint Presentation Slides Model
This is a p and l kpis template 1 ppt powerpoint presentation slides model. This is a four stage process. The stages in this process are revenue, operating profit, net profit, cogs.
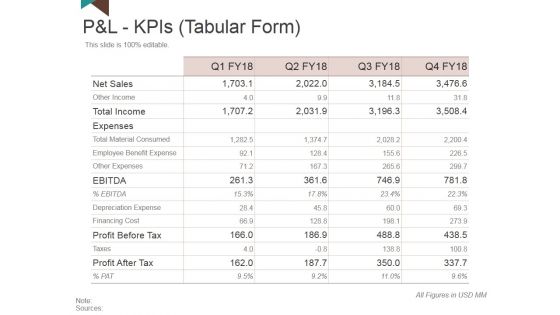
P And L Kpis Template 2 Ppt PowerPoint Presentation Outline Clipart
This is a p and l kpis template 2 ppt powerpoint presentation outline clipart. This is a four stage process. The stages in this process are net sales, total income, expenses, profit before tax, profit after tax.
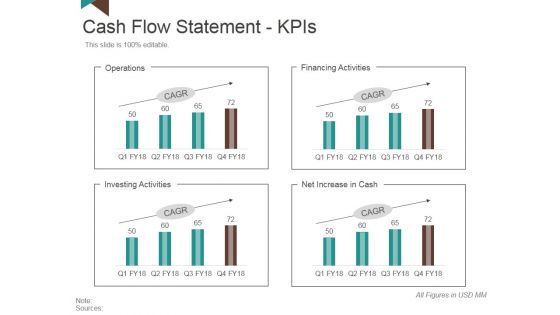
Cash Flow Statement Kpis Template 2 Ppt PowerPoint Presentation Layouts Skills
This is a cash flow statement kpis template 2 ppt powerpoint presentation layouts skills. This is a four stage process. The stages in this process are operations, financing activities, net increase in cash, investing activities.

Cash Flow Statement Kpis Tabular Form Ppt PowerPoint Presentation Infographics File Formats
This is a cash flow statement kpis tabular form ppt powerpoint presentation infographics file formats. This is a four stage process. The stages in this process are operations, investing activities, financing activities, net increase in cash.
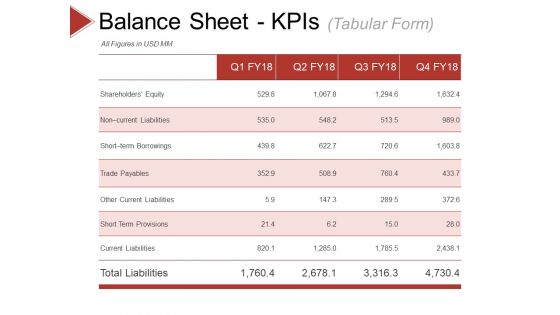
Balance Sheet Kpis Template 2 Ppt PowerPoint Presentation Visual Aids Ideas
This is a balance sheet kpis template 2 ppt powerpoint presentation visual aids ideas. This is a four stage process. The stages in this process are shareholders equity, trade payables, other current liabilities, short term provisions, current liabilities.
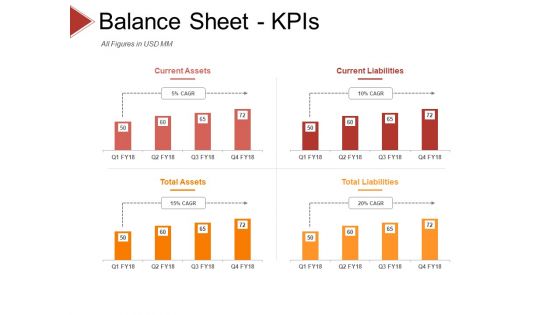
Balance Sheet Kpis Template 3 Ppt PowerPoint Presentation Professional Graphics Design
This is a balance sheet kpis template 3 ppt powerpoint presentation professional graphics design. This is a four stage process. The stages in this process are current assets, current liabilities, total assets, total liabilities.
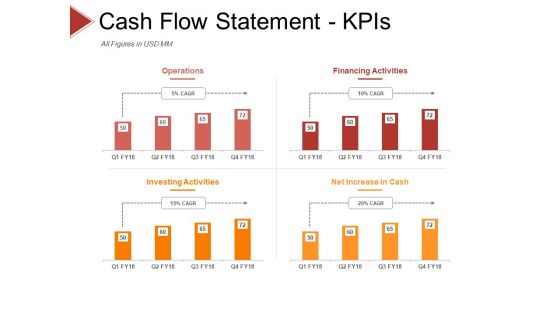
Cash Flow Statement Kpis Template 1 Ppt PowerPoint Presentation Pictures Microsoft
This is a cash flow statement kpis template 1 ppt powerpoint presentation pictures microsoft. This is a four stage process. The stages in this process are operations, financing activities, investing activities, net increase in cash.
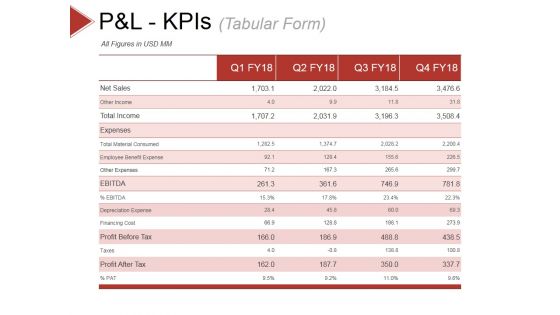
P And L Kpis Template 1 Ppt PowerPoint Presentation Slides Show
This is a p and l kpis template 1 ppt powerpoint presentation slides show. This is a four stage process. The stages in this process are other income, total income, expenses, other expenses, depreciation expense.
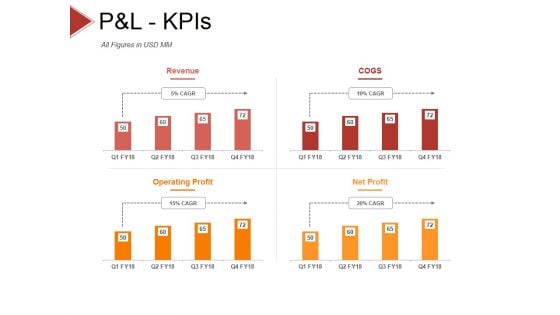
P And L Kpis Template 2 Ppt PowerPoint Presentation Styles Objects
This is a p and l kpis template 2 ppt powerpoint presentation styles objects. This is a four stage process. The stages in this process are revenue, cogs, operating profit, net profit.
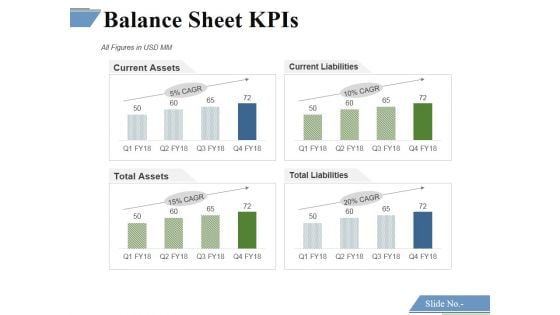
Balance Sheet Kpis Template 1 Ppt PowerPoint Presentation Styles Layout Ideas
This is a balance sheet kpis template 1 ppt powerpoint presentation styles layout ideas. This is a four stage process. The stages in this process are current assets, current liabilities, total assets, total liabilities.
Cash Flow Statement Kpis Template 1 Ppt PowerPoint Presentation Icon Elements
This is a cash flow statement kpis template 1 ppt powerpoint presentation icon elements. This is a four stage process. The stages in this process are operations, financing activities, investing activities, net increase in cash.

P And L Kpis Template 1 Ppt PowerPoint Presentation Model Inspiration
This is a p and l kpis template 1 ppt powerpoint presentation model inspiration. This is a four stage process. The stages in this process are revenue, cogs, operating profit, net profit.
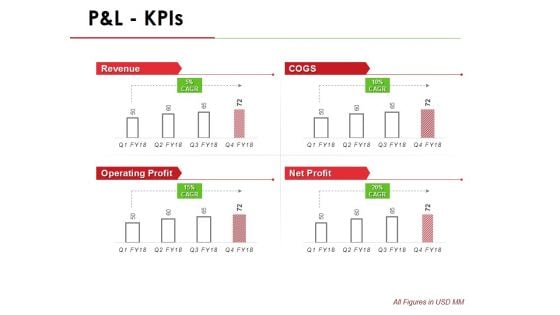
P And L Kpis Template 1 Ppt PowerPoint Presentation Infographic Template Outline
This is a p and l kpis template 1 ppt powerpoint presentation infographic template outline. This is a four stage process. The stages in this process are revenue, operating profit, cogs, net profit.


 Continue with Email

 Home
Home


