Metrics Dashboard
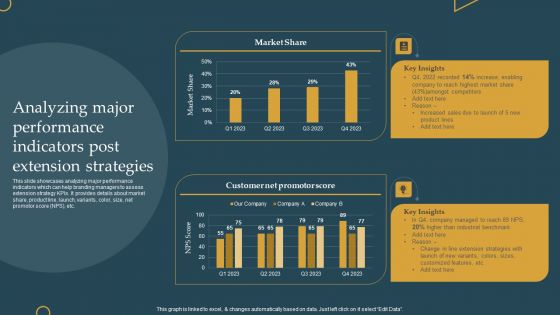
Advertising New Commodities Through Analyzing Major Performance Indicators Post Download PDF
This slide showcases analyzing major performance indicators which can help branding managers to assess extension strategy KPIs. It provides details about market share, product line, launch, variants, color, size, net promotor score NPS, etc. Boost your pitch with our creative Advertising New Commodities Through Analyzing Major Performance Indicators Post Download PDF. Deliver an awe-inspiring pitch that will mesmerize everyone. Using these presentation templates you will surely catch everyones attention. You can browse the ppts collection on our website. We have researchers who are experts at creating the right content for the templates. So you dont have to invest time in any additional work. Just grab the template now and use them.
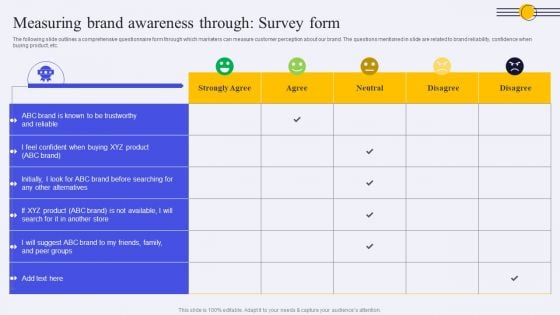
Measuring Brand Awareness Through Survey Form Ppt PowerPoint Presentation Diagram Lists PDF
The following slide outlines a comprehensive questionnaire form through which marketers can measure customer perception about our brand. The questions mentioned in slide are related to brand reliability, confidence when buying product, etc. The Measuring Brand Awareness Through Survey Form Ppt PowerPoint Presentation Diagram Lists PDF is a compilation of the most recent design trends as a series of slides. It is suitable for any subject or industry presentation, containing attractive visuals and photo spots for businesses to clearly express their messages. This template contains a variety of slides for the user to input data, such as structures to contrast two elements, bullet points, and slides for written information. Slidegeeks is prepared to create an impression.

Project Management Outline For Schedule Performance Index Need Of Project Improvement In The Company Infographics PDF
This slide provides the glimpse about the need of project improvement within the company such as increasing productivity and efficiency, faster time to market, employee morale, product quality, customer satisfaction and loyalty, and competitive advantage. This is a project management outline for schedule performance index need of project improvement in the company infographics pdf template with various stages. Focus and dispense information on six stages using this creative set, that comes with editable features. It contains large content boxes to add your information on topics like improved employee morale, competitive advantage, improved product quality, faster time to market, increase productivity and efficiency. You can also showcase facts, figures, and other relevant content using this PPT layout. Grab it now.
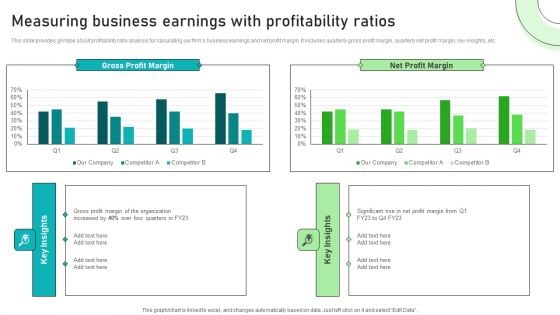
Adjusting Financial Strategies And Planning Measuring Business Earnings With Profitability Ratios Download PDF
This slide provides glimpse about profitability ratio analysis for calculating our firms business earnings and net profit margin. It includes quarterly gross profit margin, quarterly net profit margin, key insights, etc. The Adjusting Financial Strategies And Planning Measuring Business Earnings With Profitability Ratios Download PDF is a compilation of the most recent design trends as a series of slides. It is suitable for any subject or industry presentation, containing attractive visuals and photo spots for businesses to clearly express their messages. This template contains a variety of slides for the user to input data, such as structures to contrast two elements, bullet points, and slides for written information. Slidegeeks is prepared to create an impression.
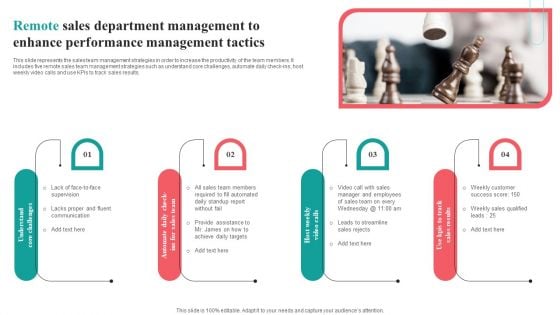
Remote Sales Department Management To Enhance Performance Management Tactics Template PDF
This slide represents the sales team management strategies in order to increase the productivity of the team members. It includes five remote sales team management strategies such as understand core challenges, automate daily check-ins, host weekly video calls and use KPIs to track sales results.Persuade your audience using this Remote Sales Department Management To Enhance Performance Management Tactics Template PDF. This PPT design covers one stage, thus making it a great tool to use. It also caters to a variety of topics including Fluent Communication, Required Automated, Manager Employees. Download this PPT design now to present a convincing pitch that not only emphasizes the topic but also showcases your presentation skills.
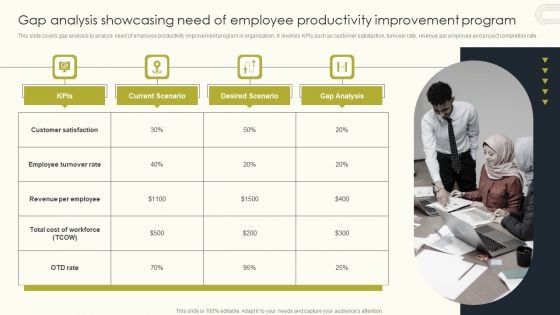
Employee Performance Management To Enhance Organizational Growth Gap Analysis Showcasing Need Of Employee Professional PDF
This slide covers gap analysis to analyze need of employee productivity improvement program in organization . It involves KPIs such as customer satisfaction, turnover rate, revenue per employee and project completion rate. Make sure to capture your audiences attention in your business displays with our gratis customizable Employee Performance Management To Enhance Organizational Growth Gap Analysis Showcasing Need Of Employee Professional PDF. These are great for business strategies, office conferences, capital raising or task suggestions. If you desire to acquire more customers for your tech business and ensure they stay satisfied, create your own sales presentation with these plain slides.
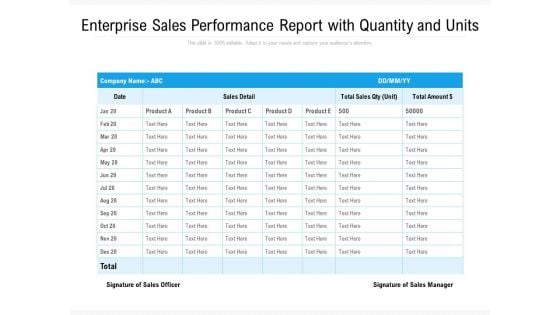
Enterprise Sales Performance Report With Quantity And Units Ppt PowerPoint Presentation Summary Vector PDF
Presenting this set of slides with name enterprise sales performance report with quantity and units ppt powerpoint presentation summary vector pdf. The topics discussed in these slides are sales detail, product, performance, total sales qty unit, total amount. This is a completely editable PowerPoint presentation and is available for immediate download. Download now and impress your audience.
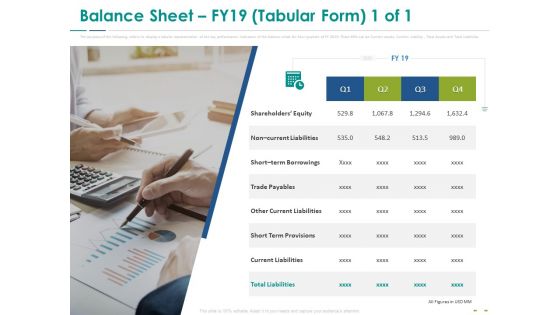
Stock Market Research Report Balance Sheet FY19 Tabular Form Equity Information PDF
The purpose of the following slide is to display the key performance indicators of the balance sheet for four quarters of FY 2019. These KPIs can be Current assets, Current Liability , Total Assets and Total Liabilities. Presenting stock market research report balance sheet fy19 tabular form equity information pdf to provide visual cues and insights. Share and navigate important information on one stages that need your due attention. This template can be used to pitch topics like non current liabilities, short term borrowings, trade payables, other current liabilities, short term provisions. In addition, this PPT design contains high-resolution images, graphics, etc, that are easily editable and available for immediate download.
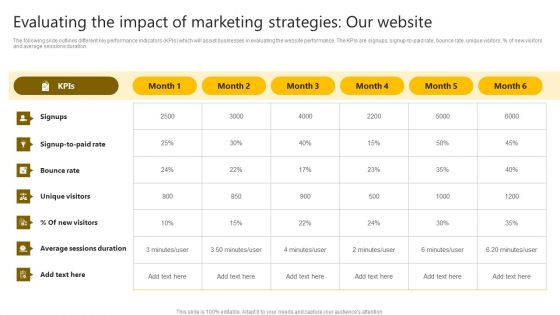
Brand Improvement Techniques To Build Consumer Loyalty Evaluating The Impact Marketing Strategies Ideas PDF
The following slide outlines different key performance indicators KPIs which will assist businesses in evaluating the website performance. The KPIs are signups, signup to paid rate, bounce rate, unique visitors, percent of new visitors and average sessions duration. The Brand Improvement Techniques To Build Consumer Loyalty Evaluating The Impact Marketing Strategies Ideas PDF is a compilation of the most recent design trends as a series of slides. It is suitable for any subject or industry presentation, containing attractive visuals and photo spots for businesses to clearly express their messages. This template contains a variety of slides for the user to input data, such as structures to contrast two elements, bullet points, and slides for written information. Slidegeeks is prepared to create an impression.
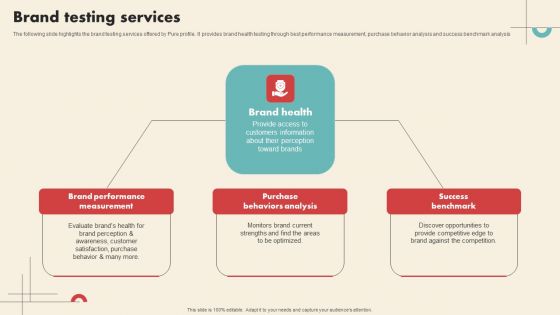
Data Driven Marketing Solutions Firm Company Profile Brand Testing Services Structure PDF
The following slide highlights the brand testing services offered by Pure profile. It provides brand health testing through best performance measurement, purchase behavior analysis and success benchmark analysis Create an editable Data Driven Marketing Solutions Firm Company Profile Brand Testing Services Structure PDF that communicates your idea and engages your audience. Whether youre presenting a business or an educational presentation, pre designed presentation templates help save time. Data Driven Marketing Solutions Firm Company Profile Brand Testing Services Structure PDF is highly customizable and very easy to edit, covering many different styles from creative to business presentations. Slidegeeks has creative team members who have crafted amazing templates. So, go and get them without any delay.
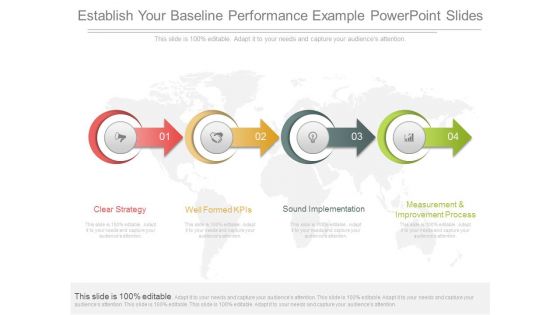
Establish Your Baseline Performance Example Powerpoint Slides
This is a establish your baseline performance example powerpoint slides. This is a four stage process. The stages in this process are clear strategy, well formed kpis, sound implementation, measurement and improvement process.
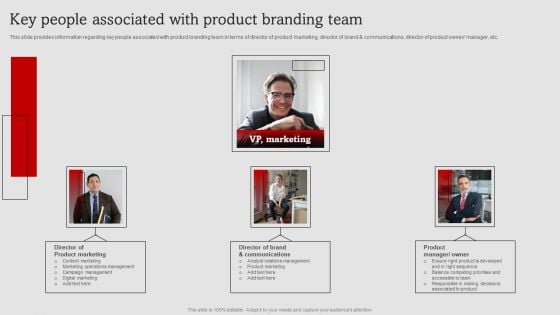
Umbrella Branding Measures To Boost Brand Awareness Key People Associated With Product Branding Team Clipart PDF
This slide provides information regarding key people associated with product branding team in terms of director of product marketing, director of brand and communications, director of product owner manager, etc. The Umbrella Branding Measures To Boost Brand Awareness Key People Associated With Product Branding Team Clipart PDF is a compilation of the most recent design trends as a series of slides. It is suitable for any subject or industry presentation, containing attractive visuals and photo spots for businesses to clearly express their messages. This template contains a variety of slides for the user to input data, such as structures to contrast two elements, bullet points, and slides for written information. Slidegeeks is prepared to create an impression.
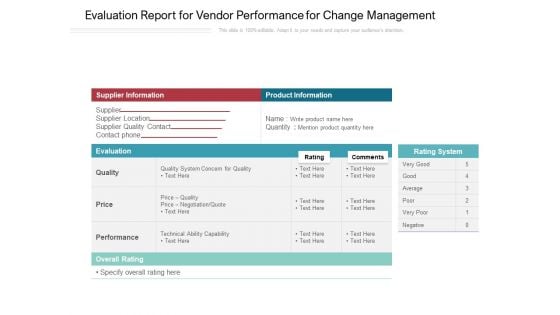
Evaluation Report For Vendor Performance For Change Management Ppt PowerPoint Presentation Infographics Gallery PDF
Pitch your topic with ease and precision using this evaluation report for vendor performance for change management ppt powerpoint presentation infographics gallery pdf. This layout presents information on supplier information, product information, evaluation, price, quality, performance. It is also available for immediate download and adjustment. So, changes can be made in the color, design, graphics or any other component to create a unique layout.
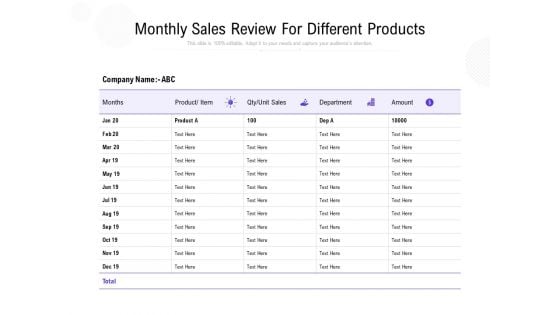
Sample Report Of Sales Performance Ppt PowerPoint Presentation Portfolio Background Image PDF
Presenting this set of slides with name sample report of sales performance ppt powerpoint presentation portfolio background image pdf. The topics discussed in these slides are months, product item, qty unit sales, department, amount. This is a completely editable PowerPoint presentation and is available for immediate download. Download now and impress your audience.
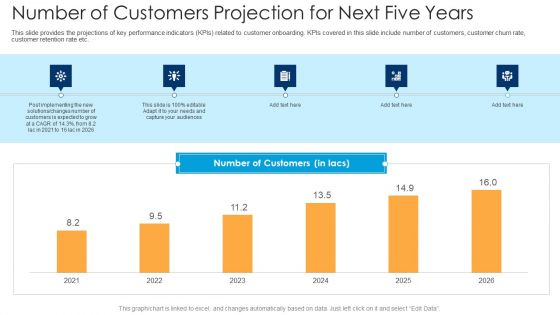
Number Of Customers Projection For Next Five Years Ppt Infographics Format PDF
This slide provides the projections of key performance indicators KPIs related to customer onboarding. KPIs covered in this slide include number of customers, customer churn rate, customer retention rate etc. Deliver and pitch your topic in the best possible manner with this number of customers projection for next five years ppt infographics format pdf. Use them to share invaluable insights on number of customers projection for next five years and impress your audience. This template can be altered and modified as per your expectations. So, grab it now.
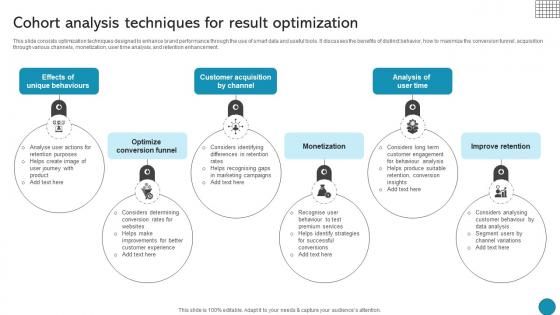
Cohort Analysis Techniques For Result Optimization Driving Business Success Integrating Product
This slide consists optimization techniques designed to enhance brand performance through the use of smart data and useful tools. It discusses the benefits of distinct behavior, how to maximize the conversion funnel, acquisition through various channels, monetization, user time analysis, and retention enhancement. Whether you have daily or monthly meetings, a brilliant presentation is necessary. Cohort Analysis Techniques For Result Optimization Driving Business Success Integrating Product can be your best option for delivering a presentation. Represent everything in detail using Cohort Analysis Techniques For Result Optimization Driving Business Success Integrating Product and make yourself stand out in meetings. The template is versatile and follows a structure that will cater to your requirements. All the templates prepared by Slidegeeks are easy to download and edit. Our research experts have taken care of the corporate themes as well. So, give it a try and see the results. This slide consists optimization techniques designed to enhance brand performance through the use of smart data and useful tools. It discusses the benefits of distinct behavior, how to maximize the conversion funnel, acquisition through various channels, monetization, user time analysis, and retention enhancement.

Optimizing Logistics Management Process Key Points To Measure Logistics Performance Formats PDF
This slide shows the key points to measure logistics performance which includes logistics activities, how will it help the company and suggestions. Presenting optimizing logistics management process key points to measure logistics performance formats pdf to provide visual cues and insights. Share and navigate important information on two stages that need your due attention. This template can be used to pitch topics like training to staff, technology adoption, inventory management, data and predictive analytics. In addtion, this PPT design contains high resolution images, graphics, etc, that are easily editable and available for immediate download.
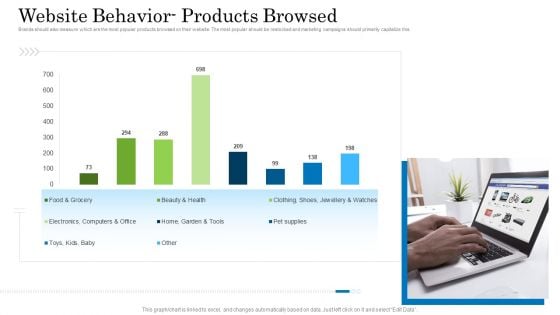
Customer Behavioral Data And Analytics Website Behavior Products Browsed Slides PDF
Brands should also measure which are the most popular products browsed on their website. The most popular should be restocked and marketing campaigns should primarily capitalize this. Deliver an awe inspiring pitch with this creative customer behavioral data and analytics website behavior products browsed slides pdf bundle. Topics like website behavior products browsed can be discussed with this completely editable template. It is available for immediate download depending on the needs and requirements of the user.
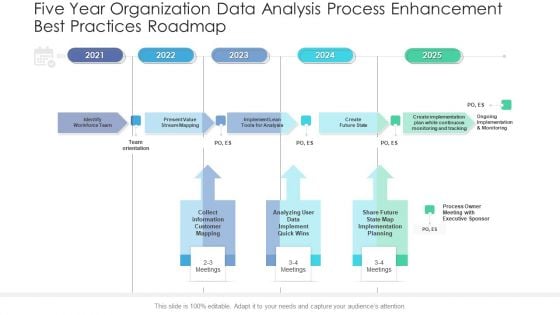
Five Year Organization Data Analysis Process Enhancement Best Practices Roadmap Rules
Presenting our innovatively structured five year organization data analysis process enhancement best practices roadmap rules Template. Showcase your roadmap process in different formats like PDF, PNG, and JPG by clicking the download button below. This PPT design is available in both Standard Screen and Widescreen aspect ratios. It can also be easily personalized and presented with modified font size, font type, color, and shapes to measure your progress in a clear way.
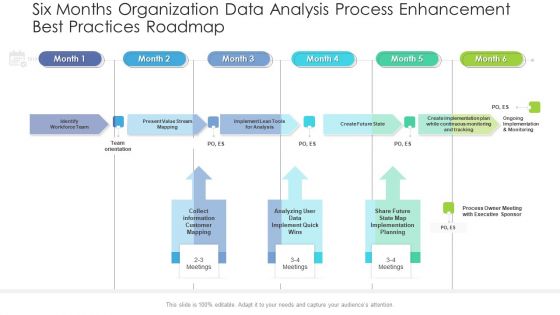
Six Months Organization Data Analysis Process Enhancement Best Practices Roadmap Inspiration
Presenting our innovatively structured six months organization data analysis process enhancement best practices roadmap inspiration Template. Showcase your roadmap process in different formats like PDF, PNG, and JPG by clicking the download button below. This PPT design is available in both Standard Screen and Widescreen aspect ratios. It can also be easily personalized and presented with modified font size, font type, color, and shapes to measure your progress in a clear way.
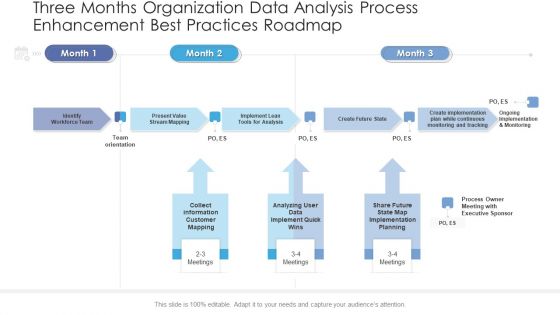
Three Months Organization Data Analysis Process Enhancement Best Practices Roadmap Portrait
Presenting our innovatively structured three months organization data analysis process enhancement best practices roadmap portrait Template. Showcase your roadmap process in different formats like PDF, PNG, and JPG by clicking the download button below. This PPT design is available in both Standard Screen and Widescreen aspect ratios. It can also be easily personalized and presented with modified font size, font type, color, and shapes to measure your progress in a clear way.
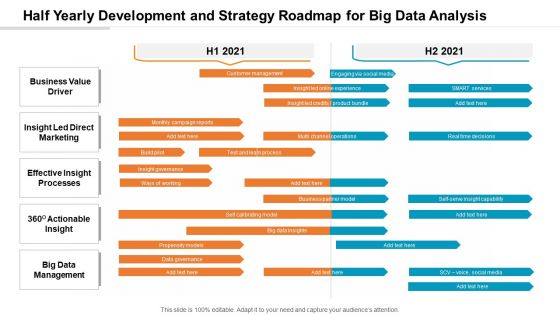
Half Yearly Development And Strategy Roadmap For Big Data Analysis Ideas
Presenting our innovatively-structured half yearly development and strategy roadmap for big data analysis ideas Template. Showcase your roadmap process in different formats like PDF, PNG, and JPG by clicking the download button below. This PPT design is available in both Standard Screen and Widescreen aspect ratios. It can also be easily personalized and presented with modified font size, font type, color, and shapes to measure your progress in a clear way.
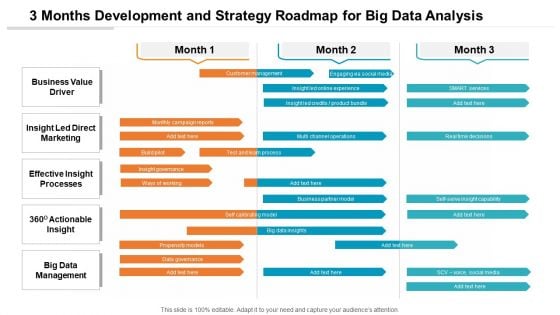
3 Months Development And Strategy Roadmap For Big Data Analysis Background
Presenting our innovatively-structured 3 months development and strategy roadmap for big data analysis background Template. Showcase your roadmap process in different formats like PDF, PNG, and JPG by clicking the download button below. This PPT design is available in both Standard Screen and Widescreen aspect ratios. It can also be easily personalized and presented with modified font size, font type, color, and shapes to measure your progress in a clear way.
3 Months Strategy Roadmap For Data Analysis Integration To Business Icons
Introducing our 3 months strategy roadmap for data analysis integration to business icons. This PPT presentation is Google Slides compatible, therefore, you can share it easily with the collaborators for measuring the progress. Also, the presentation is available in both standard screen and widescreen aspect ratios. So edit the template design by modifying the font size, font type, color, and shapes as per your requirements. As this PPT design is fully editable it can be presented in PDF, JPG and PNG formats.
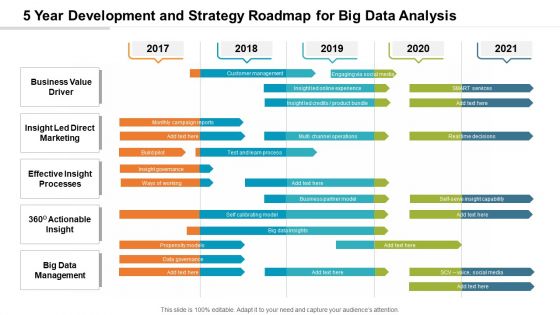
5 Year Development And Strategy Roadmap For Big Data Analysis Elements
Presenting our innovatively-structured 5 year development and strategy roadmap for big data analysis elements Template. Showcase your roadmap process in different formats like PDF, PNG, and JPG by clicking the download button below. This PPT design is available in both Standard Screen and Widescreen aspect ratios. It can also be easily personalized and presented with modified font size, font type, color, and shapes to measure your progress in a clear way.
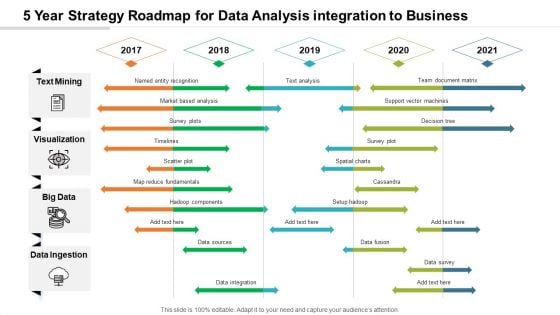
5 Year Strategy Roadmap For Data Analysis Integration To Business Pictures
Introducing our 5 year strategy roadmap for data analysis integration to business pictures. This PPT presentation is Google Slides compatible, therefore, you can share it easily with the collaborators for measuring the progress. Also, the presentation is available in both standard screen and widescreen aspect ratios. So edit the template design by modifying the font size, font type, color, and shapes as per your requirements. As this PPT design is fully editable it can be presented in PDF, JPG and PNG formats.
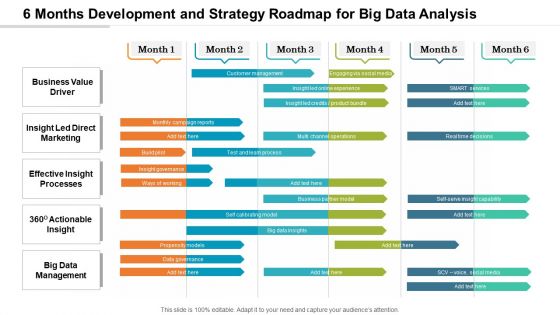
6 Months Development And Strategy Roadmap For Big Data Analysis Graphics
Presenting our innovatively-structured 6 months development and strategy roadmap for big data analysis graphics Template. Showcase your roadmap process in different formats like PDF, PNG, and JPG by clicking the download button below. This PPT design is available in both Standard Screen and Widescreen aspect ratios. It can also be easily personalized and presented with modified font size, font type, color, and shapes to measure your progress in a clear way.
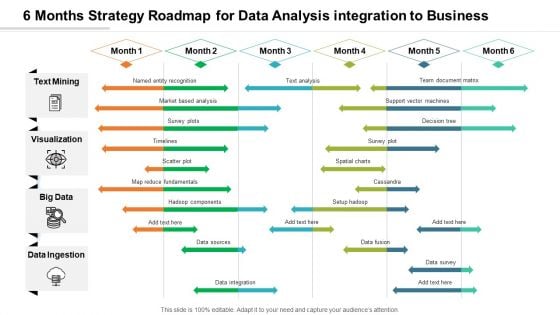
6 Months Strategy Roadmap For Data Analysis Integration To Business Diagrams
Introducing our 6 months strategy roadmap for data analysis integration to business diagrams. This PPT presentation is Google Slides compatible, therefore, you can share it easily with the collaborators for measuring the progress. Also, the presentation is available in both standard screen and widescreen aspect ratios. So edit the template design by modifying the font size, font type, color, and shapes as per your requirements. As this PPT design is fully editable it can be presented in PDF, JPG and PNG formats.
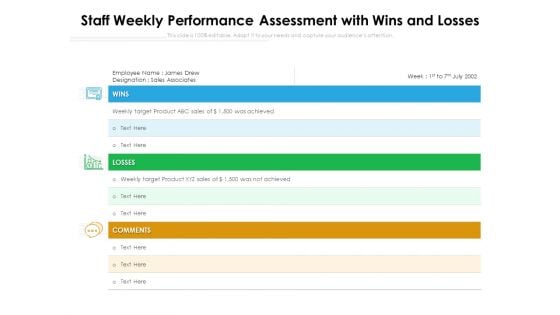
Staff Weekly Performance Assessment With Wins And Losses Ppt PowerPoint Presentation Infographic Template Gallery PDF
Presenting this set of slides with name staff weekly performance assessment with wins and losses ppt powerpoint presentation infographic template gallery pdf. The topics discussed in these slides are wins, losses, comments, weekly target product, sales associates, employee. This is a completely editable PowerPoint presentation and is available for immediate download. Download now and impress your audience.
Company Amalgamation M And A Performance Tracker Ppt Infographics Structure PDF
Presenting this set of slides with name company amalgamation m and a performance tracker ppt infographics structure pdf. This is a five stage process. The stages in this process are value, cash flow, production capacity. This is a completely editable PowerPoint presentation and is available for immediate download. Download now and impress your audience.
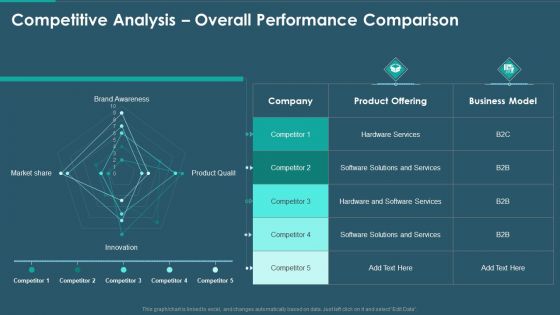
Sales And Promotion Playbook Competitive Analysis Overall Performance Comparison Infographics PDF
Deliver and pitch your topic in the best possible manner with this sales and promotion playbook competitive analysis overall performance comparison infographics pdf. Use them to share invaluable insights on product offering, business model, services and impress your audience. This template can be altered and modified as per your expectations. So, grab it now.
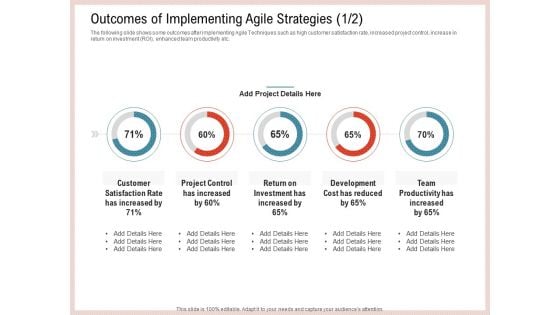
Agile Model Improve Task Team Performance Outcomes Of Implementing Agile Strategies Cost Infographics PDF
The following slide shows some outcomes after implementing Agile Techniques such as high customer satisfaction rate, increased project control, increase in return on investment ROI, enhanced team productivity etc. Deliver and pitch your topic in the best possible manner with this agile model improve task team performance outcomes of implementing agile strategies cost infographics pdf. Use them to share invaluable insights on investment, development cost, team productivity and impress your audience. This template can be altered and modified as per your expectations. So, grab it now.
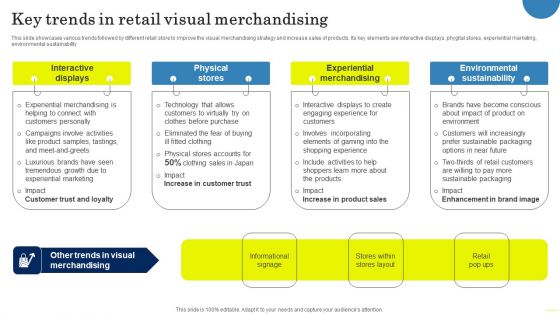
Field Marketing Strategies To Boost Product Sales Key Trends In Retail Visual Merchandising Introduction PDF
This slide showcases various trends followed by different retail store to improve the visual merchandising strategy and increase sales of products. Its key elements are interactive displays, phygital stores, experiential marketing, environmental sustainability. From laying roadmaps to briefing everything in detail, our templates are perfect for you. You can set the stage with your presentation slides. All you have to do is download these easy to edit and customizable templates. Field Marketing Strategies To Boost Product Sales Key Trends In Retail Visual Merchandising Introduction PDF will help you deliver an outstanding performance that everyone would remember and praise you for. Do download this presentation today.
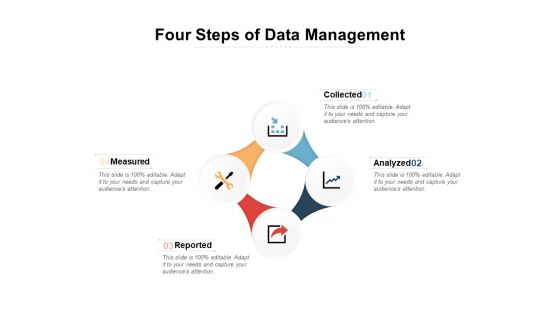
Four Steps Of Data Management Ppt PowerPoint Presentation Professional Ideas
Presenting this set of slides with name four steps of data management ppt powerpoint presentation professional ideas. This is a four stage process. The stages in this process are measured, reported, collected, analyzed . This is a completely editable PowerPoint presentation and is available for immediate download. Download now and impress your audience.
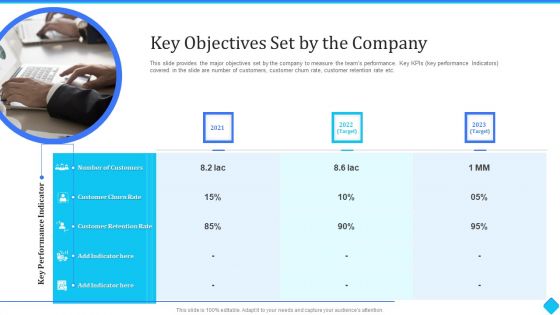
User Onboarding Process Development Key Objectives Set By The Company Download PDF
This slide provides the major objectives set by the company to measure the teams performance. Key KPIs key performance Indicators covered in the slide are number of customers, customer churn rate, customer retention rate etc. Deliver and pitch your topic in the best possible manner with this User Onboarding Process Development Key Objectives Set By The Company Download PDF. Use them to share invaluable insights on customer churn rate, customer retention rate, target and impress your audience. This template can be altered and modified as per your expectations. So, grab it now.
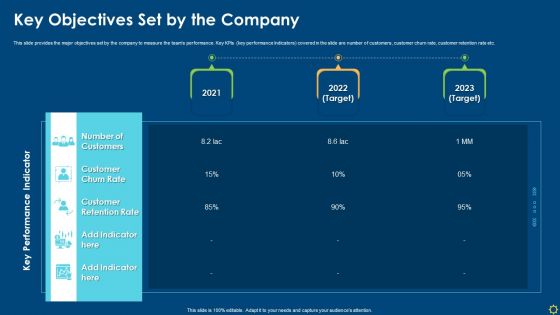
Improving Organizational Process Client Induction Procedure Key Objectives Set By The Company Mockup PDF
This slide provides the major objectives set by the company to measure the teams performance. Key KPIs key performance Indicators covered in the slide are number of customers, customer churn rate, customer retention rate etc. Deliver an awe inspiring pitch with this creative improving organizational process client induction procedure key objectives set by the company mockup pdf bundle. Topics like customer retention rate, customer churn rate, target can be discussed with this completely editable template. It is available for immediate download depending on the needs and requirements of the user.
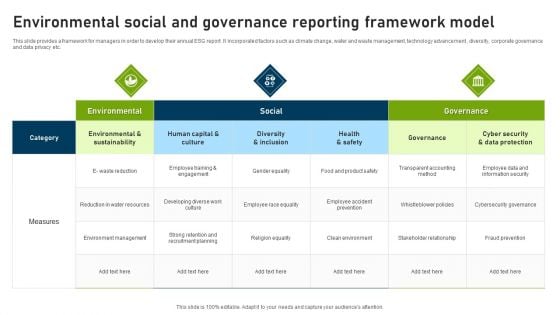
Environmental Social And Governance Reporting Framework Model Demonstration PDF
This slide provides a framework for managers in order to develop their annual ESG report. It incorporated factors such as climate change, water and waste management, technology advancement , diversity, corporate governance and data privacy etc. Pitch your topic with ease and precision using this Environmental Social And Governance Reporting Framework Model Demonstration PDF. This layout presents information on Environmental, Social, Measures. It is also available for immediate download and adjustment. So, changes can be made in the color, design, graphics or any other component to create a unique layout.

Post Implementation Gap Analysis For Evaluating Business Growth Ppt Slides
This slide represents the gap analysis for measuring the post-restructuring performance of the business. Different KPIs included are employee engagement level, team productivity, task completion rate, cost savings, and turnover rate From laying roadmaps to briefing everything in detail, our templates are perfect for you. You can set the stage with your presentation slides. All you have to do is download these easy-to-edit and customizable templates. Post Implementation Gap Analysis For Evaluating Business Growth Ppt Slides will help you deliver an outstanding performance that everyone would remember and praise you for. Do download this presentation today. This slide represents the gap analysis for measuring the post restructuring performance of the business. Different KPIs included are employee engagement level, team productivity, task completion rate, cost savings, and turnover rate
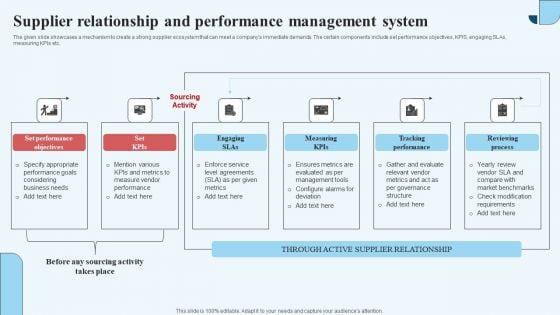
Supplier Relationship And Performance Management System Formats PDF
The given slide showcases a mechanism to create a strong supplier ecosystem that can meet a companys immediate demands. The certain components include set performance objectives, KPIS, engaging SLAs,measuring KPIs etc. Persuade your audience using this Supplier Relationship And Performance Management System Formats PDF. This PPT design covers six stages, thus making it a great tool to use. It also caters to a variety of topics including Measuring Kpis, Tracking Performance, Reviewing Process. Download this PPT design now to present a convincing pitch that not only emphasizes the topic but also showcases your presentation skills.
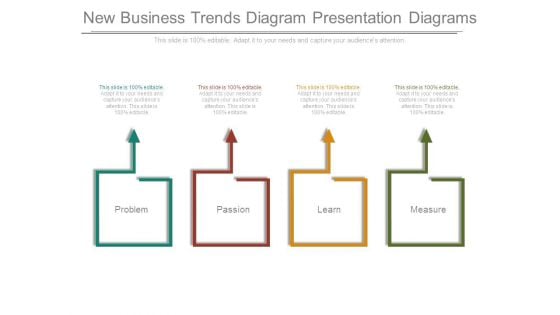
New Business Trends Diagram Presentation Diagrams
This is a new business trends diagram presentation diagrams. This is a four stage process. The stages in this process are problem, passion, learn, measure.
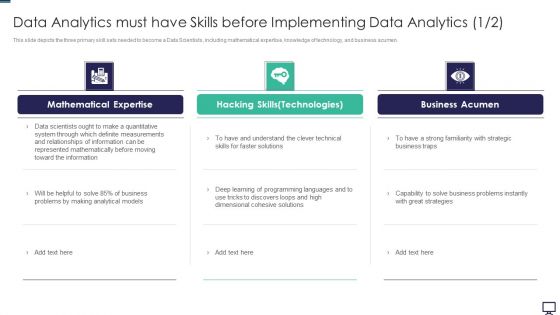
Data Analytics Must Have Skills Before Implementing Data Analytics Ppt Ideas PDF
This slide depicts the three primary skill sets needed to become a Data Scientists, including mathematical expertise, knowledge of technology, and business acumen. Deliver an awe inspiring pitch with this creative data analytics must have skills before implementing data analytics ppt ideas pdf bundle. Topics like business, system, measurements, information can be discussed with this completely editable template. It is available for immediate download depending on the needs and requirements of the user.

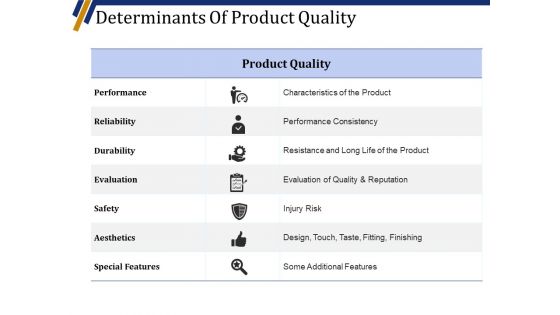
Determinants Of Product Quality Ppt PowerPoint Presentation Infographics Graphic Tips
This is a determinants of product quality ppt powerpoint presentation infographics graphic tips. This is a seven stage process. The stages in this process are performance, reliability, durability, evaluation, safety.
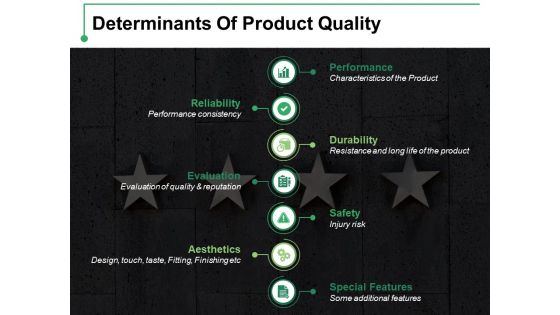
Determinants Of Product Quality Ppt PowerPoint Presentation Infographics Design Templates
This is a determinants of product quality ppt powerpoint presentation infographics design templates. This is a seven stage process. The stages in this process are performance, reliability, durability, evaluation, safety.
Determinants Of Product Quality Ppt PowerPoint Presentation Infographic Template Outline
This is a determinants of product quality ppt powerpoint presentation infographic template outline. This is a seven stage process. The stages in this process are performance, durability, safety, reliability, evaluation.
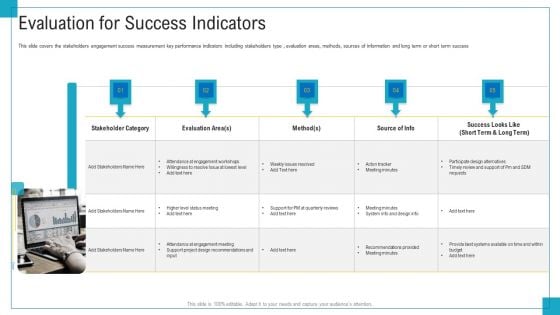
Program And PME Evaluation For Success Indicators Ppt Infographics Slide Download PDF
This slide covers the stakeholders engagement success measurement key performance indicators including stakeholders type , evaluation areas, methods, sources of information and long term or short term success. This is a program and PME evaluation for success indicators ppt infographics slide download pdf template with various stages. Focus and dispense information on five stages using this creative set, that comes with editable features. It contains large content boxes to add your information on topics like stakeholder category, provide best systems available on time and within budget, attendance at engagement workshops. You can also showcase facts, figures, and other relevant content using this PPT layout. Grab it now.
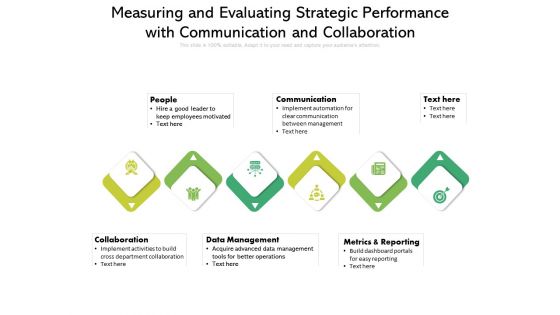
Measuring And Evaluating Strategic Performance With Communication And Collaboration Ppt PowerPoint Presentation Gallery Summary PDF
Presenting this set of slides with name measuring and evaluating strategic performance with communication and collaboration ppt powerpoint presentation gallery summary pdf. This is a six stage process. The stages in this process are collaboration, communication, data management. This is a completely editable PowerPoint presentation and is available for immediate download. Download now and impress your audience.
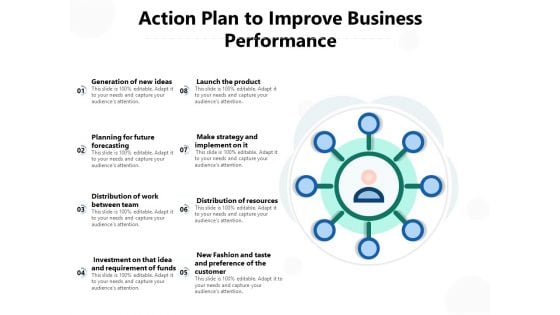
Action Plan To Improve Business Performance Ppt PowerPoint Presentation Infographics Professional PDF
Presenting this set of slides with name action plan to improve business performance ppt powerpoint presentation infographics professional pdf. This is a eight stage process. The stages in this process are generation new ideas, planning future forecasting, distribution work between team, investment idea and requirement of funds, launch product, make strategy implement, distribution resources, new fashion taste preference customer. This is a completely editable PowerPoint presentation and is available for immediate download. Download now and impress your audience.
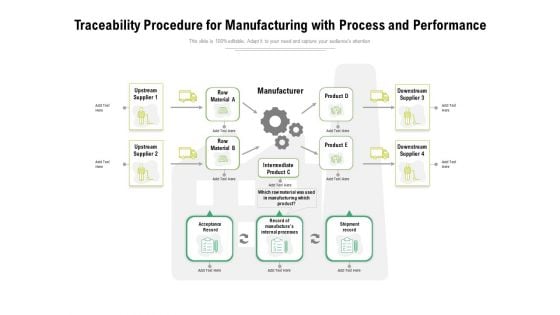
Traceability Procedure For Manufacturing With Process And Performance Ppt PowerPoint Presentation Infographics Show PDF
Presenting this set of slides with name traceability procedure for manufacturing with process and performance ppt powerpoint presentation infographics show pdf. This is a four stage process. The stages in this process are manufacturer, intermediate, product c downstream, supplier 3 acceptance record, record of manufactures internal processes, shipment record. This is a completely editable PowerPoint presentation and is available for immediate download. Download now and impress your audience.
Business Synergies M And A Synergy Performance Tracker Ppt Infographic Template Gridlines PDF
This is a business synergies m and a synergy performance tracker ppt infographic template gridlines pdf template with various stages. Focus and dispense information on five stages using this creative set, that comes with editable features. It contains large content boxes to add your information on topics like shareholder value, cash flow, production capacity. You can also showcase facts, figures, and other relevant content using this PPT layout. Grab it now.
M And A Synergy Performance Tracker Mergers And Acquisitions Synergy Ppt Infographics Smartart PDF
Presenting m and a synergy performance tracker mergers and acquisitions synergy ppt infographics smartart pdf to provide visual cues and insights. Share and navigate important information on five stages that need your due attention. This template can be used to pitch topics like value, cash flow, production capacity. In addtion, this PPT design contains high resolution images, graphics, etc, that are easily editable and available for immediate download.
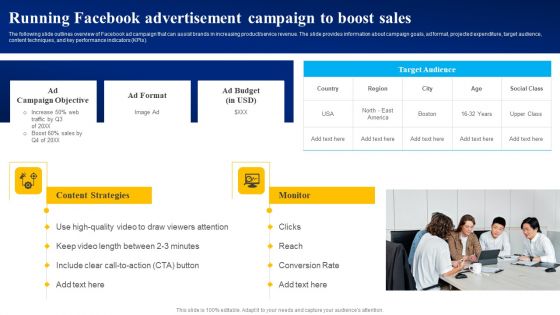
Running Facebook Advertisement Campaign To Boost Sales Ppt PowerPoint Presentation File Portfolio PDF
The following slide outlines overview of Facebook ad campaign that can assist brands in increasing product or service revenue. The slide provides information about campaign goals, ad format, projected expenditure, target audience, content techniques, and key performance indicators KPIs. The Running Facebook Advertisement Campaign To Boost Sales Ppt PowerPoint Presentation File Portfolio PDF is a compilation of the most recent design trends as a series of slides. It is suitable for any subject or industry presentation, containing attractive visuals and photo spots for businesses to clearly express their messages. This template contains a variety of slides for the user to input data, such as structures to contrast two elements, bullet points, and slides for written information. Slidegeeks is prepared to create an impression.
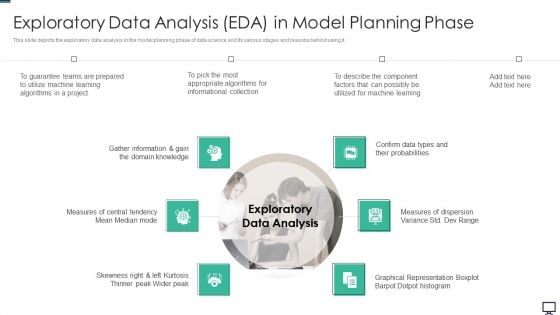
Exploratory Data Analysis EDA In Model Planning Phase Ppt Ideas Slide PDF
This slide depicts the exploratory data analysis in the model planning phase of data science and its various stages and reasons behind using it. This is a exploratory data analysis eda in model planning phase ppt ideas slide pdf template with various stages. Focus and dispense information on six stages using this creative set, that comes with editable features. It contains large content boxes to add your information on topics like Informational, teams, Measures. You can also showcase facts, figures, and other relevant content using this PPT layout. Grab it now.
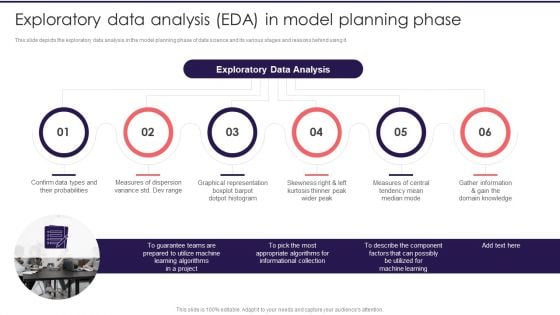
Information Studies Exploratory Data Analysis EDA In Model Planning Phase Diagrams PDF
This slide depicts the exploratory data analysis in the model planning phase of data science and its various stages and reasons behind using it. This is a Information Studies Exploratory Data Analysis EDA In Model Planning Phase Diagrams PDF template with various stages. Focus and dispense information on six stages using this creative set, that comes with editable features. It contains large content boxes to add your information on topics like Graphical Representation, Measures Of Dispersion, Probabilities. You can also showcase facts, figures, and other relevant content using this PPT layout. Grab it now.
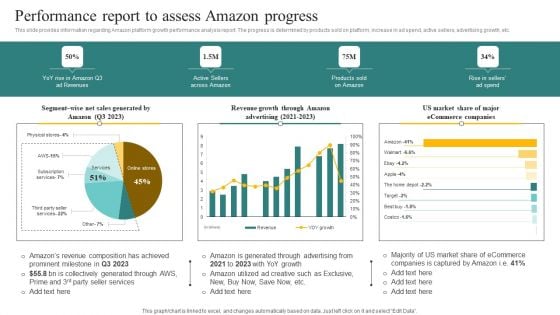
Performance Report To Assess Amazon Progress Ppt Infographics Design Inspiration PDF
This slide provides information regarding Amazon platform growth performance analysis report. The progress is determined by products sold on platform, increase in ad spend, active sellers, advertising growth, etc. From laying roadmaps to briefing everything in detail, our templates are perfect for you. You can set the stage with your presentation slides. All you have to do is download these easy to edit and customizable templates. Performance Report To Assess Amazon Progress Ppt Infographics Design Inspiration PDF will help you deliver an outstanding performance that everyone would remember and praise you for. Do download this presentation today.
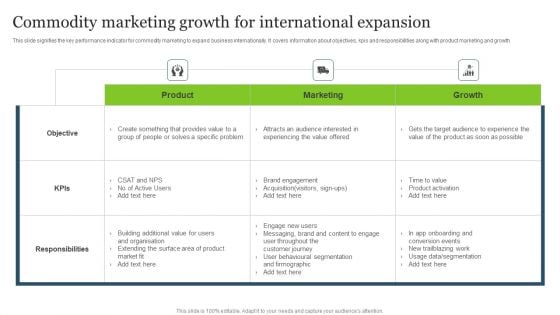
Commodity Marketing Growth For International Expansion Download PDF
This slide signifies the key performance indicator for commodity marketing to expand business internationally. It covers information about objectives, kpis and responsibilities along with product marketing and growth.Showcasing this set of slides titled Commodity Marketing Growth For International Expansion Download PDF. The topics addressed in these templates are Responsibilities, Building Additional, Brand Engagement. All the content presented in this PPT design is completely editable. Download it and make adjustments in color, background, font etc. as per your unique business setting.
Guide To SEO Marketing Website SEO Marketing Content Performance Analysis Icons PDF
This slide covers an SEO marketing activity tracking sheet for analyzing data on traffic, engagement, and links. It includes evaluation KPIs such as visits, bounce rate, conversions, FB shares, Twitter shares, Instagram shares, word length, uniqueness, timeliness, topic relevance., etc. Boost your pitch with our creative Guide To SEO Marketing Website SEO Marketing Content Performance Analysis Icons PDF. Deliver an awe-inspiring pitch that will mesmerize everyone. Using these presentation templates you will surely catch everyones attention. You can browse the ppts collection on our website. We have researchers who are experts at creating the right content for the templates. So you dont have to invest time in any additional work. Just grab the template now and use them.
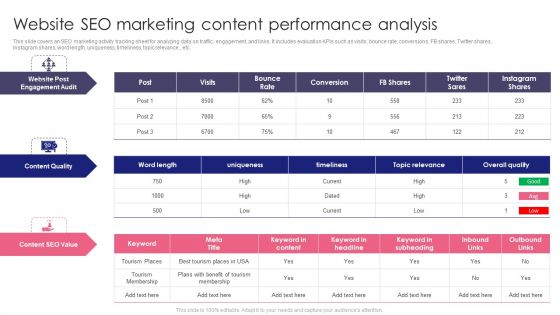
Guide To SEO Marketing Website SEO Marketing Content Performance Analysis Grid PDF
This slide covers an SEO marketing activity tracking sheet for analyzing data on traffic, engagement, and links. It includes evaluation KPIs such as visits, bounce rate, conversions, FB shares, Twitter shares, Instagram shares, word length, uniqueness, timeliness, topic relevance., etc. Boost your pitch with our creative Guide To SEO Marketing Website SEO Marketing Content Performance Analysis Grid PDF. Deliver an awe-inspiring pitch that will mesmerize everyone. Using these presentation templates you will surely catch everyones attention. You can browse the ppts collection on our website. We have researchers who are experts at creating the right content for the templates. So you dont have to invest time in any additional work. Just grab the template now and use them.
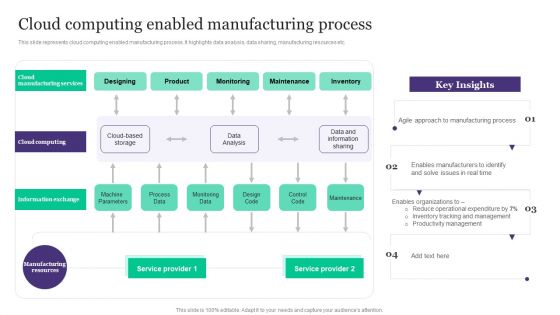
Deployment Of Automated Production Technology Cloud Computing Enabled Manufacturing Process Themes PDF
This slide represents cloud computing enabled manufacturing process. It highlights data analysis, data sharing, manufacturing resources etc.This Deployment Of Automated Production Technology Cloud Computing Enabled Manufacturing Process Themes PDF from Slidegeeks makes it easy to present information on your topic with precision. It provides customization options, so you can make changes to the colors, design, graphics, or any other component to create a unique layout. It is also available for immediate download, so you can begin using it right away. Slidegeeks has done good research to ensure that you have everything you need to make your presentation stand out. Make a name out there for a brilliant performance.
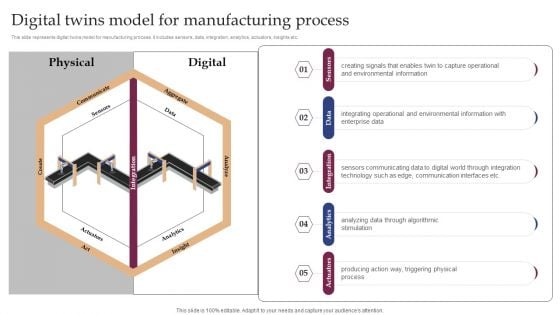
Implementing Smart Manufacturing Technology To Increase Productivity Digital Twins Model For Manufacturing Process Inspiration PDF
This slide represents digital twins model for manufacturing process. It includes sensors, data, integration, analytics, actuators, insights etc.From laying roadmaps to briefing everything in detail, our templates are perfect for you. You can set the stage with your presentation slides. All you have to do is download these easy-to-edit and customizable templates. Implementing Smart Manufacturing Technology To Increase Productivity Digital Twins Model For Manufacturing Process Inspiration PDF will help you deliver an outstanding performance that everyone would remember and praise you for. Do download this presentation today.
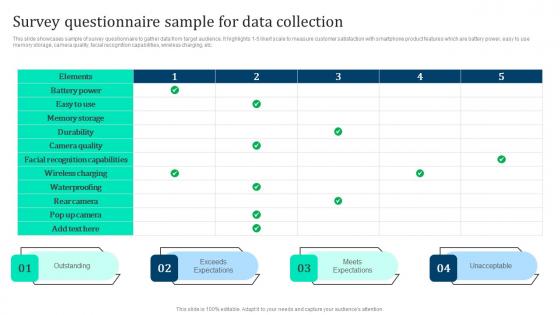
Survey Questionnaire Sample Data Marketing Intelligence Guide Data Gathering Sample Pdf
This slide showcases sample of survey questionnaire to gather data from target audience. It highlights 1 5 likert scale to measure customer satisfaction with smartphone product features which are battery power, easy to use memory storage, camera quality, facial recognition capabilities, wireless charging, etc. Slidegeeks is here to make your presentations a breeze with Survey Questionnaire Sample Data Marketing Intelligence Guide Data Gathering Sample Pdf With our easy to use and customizable templates, you can focus on delivering your ideas rather than worrying about formatting. With a variety of designs to choose from, you are sure to find one that suits your needs. And with animations and unique photos, illustrations, and fonts, you can make your presentation pop. So whether you are giving a sales pitch or presenting to the board, make sure to check out Slidegeeks first This slide showcases sample of survey questionnaire to gather data from target audience. It highlights 1 5 likert scale to measure customer satisfaction with smartphone product features which are battery power, easy to use memory storage, camera quality, facial recognition capabilities, wireless charging, etc.


 Continue with Email

 Home
Home


