Metrics List
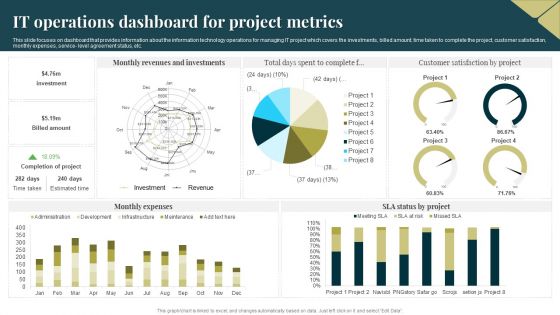
IT Operations Dashboard For Project Metrics Portrait PDF
This slide focuses on dashboard that provides information about the information technology operations for managing IT project which covers the investments, billed amount, time taken to complete the project, customer satisfaction, monthly expenses, service level agreement status, etc. Pitch your topic with ease and precision using this IT Operations Dashboard For Project Metrics Portrait PDF. This layout presents information on Revenues, Investments, Monthly Expenses. It is also available for immediate download and adjustment. So, changes can be made in the color, design, graphics or any other component to create a unique layout.
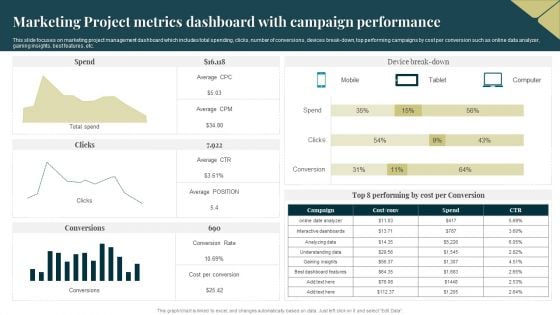
Marketing Project Metrics Dashboard With Campaign Performance Topics PDF
This slide focuses on marketing project management dashboard which includes total spending, clicks, number of conversions, devices break down, top performing campaigns by cost per conversion such as online data analyzer, gaining insights, best features, etc. Showcasing this set of slides titled Marketing Project Metrics Dashboard With Campaign Performance Topics PDF. The topics addressed in these templates are Average, Cost, Analyzing Data. All the content presented in this PPT design is completely editable. Download it and make adjustments in color, background, font etc. as per your unique business setting.
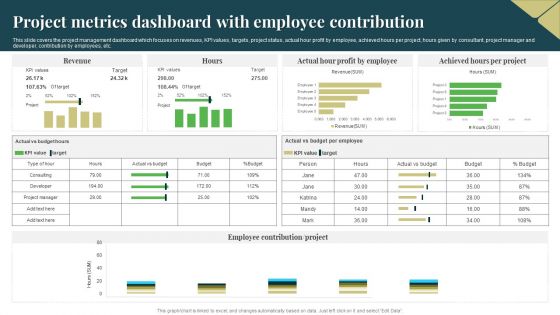
Project Metrics Dashboard With Employee Contribution Guidelines PDF
This slide covers the project management dashboard which focuses on revenues, KPI values, targets, project status, actual hour profit by employee, achieved hours per project, hours given by consultant, project manager and developer, contribution by employees, etc. Showcasing this set of slides titled Project Metrics Dashboard With Employee Contribution Guidelines PDF. The topics addressed in these templates are Target, Revenue, Profit By Employee. All the content presented in this PPT design is completely editable. Download it and make adjustments in color, background, font etc. as per your unique business setting.
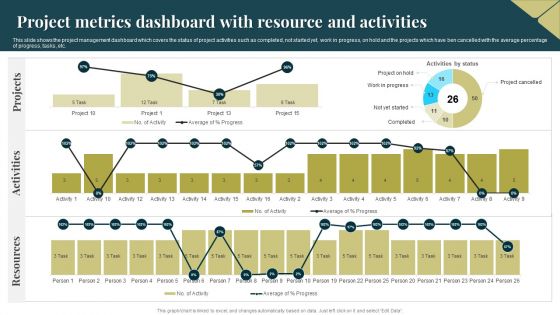
Project Metrics Dashboard With Resource And Activities Infographics PDF
This slide shows the project management dashboard which covers the status of project activities such as completed, not started yet, work in progress, on hold and the projects which have ben cancelled with the average percentage of progress, tasks, etc. Showcasing this set of slides titled Project Metrics Dashboard With Resource And Activities Infographics PDF. The topics addressed in these templates are Activities, Projects, Resources. All the content presented in this PPT design is completely editable. Download it and make adjustments in color, background, font etc. as per your unique business setting.
Project Metrics Dashboard With Revenues And Expenses Icons PDF
This slide shows the project management dashboard which covers the name, priorities, indicators and status which includes strategic priorities, research and development, administration, performance management, etc. With purchases in last 30 days and tasks. Showcasing this set of slides titled Project Metrics Dashboard With Revenues And Expenses Icons PDF. The topics addressed in these templates are Performance Management, Research And Development, Strategic Priorities. All the content presented in this PPT design is completely editable. Download it and make adjustments in color, background, font etc. as per your unique business setting.

Project Metrics Dashboard With Task Status Rules PDF
This slide shows the project management dashboard which shows the number of team members of managing project activities, estimated and actual time to complete the project task, hours taken by employees with achieved and open milestones and progress status. Pitch your topic with ease and precision using this Project Metrics Dashboard With Task Status Rules PDF. This layout presents information on Team Members, Employee. It is also available for immediate download and adjustment. So, changes can be made in the color, design, graphics or any other component to create a unique layout.
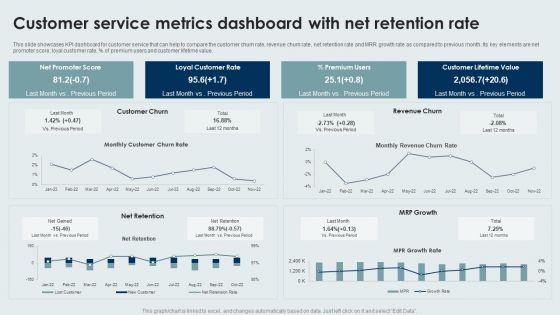
Customer Service Metrics Dashboard With Net Retention Rate Sample PDF
This slide showcases KPI dashboard for customer service that can help to compare the customer churn rate, revenue churn rate, net retention rate and MRR growth rate as compared to previous month. Its key elements are net promoter score, loyal customer rate, percentage of premium users and customer lifetime value. Pitch your topic with ease and precision using this Customer Service Metrics Dashboard With Net Retention Rate Sample PDF. This layout presents information on Loyal Customer Rate, Premium Users, Customer Lifetime Value. It is also available for immediate download and adjustment. So, changes can be made in the color, design, graphics or any other component to create a unique layout.
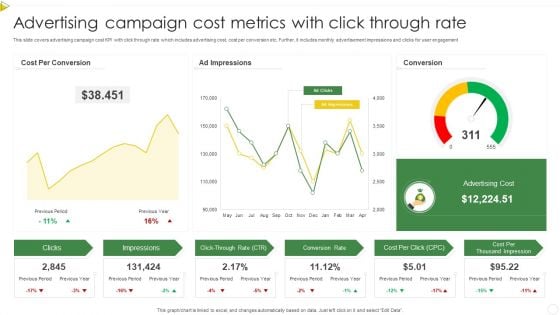
Advertising Campaign Cost Metrics With Click Through Rate Pictures PDF
This slide covers advertising campaign cost KPI with click through rate which includes advertising cost, cost per conversion etc. Further, it includes monthly advertisement impressions and clicks for user engagement. Showcasing this set of slides titled Advertising Campaign Cost Metrics With Click Through Rate Pictures PDF. The topics addressed in these templates are Conversion Rate, Cost Per Click, Advertising Cost. All the content presented in this PPT design is completely editable. Download it and make adjustments in color, background, font etc. as per your unique business setting.
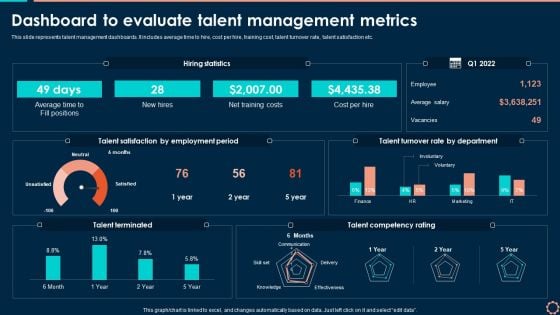
Dashboard To Evaluate Talent Management Metrics Topics PDF
This slide represents talent management dashboards. It includes average time to hire, cost per hire, training cost, talent turnover rate, talent satisfaction etc. Boost your pitch with our creative Dashboard To Evaluate Talent Management Metrics Topics PDF. Deliver an awe inspiring pitch that will mesmerize everyone. Using these presentation templates you will surely catch everyones attention. You can browse the ppts collection on our website. We have researchers who are experts at creating the right content for the templates. So you do not have to invest time in any additional work. Just grab the template now and use them.
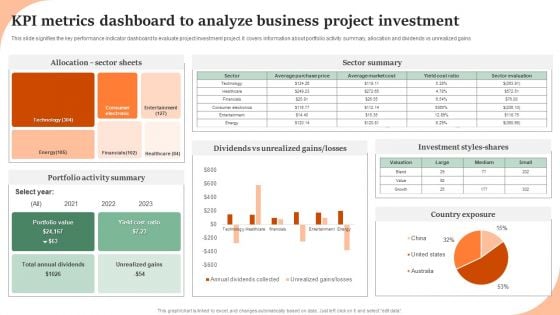
KPI Metrics Dashboard To Analyze Business Project Investment Graphics PDF
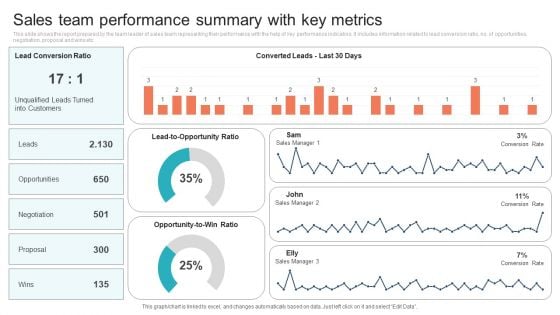
Sales Team Performance Summary With Key Metrics Background PDF
This slide shows the report prepared by the team leader of sales team representing their performance with the help of key performance indicators. It includes information related to lead conversion ratio, no. of opportunities, negotiation, proposal and wins etc. Showcasing this set of slides titled Sales Team Performance Summary With Key Metrics Background PDF. The topics addressed in these templates are Opportunities, Negotiation, Proposal. All the content presented in this PPT design is completely editable. Download it and make adjustments in color, background, font etc. as per your unique business setting.
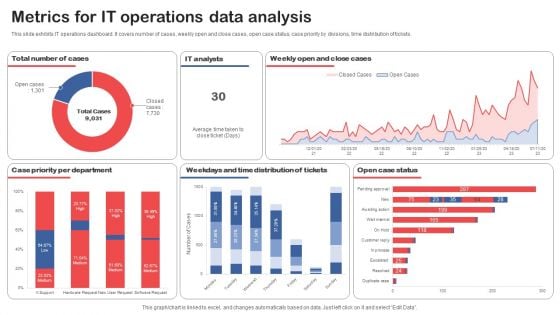
Metrics For IT Operations Data Analysis Topics PDF
This slide exhibits IT operations dashboard. It covers number of cases, weekly open and close cases, open case status, case priority by divisions, time distribution of tickets. Pitch your topic with ease and precision using this Metrics For IT Operations Data Analysis Topics PDF. This layout presents information on Case Priority Per Department, Distribution Of Tickets, Open Case Status. It is also available for immediate download and adjustment. So, changes can be made in the color, design, graphics or any other component to create a unique layout.
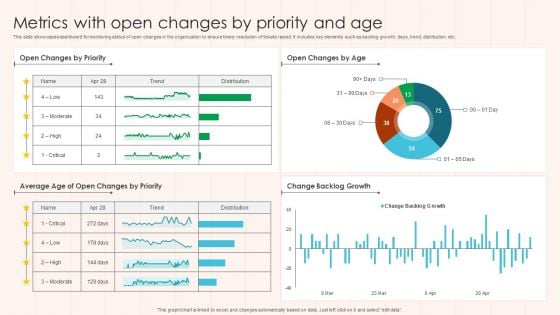
Metrics With Open Changes By Priority And Age Guidelines PDF
This slide showcases dashboard for monitoring status of open changes in the organization to ensure timely resolution of tickets raised. It includes key elements such as backlog growth, days, trend, distribution, etc. Pitch your topic with ease and precision using this Metrics With Open Changes By Priority And Age Guidelines PDF This layout presents information on Change Backlog Growth, Priority, Age. It is also available for immediate download and adjustment. So, changes can be made in the color, design, graphics or any other component to create a unique layout.

Monthly Financials Metrics With Revenue And Gross Profit Professional PDF
This slide displays P and L variance analysis to closely monitor key financial parameters of the company. It includes details about sales, discounts allowed, freight income, customer finance charges, etc. Showcasing this set of slides titled Monthly Financials Metrics With Revenue And Gross Profit Professional PDF. The topics addressed in these templates are Amount, Current Month, Profit. All the content presented in this PPT design is completely editable. Download it and make adjustments in color, background, font etc. as per your unique business setting.
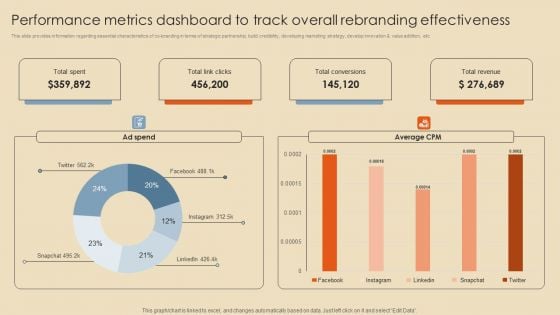
Performance Metrics Dashboard To Track Overall Rebranding Effectiveness Professional PDF
This slide provides information regarding essential characteristics of co-branding in terms of strategic partnership, build credibility, developing marketing strategy, develop innovation and value addition, etc. Make sure to capture your audiences attention in your business displays with our gratis customizable Performance Metrics Dashboard To Track Overall Rebranding Effectiveness Professional PDF. These are great for business strategies, office conferences, capital raising or task suggestions. If you desire to acquire more customers for your tech business and ensure they stay satisfied, create your own sales presentation with these plain slides.
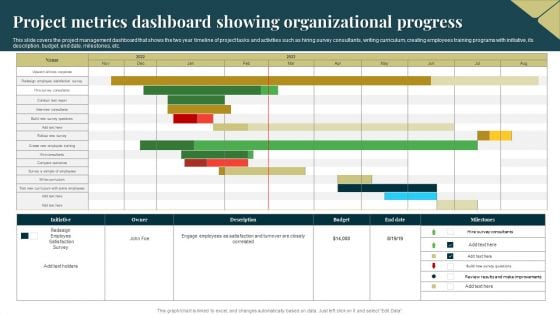
Project Metrics Dashboard Showing Organizational Progress Demonstration PDF
This slide covers the project management dashboard that shows the two year timeline of project tasks and activities such as hiring survey consultants, writing curriculum, creating employees training programs with initiative, its description, budget, end date, milestones, etc. Pitch your topic with ease and precision using this Project Metrics Dashboard Showing Organizational Progress Demonstration PDF. This layout presents information on Budget, Survey, Employees. It is also available for immediate download and adjustment. So, changes can be made in the color, design, graphics or any other component to create a unique layout.

Business Advocacy Strategy With Success Metrics Demonstration PDF
This slide showcases advocacy plan for the company to define campaign objectives along with business goals. It further includes details about brand assets to leverage, advertisements and stories. Pitch your topic with ease and precision using this Business Advocacy Strategy With Success Metrics Demonstration PDF This layout presents information on Business Goal, Increase Awareness, Drive Consideration. It is also available for immediate download and adjustment. So, changes can be made in the color, design, graphics or any other component to create a unique layout.

Objectives And Metrics Ppt PowerPoint Presentation Complete With Slides
Improve your presentation delivery using this Objectives And Metrics Ppt PowerPoint Presentation Complete With Slides. Support your business vision and objectives using this well-structured PPT deck. This template offers a great starting point for delivering beautifully designed presentations on the topic of your choice. Comprising seventeen this professionally designed template is all you need to host discussion and meetings with collaborators. Each slide is self-explanatory and equipped with high-quality graphics that can be adjusted to your needs. Therefore, you will face no difficulty in portraying your desired content using this PPT slideshow. This PowerPoint slideshow contains every important element that you need for a great pitch. It is not only editable but also available for immediate download and utilization. The color, font size, background, shapes everything can be modified to create your unique presentation layout. Therefore, download it now.

Engineering Performance Metrics Ppt PowerPoint Presentation Complete Deck With Slides
Boost your confidence and team morale with this well-structured Engineering Performance Metrics Ppt PowerPoint Presentation Complete Deck With Slides. This prefabricated set gives a voice to your presentation because of its well-researched content and graphics. Our experts have added all the components very carefully, thus helping you deliver great presentations with a single click. Not only that, it contains a set of twelve slides that are designed using the right visuals, graphics, etc. Various topics can be discussed, and effective brainstorming sessions can be conducted using the wide variety of slides added in this complete deck. Apart from this, our PPT design contains clear instructions to help you restructure your presentations and create multiple variations. The color, format, design anything can be modified as deemed fit by the user. Not only this, it is available for immediate download. So, grab it now.
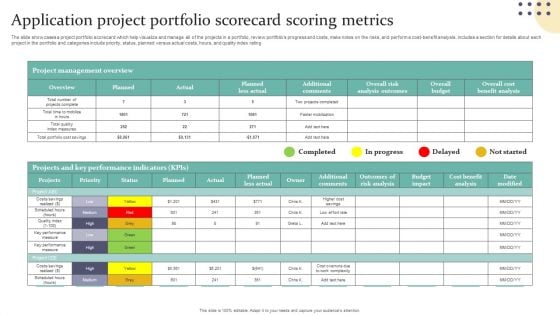
Application Project Portfolio Scorecard Scoring Metrics Information PDF
The slide showcases a project portfolio scorecard which help visualize and manage all of the projects in a portfolio, review portfolios progress and costs, make notes on the risks, and perform a cost-benefit analysis. includes a section for details about each project in the portfolio and categories include priority, status, planned versus actual costs, hours, and quality index rating. Showcasing this set of slides titled Application Project Portfolio Scorecard Scoring Metrics Information PDF. The topics addressed in these templates are Project Management Overview, Projects Key Performance Indicators, Additional Comments. All the content presented in this PPT design is completely editable. Download it and make adjustments in color, background, font etc. as per your unique business setting.

Campaign Metrics Ppt PowerPoint Presentation Complete With Slides
If designing a presentation takes a lot of your time and resources and you are looking for a better alternative, then this Campaign Metrics Ppt PowerPoint Presentation Complete With Slides is the right fit for you. This is a prefabricated set that can help you deliver a great presentation on the topic. All the tweleve slides included in this sample template can be used to present a birds-eye view of the topic. These slides are also fully editable, giving you enough freedom to add specific details to make this layout more suited to your business setting. Apart from the content, all other elements like color, design, theme are also replaceable and editable. This helps in designing a variety of presentations with a single layout. Not only this, you can use this PPT design in formats like PDF, PNG, and JPG once downloaded. Therefore, without any further ado, download and utilize this sample presentation as per your liking.
Shipping Tracking Metrics Ppt PowerPoint Presentation Complete Deck With Slides
Improve your presentation delivery using this Shipping Tracking Metrics Ppt PowerPoint Presentation Complete Deck With Slides. Support your business vision and objectives using this well-structured PPT deck. This template offers a great starting point for delivering beautifully designed presentations on the topic of your choice. Comprising Fourteen this professionally designed template is all you need to host discussion and meetings with collaborators. Each slide is self-explanatory and equipped with high-quality graphics that can be adjusted to your needs. Therefore, you will face no difficulty in portraying your desired content using this PPT slideshow. This PowerPoint slideshow contains every important element that you need for a great pitch. It is not only editable but also available for immediate download and utilization. The color, font size, background, shapes everything can be modified to create your unique presentation layout. Therefore, download it now.
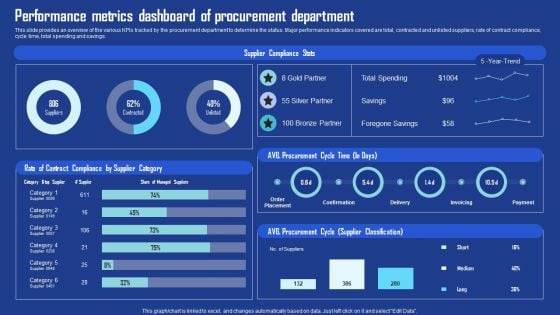
Performance Metrics Dashboard Of Procurement Department Download PDF
This slide provides an overview of the various KPIs tracked by the procurement department to determine the status. Major performance indicators covered are total, contracted and unlisted suppliers, rate of contract compliance, cycle time, total spending and savings. Slidegeeks has constructed Performance Metrics Dashboard Of Procurement Department Download PDF after conducting extensive research and examination. These presentation templates are constantly being generated and modified based on user preferences and critiques from editors. Here, you will find the most attractive templates for a range of purposes while taking into account ratings and remarks from users regarding the content. This is an excellent jumping off point to explore our content and will give new users an insight into our top notch PowerPoint Templates.
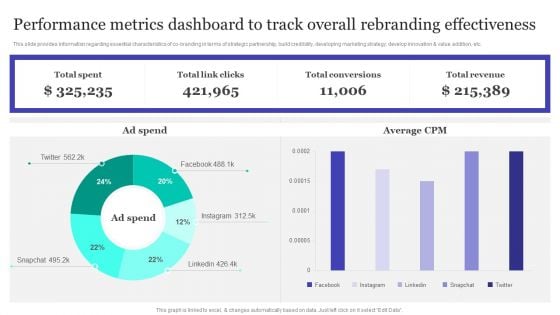
Performance Metrics Dashboard To Track Overall Rebranding Effectiveness Information PDF
This slide provides information regarding essential characteristics of co-branding in terms of strategic partnership, build credibility, developing marketing strategy, develop innovation and value addition, etc. This Performance Metrics Dashboard To Track Overall Rebranding Effectiveness Information PDF from Slidegeeks makes it easy to present information on your topic with precision. It provides customization options, so you can make changes to the colors, design, graphics, or any other component to create a unique layout. It is also available for immediate download, so you can begin using it right away. Slidegeeks has done good research to ensure that you have everything you need to make your presentation stand out. Make a name out there for a brilliant performance.

Monthly Financials Metrics Ppt PowerPoint Presentation Complete Deck With Slides
Share a great deal of information on the topic by deploying this Monthly Financials Metrics Ppt PowerPoint Presentation Complete Deck With Slides. Support your ideas and thought process with this prefabricated set. It includes a set of twelve slides, all fully modifiable and editable. Each slide can be restructured and induced with the information and content of your choice. You can add or remove large content boxes as well, to make this PPT slideshow more personalized. Its high-quality graphics and visuals help in presenting a well-coordinated pitch. This PPT template is also a resourceful tool to take visual cues from and implement the best ideas to help your business grow and expand. The main attraction of this well-formulated deck is that everything is editable, giving you the freedom to adjust it to your liking and choice. Changes can be made in the background and theme as well to deliver an outstanding pitch. Therefore, click on the download button now to gain full access to this multifunctional set.
Finance Metrics Dashboard Illustrating Account Payables Icons PDF
This graph or chart is linked to excel, and changes automatically based on data. Just left click on it and select edit data. Pitch your topic with ease and precision using this Total Income Budget, Total Expenses Balance, Net Profit Quick, Ratio Current Ratio. This layout presents information on Account Payable Age, Average Creditor Days, Cash On Hand. It is also available for immediate download and adjustment. So, changes can be made in the color, design, graphics or any other component to create a unique layout.
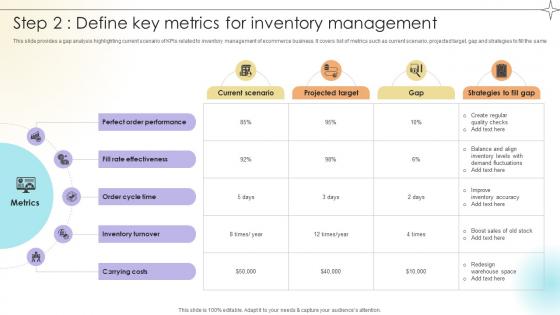
Step 2 Define Key Metrics For Inventory Management Data Analytics SS V
This slide provides a gap analysis highlighting current scenario of KPIs related to inventory management of ecommerce business. It covers list of metrics such as current scenario, projected target, gap and strategies to fill the same.Make sure to capture your audiences attention in your business displays with our gratis customizable Step 2 Define Key Metrics For Inventory Management Data Analytics SS V. These are great for business strategies, office conferences, capital raising or task suggestions. If you desire to acquire more customers for your tech business and ensure they stay satisfied, create your own sales presentation with these plain slides. This slide provides a gap analysis highlighting current scenario of KPIs related to inventory management of ecommerce business. It covers list of metrics such as current scenario, projected target, gap and strategies to fill the same.
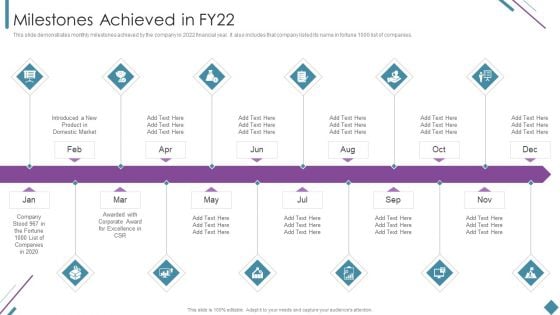
Metrics To Measure Business Performance Milestones Achieved In Fy22 Introduction PDF
This slide demonstrates monthly milestones achieved by the company in 2022 financial year. It also includes that company listed its name in fortune 1000 list of companies. This is a Metrics To Measure Business Performance Milestones Achieved In Fy22 Introduction PDF template with various stages. Focus and dispense information on twelve stages using this creative set, that comes with editable features. It contains large content boxes to add your information on topics like Corporate Award, Excellence CSR, Introduced New Product, Domestic Market. You can also showcase facts, figures, and other relevant content using this PPT layout. Grab it now.
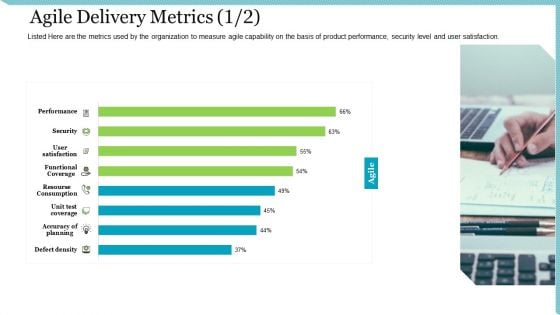
Agile Delivery Methodology For IT Project Agile Delivery Metrics Performance Ppt Infographics Structure PDF
Listed Here are the metrics used by the organization to measure agile capability on the basis of product performance, security level and user satisfaction. Deliver and pitch your topic in the best possible manner with this agile delivery methodology for IT project agile delivery metrics performance ppt infographics structure pdf. Use them to share invaluable insights on performance, accuracy of planning, resourse consumption, functional coverage, security and impress your audience. This template can be altered and modified as per your expectations. So, grab it now.
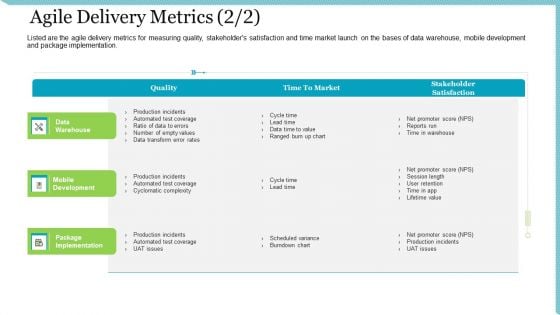
Agile Delivery Methodology For IT Project Agile Delivery Metrics Market Ppt Gallery Demonstration PDF
Listed are the agile delivery metrics for measuring quality, stakeholders satisfaction and time market launch on the bases of data warehouse, mobile development and package implementation. Deliver an awe inspiring pitch with this creative agile delivery methodology for IT project agile delivery metrics market ppt gallery demonstration pdf bundle. Topics like mobile development, package implementation, time to market, production incidents, cyclomatic complexity can be discussed with this completely editable template. It is available for immediate download depending on the needs and requirements of the user.
Utilizing Infrastructure Management Using Latest Methods KPI Metrics And Dashboard Topics PDF
This is a utilizing infrastructure management using latest methods kpi metrics and dashboard topics pdf template with various stages. Focus and dispense information on two stages using this creative set, that comes with editable features. It contains large content boxes to add your information on topics like kpi metrics, kpi dashboards. You can also showcase facts, figures, and other relevant content using this PPT layout. Grab it now.

Pharmaceutical Management Healthcare Management KPI Metrics Showing Incidents Length Of Stay Formats PDF
Presenting pharmaceutical management healthcare management kpi metrics showing incidents length of stay formats pdf to provide visual cues and insights. Share and navigate important information on four stages that need your due attention. This template can be used to pitch topics like incidents, average waiting time, avg length stay, overall patient satisfaction. In addition, this PPT design contains high-resolution images, graphics, etc, that are easily editable and available for immediate download.
List Of Team Objectives For Organizational Success Ideas PDF
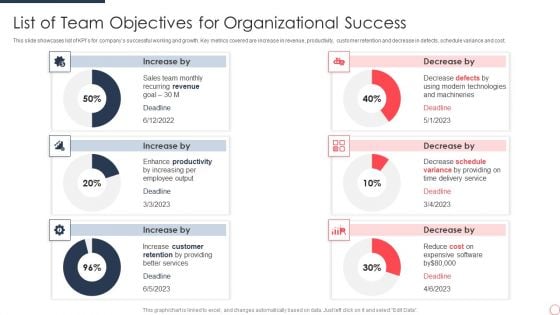
This slide showcases list of KPIs for companys successful working and growth. Key metrics covered are increase in revenue, productivity, customer retention and decrease in defects, schedule variance and cost. Showcasing this set of slides titled List Of Team Objectives For Organizational Success Ideas PDF. The topics addressed in these templates are Sales Team, Recurring Revenue, Goal. All the content presented in this PPT design is completely editable. Download it and make adjustments in color, background, font etc. as per your unique business setting.
Employment Task List Icon To Measure Employee Performance Graphics Pdf
Pitch your topic with ease and precision using this Employment Task List Icon To Measure Employee Performance Graphics Pdf This layout presents information on Employment Task List, Icon To Measure, Employee Performance It is also available for immediate download and adjustment. So, changes can be made in the color, design, graphics or any other component to create a unique layout. Our Employment Task List Icon To Measure Employee Performance Graphics Pdf are topically designed to provide an attractive backdrop to any subject. Use them to look like a presentation pro.
Web Application Management With List Of Product Backlog Background PDF
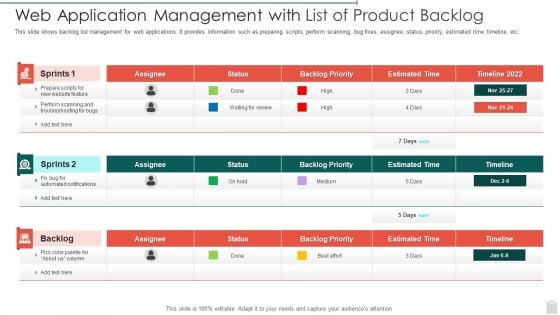
This slide shows backlog list management for web applications. It provides information such as preparing scripts, perform scanning, bug fixes, assignee, status, priority, estimated time, timeline, etc. Pitch your topic with ease and precision using this Web Application Management With List Of Product Backlog Background PDF. This layout presents information on Web Application Management With List Of Product Backlog. It is also available for immediate download and adjustment. So, changes can be made in the color, design, graphics or any other component to create a unique layout.
Kpis List Of Project Management Lifecycle Formats PDF
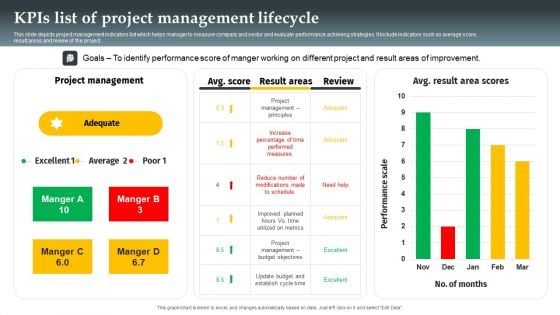
This slide depicts project management indicators list which helps manager to measure company and sector and evaluate performance achieving strategies. It include indicators such as average score, result areas and review of the project. Pitch your topic with ease and precision using this Kpis List Of Project Management Lifecycle Formats PDF. This layout presents information on Project Management, Performance Score, Average. It is also available for immediate download and adjustment. So, changes can be made in the color, design, graphics or any other component to create a unique layout.
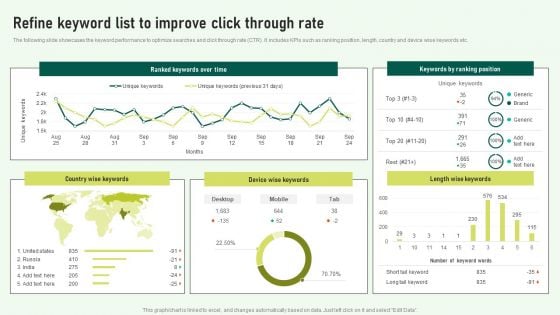
Refine Keyword List To Improve Click Through Rate Structure PDF
The following slide showcases the keyword performance to optimize searches and click through rate CTR. It includes KPIs such as ranking position, length, country and device wise keywords etc. Presenting this PowerPoint presentation, titled Refine Keyword List To Improve Click Through Rate Structure PDF, with topics curated by our researchers after extensive research. This editable presentation is available for immediate download and provides attractive features when used. Download now and captivate your audience. Presenting this Refine Keyword List To Improve Click Through Rate Structure PDF. Our researchers have carefully researched and created these slides with all aspects taken into consideration. This is a completely customizable Refine Keyword List To Improve Click Through Rate Structure PDF that is available for immediate downloading. Download now and make an impact on your audience. Highlight the attractive features available with our PPTs.
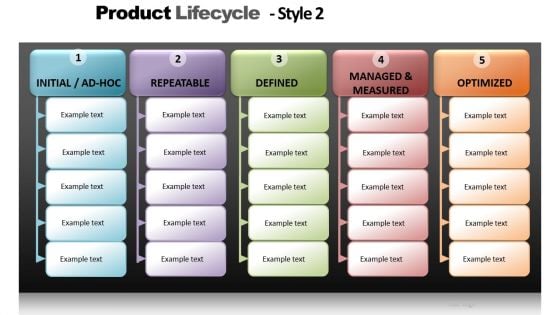
PowerPoint Process Table Chart List Text Boxes Ppt Slides
PowerPoint Process Table Chart List text Boxes PPT Slides-These high quality powerpoint pre-designed slides and powerpoint templates have been carefully created by our professional team to help you impress your audience. All slides have been created and are 100% editable in powerpoint. Each and every property of any graphic - color, size, orientation, shading, outline etc. can be modified to help you build an effective powerpoint presentation. Any text can be entered at any point in the powerpoint template or slide. Simply DOWNLOAD, TYPE and PRESENT! These PowerPoint presentation slides can be used to represent themes relating to --Activities, business, clipart, commerce, concept, conceptual, customer, design, diagram, direction, distribution, guidelines, icon, illustration, integration, lifecycle, manage, management, manufacturing, marketing, mba, model, optimize, organization, performance, process, product, resentation, resource, sales, selling, steps, system, theoretical, theory, tool-PowerPoint Process Table Chart List text Boxes PPT Slides Analyse the event in all its colours. Expose the facts to your audience on our PowerPoint Process Table Chart List Text Boxes Ppt Slides.
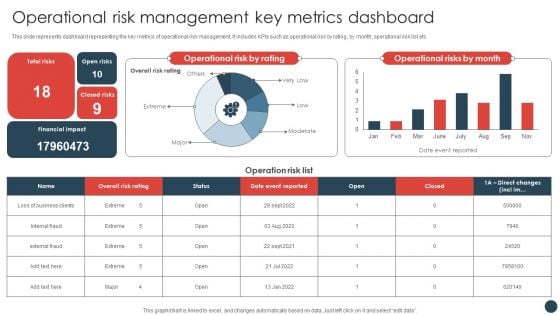
Strategic Risk Management Plan Operational Risk Management Key Metrics Dashboard Structure PDF
This slide represents dashboard representing the key metrics of operational risk management. It includes KPIs such as operational risk by rating, by month, operational risk list etc.Create an editable Strategic Risk Management Plan Operational Risk Management Key Metrics Dashboard Structure PDF that communicates your idea and engages your audience. Whether you are presenting a business or an educational presentation, pre-designed presentation templates help save time. Strategic Risk Management Plan Operational Risk Management Key Metrics Dashboard Structure PDF is highly customizable and very easy to edit, covering many different styles from creative to business presentations. Slidegeeks has creative team members who have crafted amazing templates. So, go and get them without any delay.
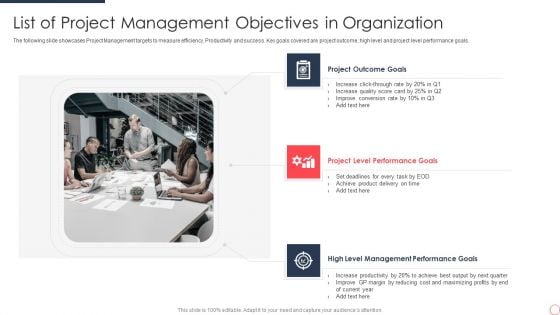
List Of Project Management Objectives In Organization Ideas PDF
The following slide showcases Project Management targets to measure efficiency, Productivity and success. Key goals covered are project outcome, high level and project level performance goals. Persuade your audience using this List Of Project Management Objectives In Organization Ideas PDF. This PPT design covers three stages, thus making it a great tool to use. It also caters to a variety of topics including Project Outcome Goals, Performance Goals, Management Performance Goals. Download this PPT design now to present a convincing pitch that not only emphasizes the topic but also showcases your presentation skills.
Operational Risk Assessment And Management Plan Operational Risk Management Key Metrics Dashboard Icons PDF
This slide represents dashboard representing the key metrics of operational risk management. It includes KPIs such as operational risk by rating, by month, operational risk list etc. The Operational Risk Assessment And Management Plan Operational Risk Management Key Metrics Dashboard Icons PDF is a compilation of the most recent design trends as a series of slides. It is suitable for any subject or industry presentation, containing attractive visuals and photo spots for businesses to clearly express their messages. This template contains a variety of slides for the user to input data, such as structures to contrast two elements, bullet points, and slides for written information. Slidegeeks is prepared to create an impression.
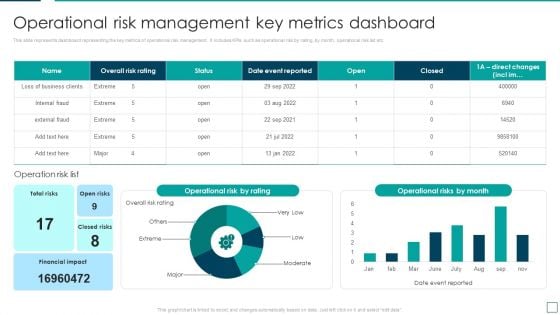
Strategic Risk Management And Mitigation Plan Operational Risk Management Key Metrics Dashboard Sample PDF
This slide represents dashboard representing the key metrics of operational risk management. It includes KPIs such as operational risk by rating, by month, operational risk list etc. Present like a pro with Strategic Risk Management And Mitigation Plan Operational Risk Management Key Metrics Dashboard Sample PDF Create beautiful presentations together with your team, using our easy to use presentation slides. Share your ideas in real time and make changes on the fly by downloading our templates. So whether you are in the office, on the go, or in a remote location, you can stay in sync with your team and present your ideas with confidence. With Slidegeeks presentation got a whole lot easier. Grab these presentations today.
Marketing Success Metrics Analyzing Blog Views Visits To Increase Organic Traffic Icons PDF
This slide covers blog view KPI to identify how many unique visitors have viewed your blogs. It also includes strategies to improve blog page views, create viral content, use FAB strategy to create content, and create evergreen list posts. Coming up with a presentation necessitates that the majority of the effort goes into the content and the message you intend to convey. The visuals of a PowerPoint presentation can only be effective if it supplements and supports the story that is being told. Keeping this in mind our experts created Marketing Success Metrics Analyzing Blog Views Visits To Increase Organic Traffic Icons PDF to reduce the time that goes into designing the presentation. This way, you can concentrate on the message while our designers take care of providing you with the right template for the situation.
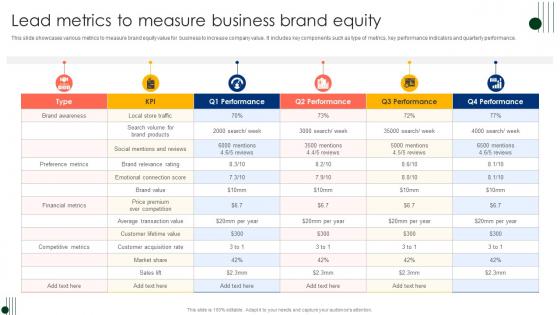
Lead Metrics To Measure Business Brand Equity Ppt Inspiration Model Pdf
This slide showcases various metrics to measure brand equity value for business to increase company value. It includes key components such as type of metrics, key performance indicators and quarterly performance. Showcasing this set of slides titled Lead Metrics To Measure Business Brand Equity Ppt Inspiration Model Pdf. The topics addressed in these templates are Key Performance Indicators, Quarterly Performance, KPI. All the content presented in this PPT design is completely editable. Download it and make adjustments in color, background, font etc. as per your unique business setting. This slide showcases various metrics to measure brand equity value for business to increase company value. It includes key components such as type of metrics, key performance indicators and quarterly performance.
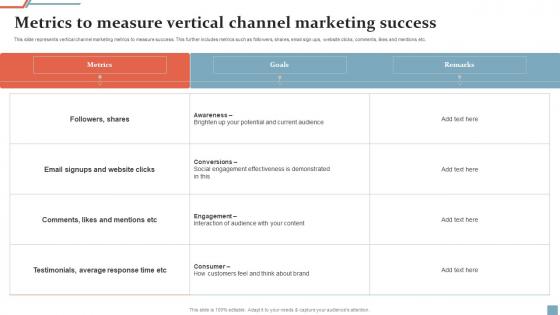
Metrics To Measure Vertical Channel Marketing Success Ppt Ideas Example File Pdf
This slide represents vertical channel marketing metrics to measure success. This further includes metrics such as followers, shares, email sign ups, website clicks, comments, likes and mentions etc. Pitch your topic with ease and precision using this Metrics To Measure Vertical Channel Marketing Success Ppt Ideas Example File Pdf. This layout presents information on Followers, Shares, Email Signups, Website Clicks. It is also available for immediate download and adjustment. So, changes can be made in the color, design, graphics or any other component to create a unique layout. This slide represents vertical channel marketing metrics to measure success. This further includes metrics such as followers, shares, email sign ups, website clicks, comments, likes and mentions etc.
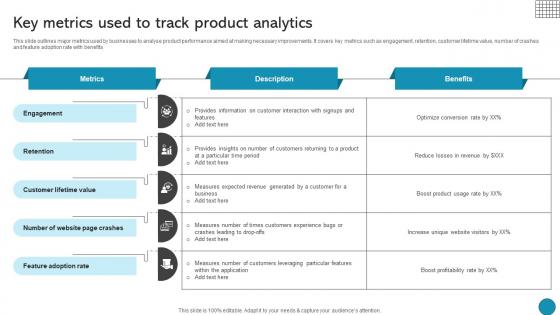
Key Metrics Used To Track Product Analytics Driving Business Success Integrating Product
This slide outlines major metrics used by businesses to analyse product performance aimed at making necessary improvements. It covers key metrics such as engagement, retention, customer lifetime value, number of crashes and feature adoption rate with benefits Find a pre-designed and impeccable Key Metrics Used To Track Product Analytics Driving Business Success Integrating Product. The templates can ace your presentation without additional effort. You can download these easy-to-edit presentation templates to make your presentation stand out from others. So, what are you waiting for Download the template from Slidegeeks today and give a unique touch to your presentation. This slide outlines major metrics used by businesses to analyse product performance aimed at making necessary improvements. It covers key metrics such as engagement, retention, customer lifetime value, number of crashes and feature adoption rate with benefits
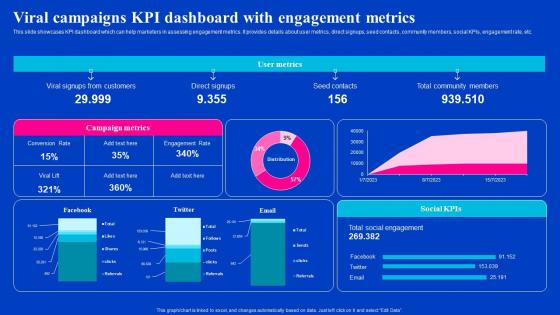
Viral Campaigns KPI Dashboard With Engagement Metrics Viral Video Outreach Plan Diagrams Pdf
This slide showcases KPI dashboard which can help marketers in assessing engagement metrics. It provides details about user metrics, direct signups, seed contacts, community members, social KPIs, engagement rate, etc. Find highly impressive Viral Campaigns KPI Dashboard With Engagement Metrics Viral Video Outreach Plan Diagrams Pdf on Slidegeeks to deliver a meaningful presentation. You can save an ample amount of time using these presentation templates. No need to worry to prepare everything from scratch because Slidegeeks experts have already done a huge research and work for you. You need to download Viral Campaigns KPI Dashboard With Engagement Metrics Viral Video Outreach Plan Diagrams Pdf for your upcoming presentation. All the presentation templates are 100Precent editable and you can change the color and personalize the content accordingly. Download now. This slide showcases KPI dashboard which can help marketers in assessing engagement metrics. It provides details about user metrics, direct signups, seed contacts, community members, social KPIs, engagement rate, etc.
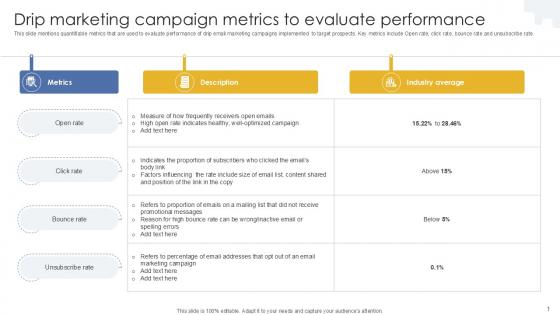
Drip Marketing Campaign Metrics To Evaluate Performance PPT Example MKT SS V
This slide mentions quantifiable metrics that are used to evaluate performance of drip email marketing campaigns implemented to target prospects. Key metrics include Open rate, click rate, bounce rate and unsubscribe rate. If your project calls for a presentation, then Slidegeeks is your go-to partner because we have professionally designed, easy-to-edit templates that are perfect for any presentation. After downloading, you can easily edit Drip Marketing Campaign Metrics To Evaluate Performance PPT Example MKT SS V and make the changes accordingly. You can rearrange slides or fill them with different images. Check out all the handy templates This slide mentions quantifiable metrics that are used to evaluate performance of drip email marketing campaigns implemented to target prospects. Key metrics include Open rate, click rate, bounce rate and unsubscribe rate.
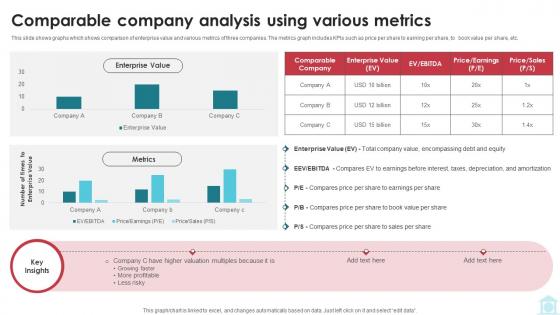
Comparable Company Analysis Using Various Metrics Mastering Investment Banking Fin SS V
This slide shows graphs which shows comparison of enterprise value and various metrics of three companies. The metrics graph includes KPIs such as price per share to earning per share, to book value per share, etc. Get a simple yet stunning designed Comparable Company Analysis Using Various Metrics Mastering Investment Banking Fin SS V It is the best one to establish the tone in your meetings. It is an excellent way to make your presentations highly effective. So, download this PPT today from Slidegeeks and see the positive impacts. Our easy-to-edit Comparable Company Analysis Using Various Metrics Mastering Investment Banking Fin SS V can be your go-to option for all upcoming conferences and meetings. So, what are you waiting for Grab this template today. This slide shows graphs which shows comparison of enterprise value and various metrics of three companies. The metrics graph includes KPIs such as price per share to earning per share, to book value per share, etc.
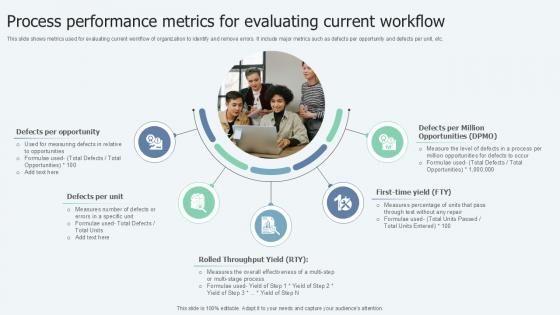
Process Performance Metrics For Lean Six Sigma In Manufacturing Ppt Sample
This slide shows metrics used for evaluating current workflow of organization to identify and remove errors. It include major metrics such as defects per opportunity and defects per unit, etc. Present like a pro with Process Performance Metrics For Lean Six Sigma In Manufacturing Ppt Sample. Create beautiful presentations together with your team, using our easy-to-use presentation slides. Share your ideas in real-time and make changes on the fly by downloading our templates. So whether you are in the office, on the go, or in a remote location, you can stay in sync with your team and present your ideas with confidence. With Slidegeeks presentation got a whole lot easier. Grab these presentations today. This slide shows metrics used for evaluating current workflow of organization to identify and remove errors. It include major metrics such as defects per opportunity and defects per unit, etc.
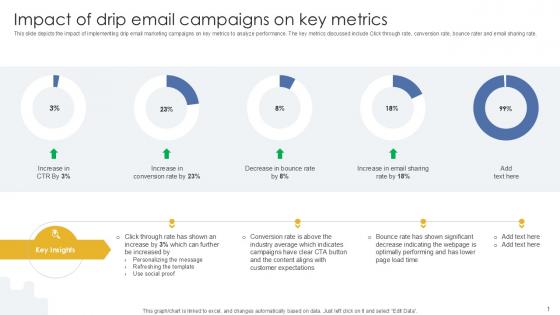
Impact Of Drip Email Campaigns On Key Metrics PPT Presentation MKT SS V
This slide depicts the impact of implementing drip email marketing campaigns on key metrics to analyze performance. The key metrics discussed include Click through rate, conversion rate, bounce rater and email sharing rate. This Impact Of Drip Email Campaigns On Key Metrics PPT Presentation MKT SS V is perfect for any presentation, be it in front of clients or colleagues. It is a versatile and stylish solution for organizing your meetings. The Impact Of Drip Email Campaigns On Key Metrics PPT Presentation MKT SS V features a modern design for your presentation meetings. The adjustable and customizable slides provide unlimited possibilities for acing up your presentation. Slidegeeks has done all the homework before launching the product for you. So, do not wait, grab the presentation templates today This slide depicts the impact of implementing drip email marketing campaigns on key metrics to analyze performance. The key metrics discussed include Click through rate, conversion rate, bounce rater and email sharing rate.
Sales Improvement Leading Metrics Dashboard Icon Ppt Summary Design Inspiration Pdf
Showcasing this set of slides titled Sales Improvement Leading Metrics Dashboard Icon Ppt Summary Design Inspiration Pdf. The topics addressed in these templates are Sales Improvement Leading, Metrics Dashboard, Icon. All the content presented in this PPT design is completely editable. Download it and make adjustments in color, background, font etc. as per your unique business setting. Our Sales Improvement Leading Metrics Dashboard Icon Ppt Summary Design Inspiration Pdf are topically designed to provide an attractive backdrop to any subject. Use them to look like a presentation pro.

Highlighting Performance Metrics To Track Toolkit For Brand Planning Background Pdf
This slide provides information regarding metrics to monitor brand awareness in terms of story reach, recommendations impressions, brand mentions, post engagement, page likes, page views, post reach, etc. Formulating a presentation can take up a lot of effort and time, so the content and message should always be the primary focus. The visuals of the PowerPoint can enhance the presenters message, so our Highlighting Performance Metrics To Track Toolkit For Brand Planning Background Pdf was created to help save time. Instead of worrying about the design, the presenter can concentrate on the message while our designers work on creating the ideal templates for whatever situation is needed. Slidegeeks has experts for everything from amazing designs to valuable content, we have put everything into Highlighting Performance Metrics To Track Toolkit For Brand Planning Background Pdf This slide provides information regarding metrics to monitor brand awareness in terms of story reach, recommendations impressions, brand mentions, post engagement, page likes, page views, post reach, etc.
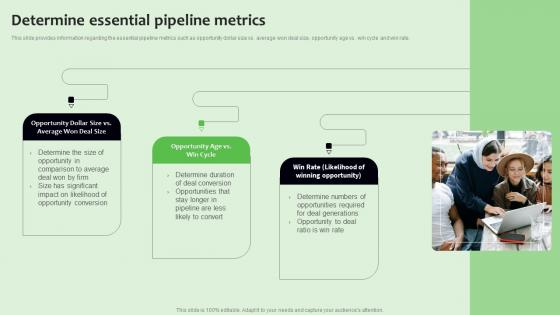
Determine Essential Pipeline Metrics Strategies To Manage Sales Funnel Formats Pdf
This slide provides information regarding the essential pipeline metrics such as opportunity dollar size vs. average won deal size, opportunity age vs. win cycle and win rate. Crafting an eye-catching presentation has never been more straightforward. Let your presentation shine with this tasteful yet straightforward Determine Essential Pipeline Metrics Strategies To Manage Sales Funnel Formats Pdf template. It offers a minimalistic and classy look that is great for making a statement. The colors have been employed intelligently to add a bit of playfulness while still remaining professional. Construct the ideal Determine Essential Pipeline Metrics Strategies To Manage Sales Funnel Formats Pdf that effortlessly grabs the attention of your audience. Begin now and be certain to wow your customers. This slide provides information regarding the essential pipeline metrics such as opportunity dollar size vs. average won deal size, opportunity age vs. win cycle and win rate.
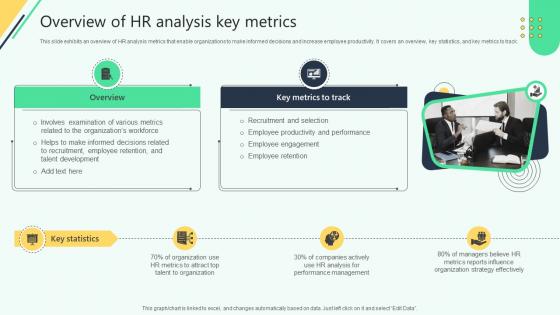
Overview Of Hr Analysis Key Metrics Analysing Hr Data For Effective Decision Making
This slide exhibits an overview of HR analysis metrics that enable organizations to make informed decisions and increase employee productivity. It covers an overview, key statistics, and key metrics to track. Slidegeeks is one of the best resources for PowerPoint templates. You can download easily and regulate Overview Of Hr Analysis Key Metrics Analysing Hr Data For Effective Decision Making for your personal presentations from our wonderful collection. A few clicks is all it takes to discover and get the most relevant and appropriate templates. Use our Templates to add a unique zing and appeal to your presentation and meetings. All the slides are easy to edit and you can use them even for advertisement purposes. This slide exhibits an overview of HR analysis metrics that enable organizations to make informed decisions and increase employee productivity. It covers an overview, key statistics, and key metrics to track.
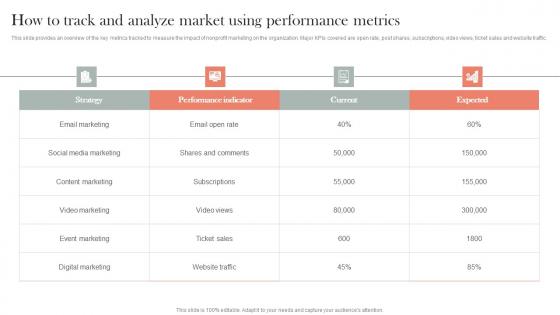
How To Track And Analyze Market Using Metrics Efficient Nonprofit Marketing Ideas Pdf
This slide provides an overview of the key metrics tracked to measure the impact of nonprofit marketing on the organization. Major KPIs covered are open rate, post shares, subscriptions, video views, ticket sales and website traffic.Are you searching for a How To Track And Analyze Market Using Metrics Efficient Nonprofit Marketing Ideas Pdf that is uncluttered, straightforward, and original Its easy to edit, and you can change the colors to suit your personal or business branding. For a presentation that expresses how much effort you have put in, this template is ideal. With all of its features, including tables, diagrams, statistics, and lists, its perfect for a business plan presentation. Make your ideas more appealing with these professional slides. Download How To Track And Analyze Market Using Metrics Efficient Nonprofit Marketing Ideas Pdf from Slidegeeks today. This slide provides an overview of the key metrics tracked to measure the impact of nonprofit marketing on the organization. Major KPIs covered are open rate, post shares, subscriptions, video views, ticket sales and website traffic.
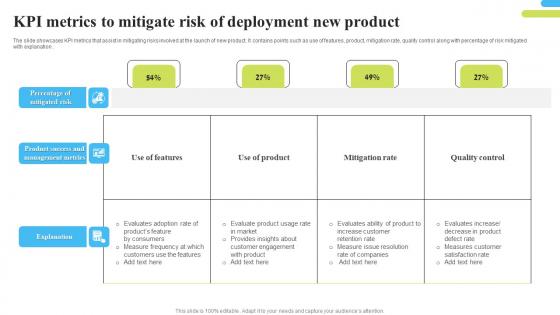
Kpi Metrics To Mitigate Risk Of Deployment New Product Themes Pdf
The slide showcases KPI metrics that assist in mitigating risks involved at the launch of new product. It contains points such as use of features, product, mitigation rate, quality control along with percentage of risk mitigated with explanation. Showcasing this set of slides titled Kpi Metrics To Mitigate Risk Of Deployment New Product Themes Pdf. The topics addressed in these templates are KPI Metrics To Mitigate Risk, Deployment New Product, Quality Control. All the content presented in this PPT design is completely editable. Download it and make adjustments in color, background, font etc. as per your unique business setting. The slide showcases KPI metrics that assist in mitigating risks involved at the launch of new product. It contains points such as use of features, product, mitigation rate, quality control along with percentage of risk mitigated with explanation.
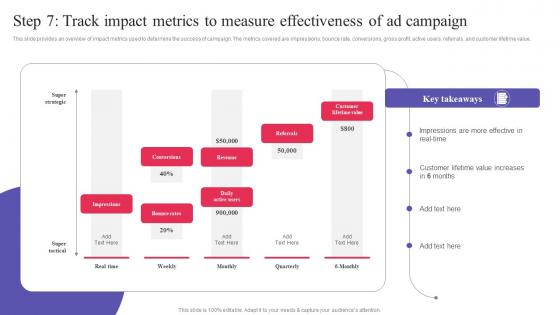
Step 7 Track Impact Metrics To Measure Effectiveness Digital Promotional Campaign Mockup Pdf
This slide provides an overview of impact metrics used to determine the success of campaign. The metrics covered are impressions, bounce rate, conversions, gross profit, active users, referrals, and customer lifetime value. Find highly impressive Step 7 Track Impact Metrics To Measure Effectiveness Digital Promotional Campaign Mockup Pdf on Slidegeeks to deliver a meaningful presentation. You can save an ample amount of time using these presentation templates. No need to worry to prepare everything from scratch because Slidegeeks experts have already done a huge research and work for you. You need to download Step 7 Track Impact Metrics To Measure Effectiveness Digital Promotional Campaign Mockup Pdf for your upcoming presentation. All the presentation templates are 100 percent editable and you can change the color and personalize the content accordingly. Download now. This slide provides an overview of impact metrics used to determine the success of campaign. The metrics covered are impressions, bounce rate, conversions, gross profit, active users, referrals, and customer lifetime value.
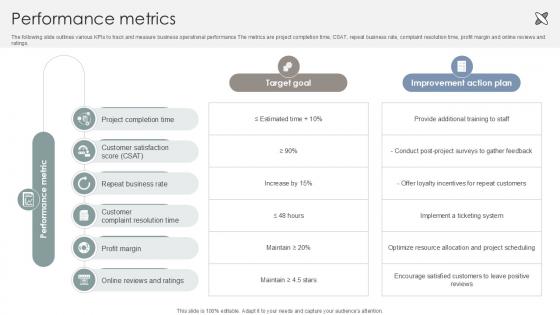
Performance Metrics Interior Design Company Market Entry Plan PPT PowerPoint GTM SS V
The following slide outlines various KPIs to track and measure business operational performance The metrics are project completion time, CSAT, repeat business rate, complaint resolution time, profit margin and online reviews and ratings. Crafting an eye-catching presentation has never been more straightforward. Let your presentation shine with this tasteful yet straightforward Performance Metrics Interior Design Company Market Entry Plan PPT PowerPoint GTM SS V template. It offers a minimalistic and classy look that is great for making a statement. The colors have been employed intelligently to add a bit of playfulness while still remaining professional. Construct the ideal Performance Metrics Interior Design Company Market Entry Plan PPT PowerPoint GTM SS V that effortlessly grabs the attention of your audience Begin now and be certain to wow your customers The following slide outlines various KPIs to track and measure business operational performance The metrics are project completion time, CSAT, repeat business rate, complaint resolution time, profit margin and online reviews and ratings.
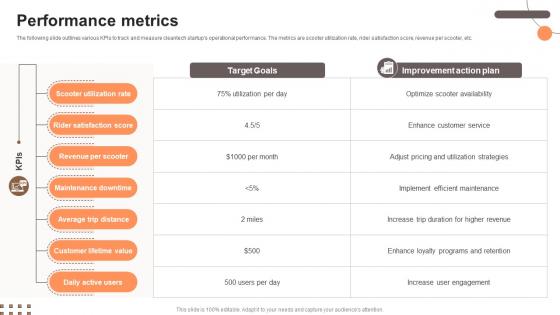
Performance Metrics Electric Scooter Rental Go To Market Strategy GTM SS V
The following slide outlines various KPIs to track and measure cleantech startups operational performance. The metrics are scooter utilization rate, rider satisfaction score, revenue per scooter, etc.This Performance Metrics Electric Scooter Rental Go To Market Strategy GTM SS V is perfect for any presentation, be it in front of clients or colleagues. It is a versatile and stylish solution for organizing your meetings. The Performance Metrics Electric Scooter Rental Go To Market Strategy GTM SS V features a modern design for your presentation meetings. The adjustable and customizable slides provide unlimited possibilities for acing up your presentation. Slidegeeks has done all the homework before launching the product for you. So, do not wait, grab the presentation templates today The following slide outlines various KPIs to track and measure cleantech startups operational performance. The metrics are scooter utilization rate, rider satisfaction score, revenue per scooter, etc.


 Continue with Email

 Home
Home


