Money Icon
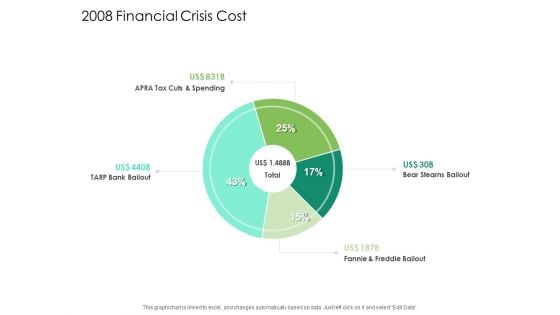
Global Financial Catastrophe 2008 2008 Financial Crisis Cost Ppt Show Master Slide PDF
Deliver an awe inspiring pitch with this creative global financial catastrophe 2008 2008 financial crisis cost ppt show master slide pdf bundle. Topics like 2008 financial crisis cost can be discussed with this completely editable template. It is available for immediate download depending on the needs and requirements of the user.
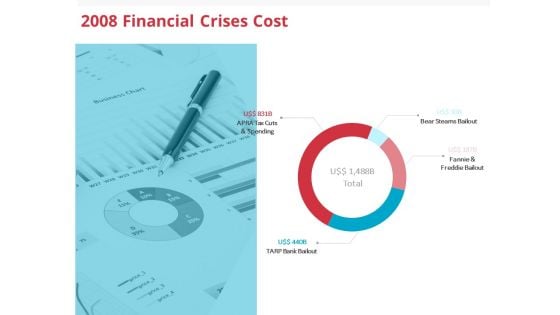
Global Financial Crisis 2008 2008 Financial Crises Cost Ppt Layouts Graphics PDF
Deliver an awe inspiring pitch with this creative global financial crisis 2008 2008 financial crises cost ppt layouts graphics pdf bundle. Topics like 2008 financial crises cost can be discussed with this completely editable template. It is available for immediate download depending on the needs and requirements of the user.
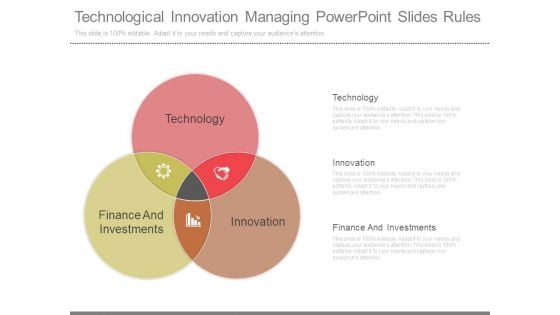
Technological Innovation Managing Powerpoint Slides Rules
This is a technological innovation managing powerpoint slides rules. This is a three stage process. The stages in this process are technology, finance and investments, innovation.
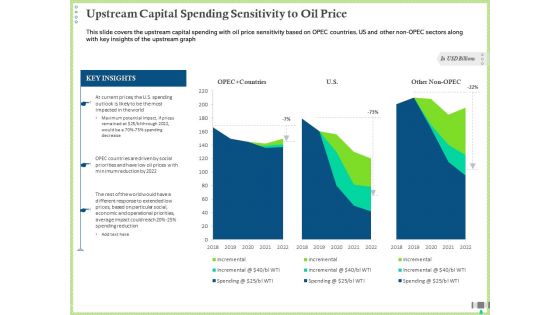
Post COVID Recovery Strategy Oil Gas Industry Upstream Capital Spending Sensitivity To Oil Price Background PDF
This slide covers the upstream capital spending with oil price sensitivity based on OPEC countries, US and other non-OPEC sectors along with key insights of the upstream graph. Deliver an awe inspiring pitch with this creative post covid recovery strategy oil gas industry upstream capital spending sensitivity to oil price background pdf bundle. Topics like upstream capital spending sensitivity to oil price can be discussed with this completely editable template. It is available for immediate download depending on the needs and requirements of the user.
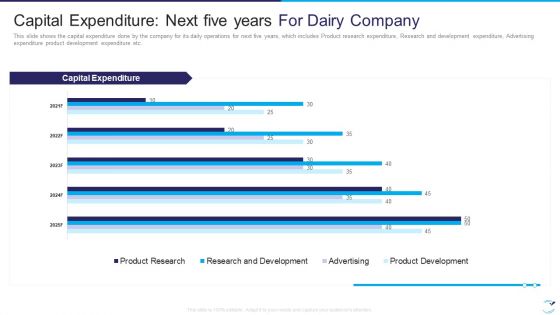
Factor Influencing User Experience Dairy Industry Capital Expenditure Next Five Years Designs PDF
This slide shows the capital expenditure done by the company for its daily operations for next five years, which includes Product research expenditure, Research and development expenditure, Advertising expenditure product development expenditure etc. Deliver an awe inspiring pitch with this creative factor influencing user experience dairy industry capital expenditure next five years designs pdf bundle. Topics like capital expenditure next five years for dairy company can be discussed with this completely editable template. It is available for immediate download depending on the needs and requirements of the user.
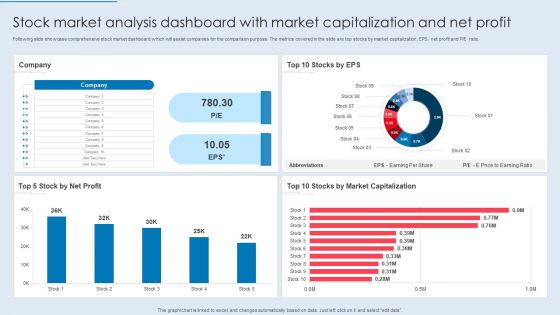
Stock Market Analysis Dashboard With Market Capitalization And Net Profit Elements PDF
Following slide showcase comprehensive stock market dashboard which will assist companies for the comparison purpose. The metrics covered in the slide are top stocks by market capitalization, EPS, net profit and PE ratio. Pitch your topic with ease and precision using this Stock Market Analysis Dashboard With Market Capitalization And Net Profit Elements PDF. This layout presents information on Company, Net Profit, Market Capitalization. It is also available for immediate download and adjustment. So, changes can be made in the color, design, graphics or any other component to create a unique layout.
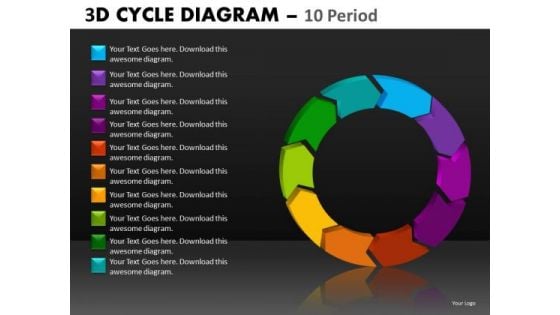
10 Points Cycle Diagram PowerPoint Slides Editable Ppt Templates
10 Points Cycle Diagram PowerPoint Slides Editable PPT templates-These high quality powerpoint pre-designed slides and powerpoint templates have been carefully created by our professional team to help you impress your audience. All slides have been created and are 100% editable in powerpoint. Each and every property of any graphic - color, size, orientation, shading, outline etc. can be modified to help you build an effective powerpoint presentation. Any text can be entered at any point in the powerpoint template or slide. Simply DOWNLOAD, TYPE and PRESENT! These PowerPoint presentation slides can be used to represent themes relating to --accountancy, accounting, accounts, analyze, asset, audit, auditing, balance, business, commercial, company, cost, credit, current, cycle, debit, documents, expense, financial, internal, inventory, journal, keeping, ledger, liability, loss, management, objective, organize, payment, plan, procedure, process, professional, profit, record, reports, statement, structure, tax, transaction, trial-10 Points Cycle Diagram PowerPoint Slides Editable PPT templates Your customer is the center of it all. Our 10 Points Cycle Diagram PowerPoint Slides Editable Ppt Templates will concentrate on him.
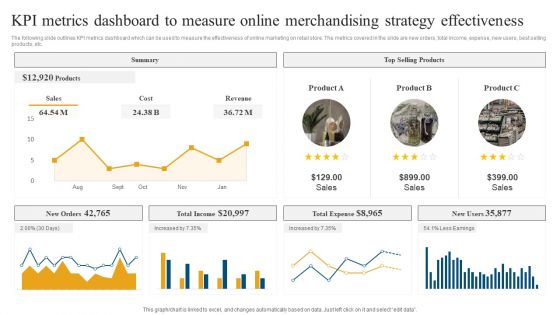
Retail Ecommerce Merchandising Tactics For Boosting Revenue KPI Metrics Dashboard To Measure Online Background PDF
The following slide outlines KPI metrics dashboard which can be used to measure the effectiveness of online marketing on retail store. The metrics covered in the slide are new orders, total income, expense, new users, best selling products, etc. Make sure to capture your audiences attention in your business displays with our gratis customizable Retail Ecommerce Merchandising Tactics For Boosting Revenue KPI Metrics Dashboard To Measure Online Background PDF. These are great for business strategies, office conferences, capital raising or task suggestions. If you desire to acquire more customers for your tech business and ensure they stay satisfied, create your own sales presentation with these plain slides.
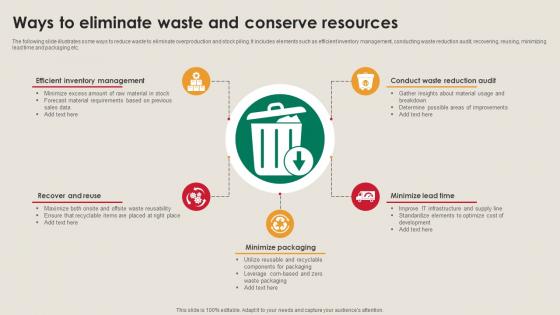
Ways To Eliminate Waste And Conserve Resources Manufacturing Strategy Driving Industry 4 0
The following slide illustrates some ways to reduce waste to eliminate overproduction and stock piling. It includes elements such as efficient inventory management, conducting waste reduction audit, recovering, reusing, minimizing lead time and packaging etc. Are you searching for a Ways To Eliminate Waste And Conserve Resources Manufacturing Strategy Driving Industry 4 0 that is uncluttered, straightforward, and original Its easy to edit, and you can change the colors to suit your personal or business branding. For a presentation that expresses how much effort you have put in, this template is ideal With all of its features, including tables, diagrams, statistics, and lists, its perfect for a business plan presentation. Make your ideas more appealing with these professional slides. Download Ways To Eliminate Waste And Conserve Resources Manufacturing Strategy Driving Industry 4 0 from Slidegeeks today. The following slide illustrates some ways to reduce waste to eliminate overproduction and stock piling. It includes elements such as efficient inventory management, conducting waste reduction audit, recovering, reusing, minimizing lead time and packaging etc.
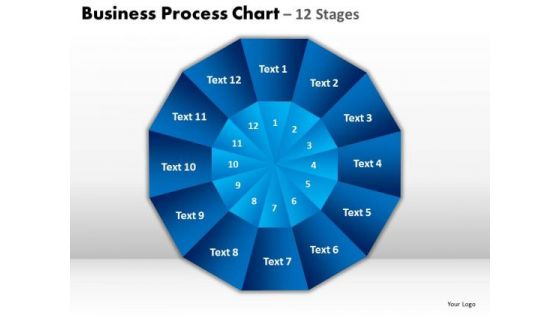
Business Finance Strategy Development Business Process Chart 12 Stages Sales Diagram
Analyse ailments on our Business Finance Strategy Development
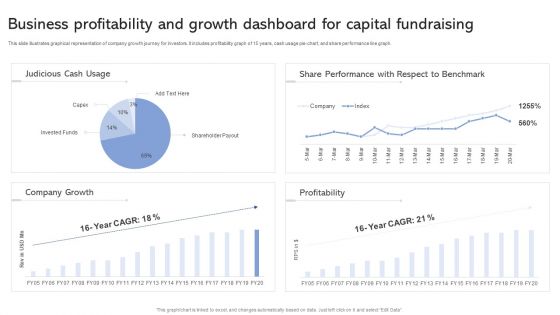
Business Profitability And Growth Dashboard For Capital Fundraising Ppt Slides Guide PDF
This slide illustrates graphical representation of company growth journey for investors. It includes profitability graph of 15 years, cash usage pie-chart, and share performance line graph. Showcasing this set of slides titled Business Profitability And Growth Dashboard For Capital Fundraising Ppt Slides Guide PDF. The topics addressed in these templates are Judicious Cash Usage, Share Performance, Respect To Benchmark. All the content presented in this PPT design is completely editable. Download it and make adjustments in color, background, font etc. as per your unique business setting.
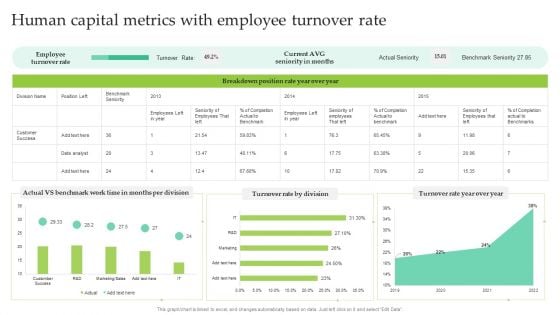
Human Capital Metrics With Employee Turnover Rate Ppt File Mockup PDF
This graph or chart is linked to excel, and changes automatically based on data. Just left click on it and select Edit Data. Showcasing this set of slides titled Human Capital Metrics With Employee Turnover Rate Ppt File Mockup PDF. The topics addressed in these templates are Employee Turnover Rate, Turnover Rate Division, Turnover Rate Year, Over Year. All the content presented in this PPT design is completely editable. Download it and make adjustments in color, background, font etc. as per your unique business setting.
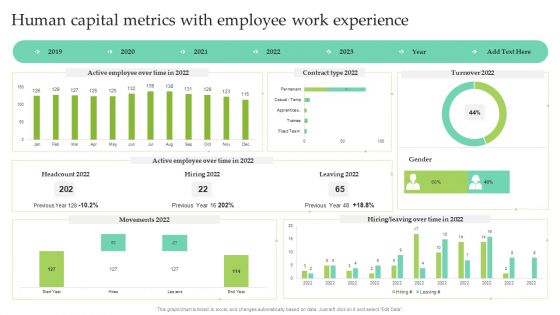
Human Capital Metrics With Employee Work Experience Ppt Show Images PDF
This graph or chart is linked to excel, and changes automatically based on data. Just left click on it and select Edit Data. Pitch your topic with ease and precision using this Human Capital Metrics With Employee Work Experience Ppt Show Images PDF. This layout presents information on Active Employee, Over Time, Contract Type 2022, Leaving 2022. It is also available for immediate download and adjustment. So, changes can be made in the color, design, graphics or any other component to create a unique layout.
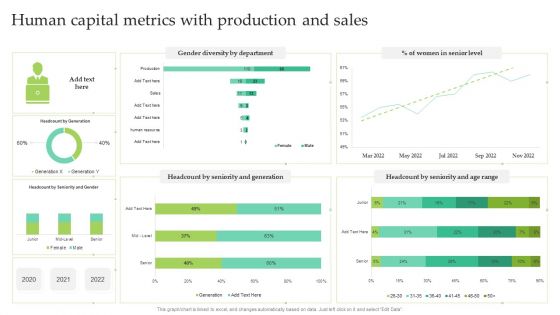
Human Capital Metrics With Production And Sales Ppt Infographic Template Summary PDF
This graph or chart is linked to excel, and changes automatically based on data. Just left click on it and select Edit Data. Showcasing this set of slides titled Human Capital Metrics With Production And Sales Ppt Infographic Template Summary PDF. The topics addressed in these templates are Women Senior Level, Gender Diversity Department, Seniority And Generation. All the content presented in this PPT design is completely editable. Download it and make adjustments in color, background, font etc. as per your unique business setting.
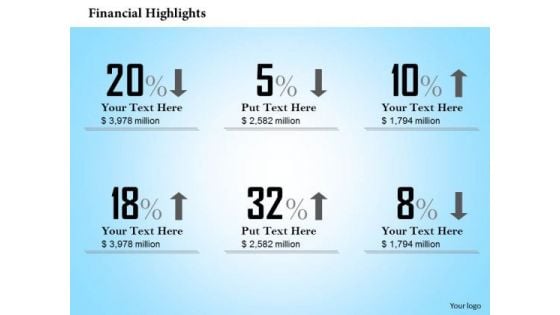
Marketing Diagram Financial Result Analysis Diagram Sales Diagram
Establish Your Dominion With Our Marketing Diagram Financial Result Analysis Diagram Sales Diagram Powerpoint Templates. Rule The Stage With Your Thoughts. Your Ideas Demand Attention. Our Marketing Diagram Financial Result Analysis Diagram Sales Diagram Powerpoint Templates Will Get It Done.
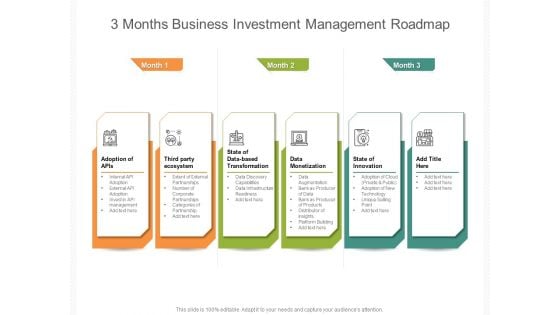
3 Months Business Investment Management Roadmap Ideas
Introducing our 3 months business investment management roadmap ideas. This PPT presentation is Google Slides compatible, therefore, you can share it easily with the collaborators for measuring the progress. Also, the presentation is available in both standard screen and widescreen aspect ratios. So edit the template design by modifying the font size, font type, color, and shapes as per your requirements. As this PPT design is fully editable it can be presented in PDF, JPG and PNG formats.
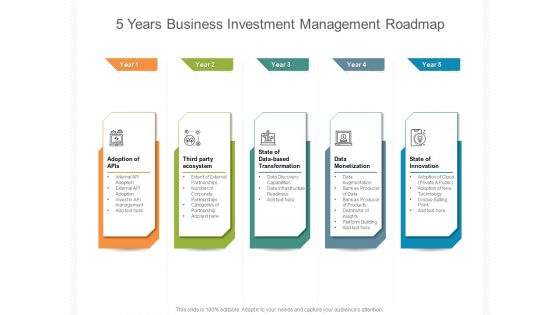
5 Years Business Investment Management Roadmap Slides
Introducing our 5 years business investment management roadmap slides. This PPT presentation is Google Slides compatible, therefore, you can share it easily with the collaborators for measuring the progress. Also, the presentation is available in both standard screen and widescreen aspect ratios. So edit the template design by modifying the font size, font type, color, and shapes as per your requirements. As this PPT design is fully editable it can be presented in PDF, JPG and PNG formats.
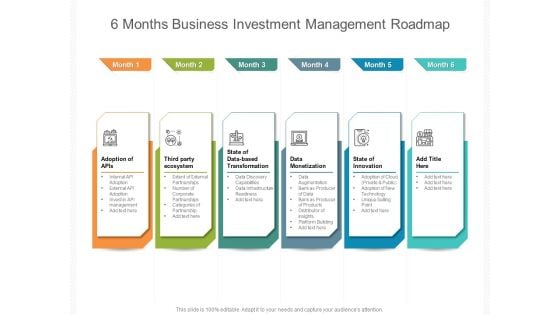
6 Months Business Investment Management Roadmap Pictures
Introducing our 6 months business investment management roadmap pictures. This PPT presentation is Google Slides compatible, therefore, you can share it easily with the collaborators for measuring the progress. Also, the presentation is available in both standard screen and widescreen aspect ratios. So edit the template design by modifying the font size, font type, color, and shapes as per your requirements. As this PPT design is fully editable it can be presented in PDF, JPG and PNG formats.
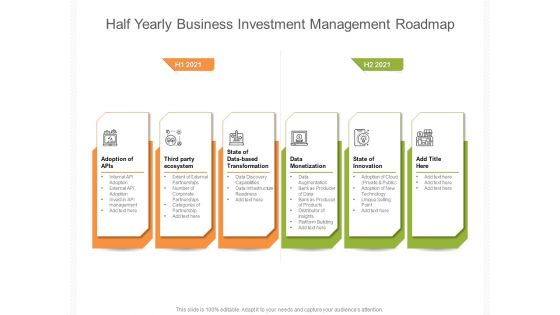
Half Yearly Business Investment Management Roadmap Guidelines
Introducing our half yearly business investment management roadmap guidelines. This PPT presentation is Google Slides compatible, therefore, you can share it easily with the collaborators for measuring the progress. Also, the presentation is available in both standard screen and widescreen aspect ratios. So edit the template design by modifying the font size, font type, color, and shapes as per your requirements. As this PPT design is fully editable it can be presented in PDF, JPG and PNG formats.
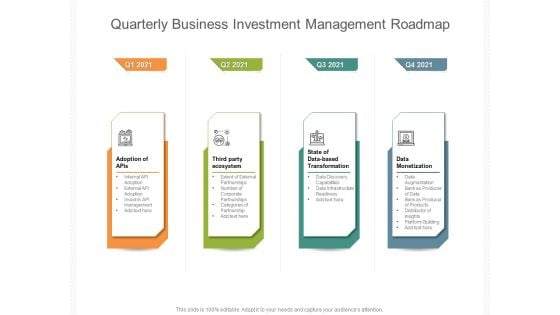
Quarterly Business Investment Management Roadmap Professional
Introducing our quarterly business investment management roadmap professional. This PPT presentation is Google Slides compatible, therefore, you can share it easily with the collaborators for measuring the progress. Also, the presentation is available in both standard screen and widescreen aspect ratios. So edit the template design by modifying the font size, font type, color, and shapes as per your requirements. As this PPT design is fully editable it can be presented in PDF, JPG and PNG formats.
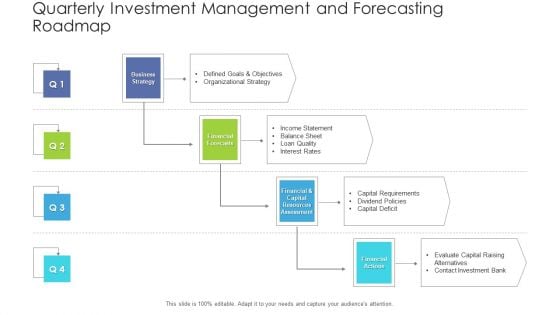
Quarterly Investment Management And Forecasting Roadmap Clipart
Introducing our quarterly investment management and forecasting roadmap clipart. This PPT presentation is Google Slides compatible, therefore, you can share it easily with the collaborators for measuring the progress. Also, the presentation is available in both standard screen and widescreen aspect ratios. So edit the template design by modifying the font size, font type, color, and shapes as per your requirements. As this PPT design is fully editable it can be presented in PDF, JPG and PNG formats.
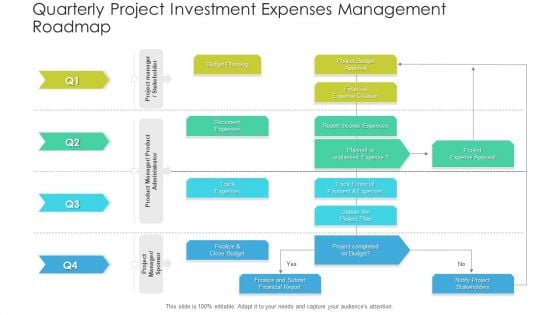
Quarterly Project Investment Expenses Management Roadmap Summary
Presenting our jaw dropping quarterly project investment expenses management roadmap summary. You can alternate the color, font size, font type, and shapes of this PPT layout according to your strategic process. This PPT presentation is compatible with Google Slides and is available in both standard screen and widescreen aspect ratios. You can also download this well researched PowerPoint template design in different formats like PDF, JPG, and PNG. So utilize this visually appealing design by clicking the download button given below.
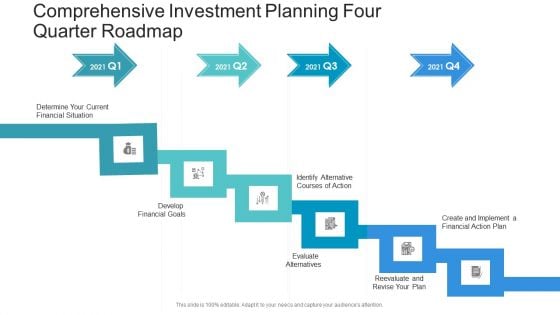
Comprehensive Investment Planning Four Quarter Roadmap Designs
Presenting our innovatively structured comprehensive investment planning four quarter roadmap designs Template. Showcase your roadmap process in different formats like PDF, PNG, and JPG by clicking the download button below. This PPT design is available in both Standard Screen and Widescreen aspect ratios. It can also be easily personalized and presented with modified font size, font type, color, and shapes to measure your progress in a clear way.
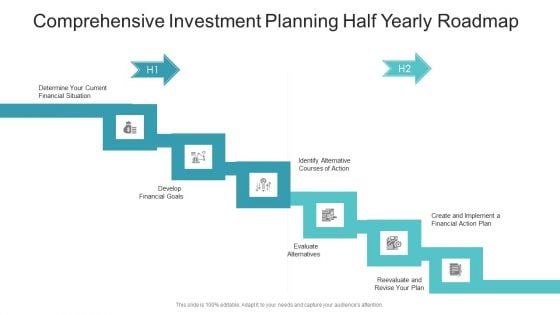
Comprehensive Investment Planning Half Yearly Roadmap Mockup
Introducing our comprehensive investment planning half yearly roadmap mockup. This PPT presentation is Google Slides compatible, therefore, you can share it easily with the collaborators for measuring the progress. Also, the presentation is available in both standard screen and widescreen aspect ratios. So edit the template design by modifying the font size, font type, color, and shapes as per your requirements. As this PPT design is fully editable it can be presented in PDF, JPG and PNG formats.
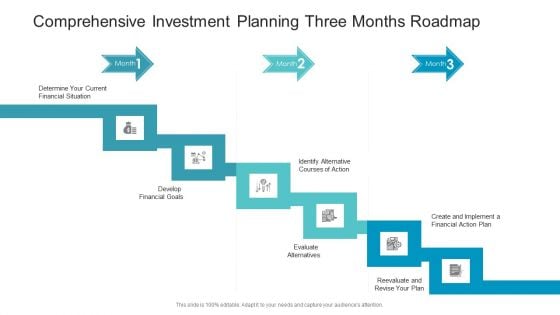
Comprehensive Investment Planning Three Months Roadmap Ideas
Presenting our jaw dropping comprehensive investment planning three months roadmap ideas. You can alternate the color, font size, font type, and shapes of this PPT layout according to your strategic process. This PPT presentation is compatible with Google Slides and is available in both standard screen and widescreen aspect ratios. You can also download this well researched PowerPoint template design in different formats like PDF, JPG, and PNG. So utilize this visually appealing design by clicking the download button given below.
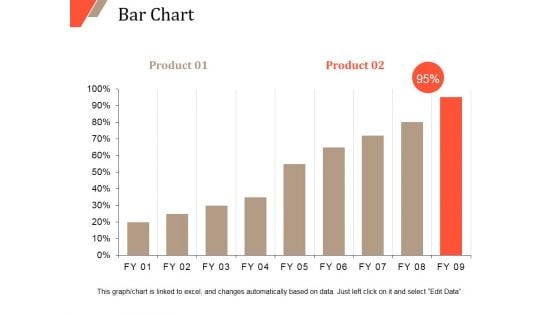
Bar Chart Ppt PowerPoint Presentation Outline Infographics
This is a bar chart ppt powerpoint presentation outline infographics. This is a two stage process. The stages in this process are bar chart, finance, marketing, strategy, analysis, business.
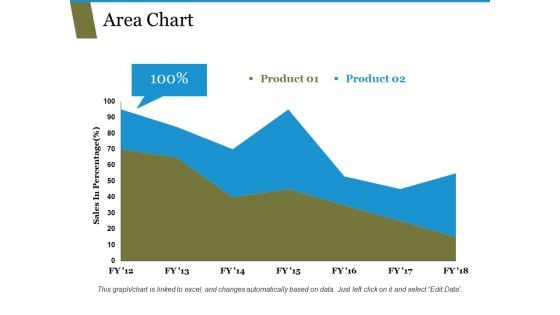
Area Chart Ppt PowerPoint Presentation Portfolio Templates
This is a area chart ppt powerpoint presentation portfolio templates. This is a two stage process. The stages in this process are sales in percentage, chart, business, marketing, finance.
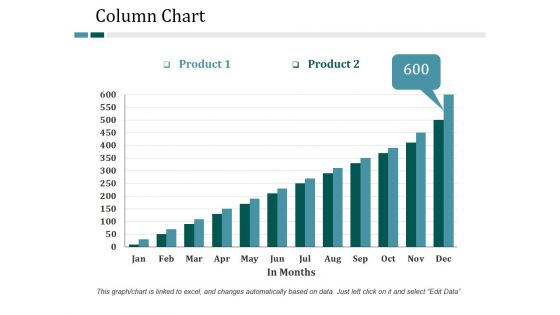
Column Chart Ppt PowerPoint Presentation File Show
This is a column chart ppt powerpoint presentation file show. This is a two stage process. The stages in this process are column chart, finance, marketing, growth, strategy, business.
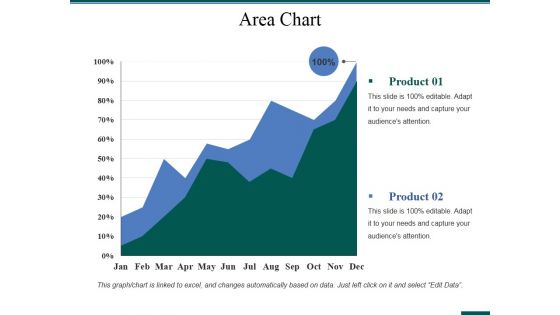
Area Chart Ppt PowerPoint Presentation Pictures Slideshow
This is a area chart ppt powerpoint presentation pictures slideshow. This is a two stage process. The stages in this process are area chart, finance, analysis, marketing, strategy, business.
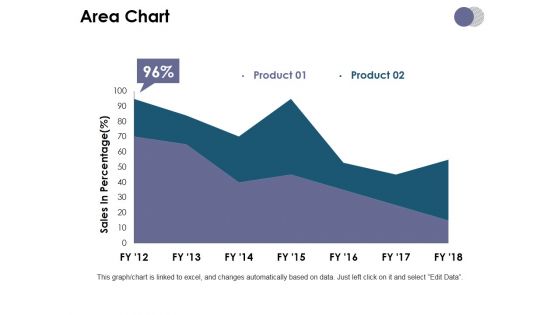
Area Chart Ppt PowerPoint Presentation Summary Format
This is a area chart ppt powerpoint presentation summary format. This is a two stage process. The stages in this process are area chart, planning, marketing, strategy, finance, business.
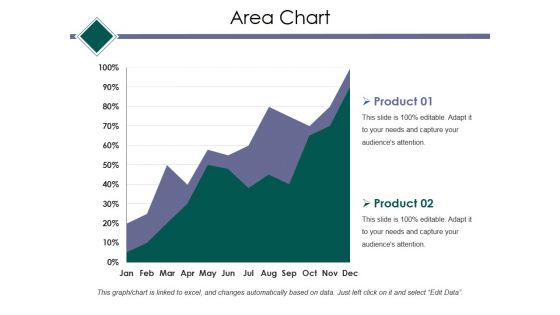
Area Chart Ppt PowerPoint Presentation Model Layout
This is a area chart ppt powerpoint presentation model layout. This is a two stage process. The stages in this process are area chart, finance, marketing, strategy, analysis, business.
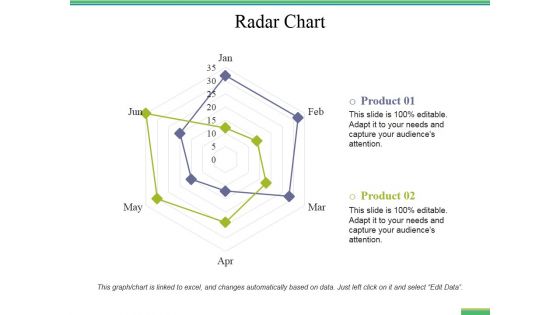
Radar Chart Ppt PowerPoint Presentation Ideas Slides
This is a radar chart ppt powerpoint presentation ideas slides. This is a two stage process. The stages in this process are radar chart, management, finance, marketing, strategy, business.
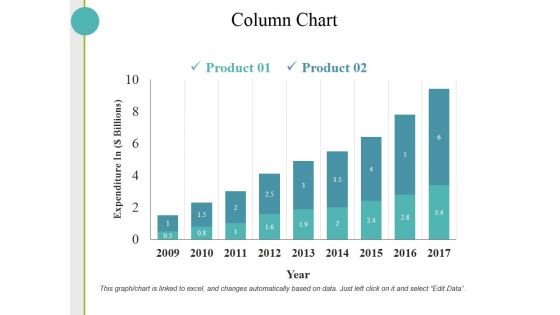
Column Chart Ppt PowerPoint Presentation Pictures Outfit
This is a column chart ppt powerpoint presentation pictures outfit. This is a two stage process. The stages in this process are column chart, finance, marketing, strategy, analysis, business.
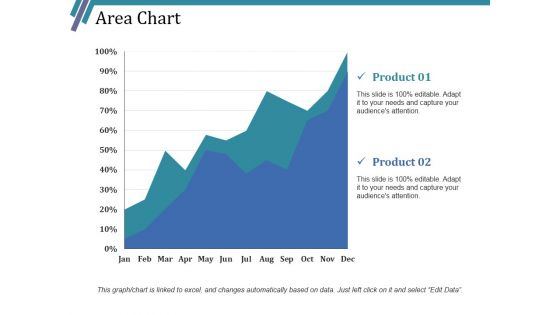
Area Chart Ppt PowerPoint Presentation Styles Templates
This is a area chart ppt powerpoint presentation styles templates. This is a two stage process. The stages in this process are area chart, growth, finance, marketing, strategy, analysis.
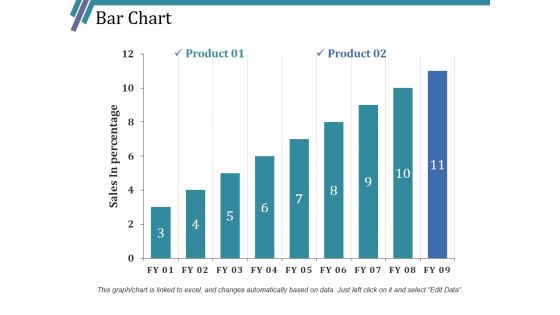
Bar Chart Ppt PowerPoint Presentation Styles Smartart
This is a bar chart ppt powerpoint presentation styles smartart. This is a two stage process. The stages in this process are bar chart, growth, finance, marketing, strategy, analysis.
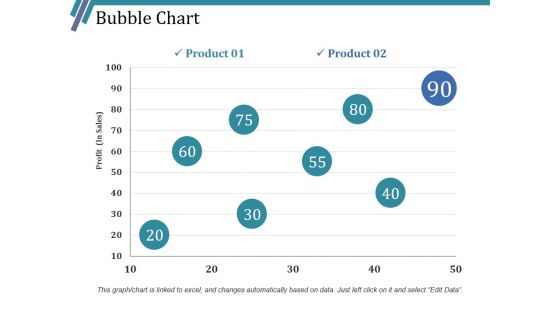
Bubble Chart Ppt PowerPoint Presentation Inspiration Picture
This is a bubble chart ppt powerpoint presentation inspiration picture. This is a two stage process. The stages in this process are bubble chart, growth, finance, marketing, strategy, analysis.
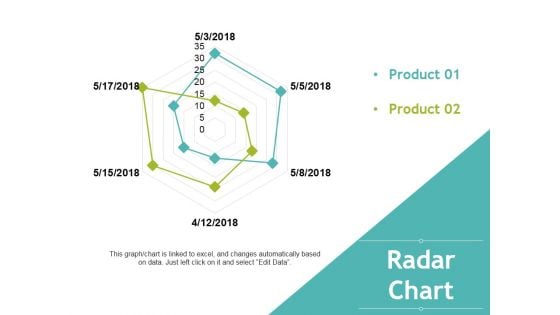
Radar Chart Ppt PowerPoint Presentation Professional Brochure
This is a radar chart ppt powerpoint presentation professional brochure. This is a two stage process. The stages in this process are radar chart, finance, marketing, strategy, analysis, business.
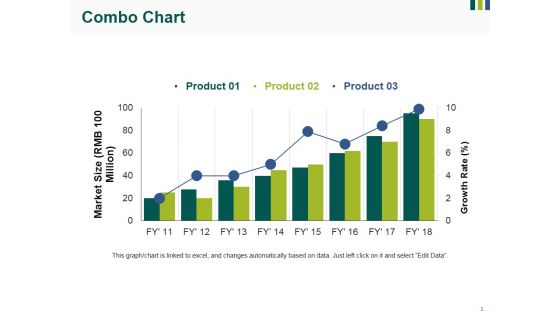
Combo Chart Ppt PowerPoint Presentation Inspiration Vector
This is a combo chart ppt powerpoint presentation inspiration vector. This is a three stage process. The stages in this process are combo chart, finance, marketing, strategy, analysis, business.
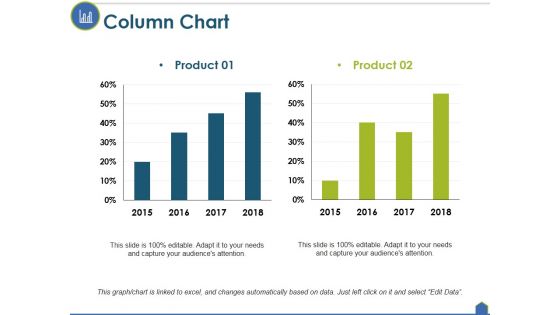
Column Chart Ppt PowerPoint Presentation Inspiration Good
This is a column chart ppt powerpoint presentation inspiration good. This is a two stage process. The stages in this process are column chart, finance, marketing, strategy, analysis, business.
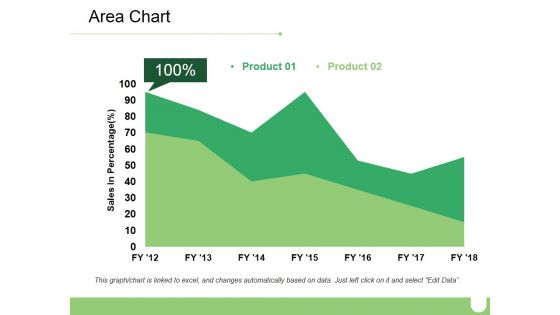
Area Chart Ppt PowerPoint Presentation Model Slides
This is a area chart ppt powerpoint presentation model slides. This is a two stage process. The stages in this process are business, marketing, sales in percentage, chart, percentage, finance.
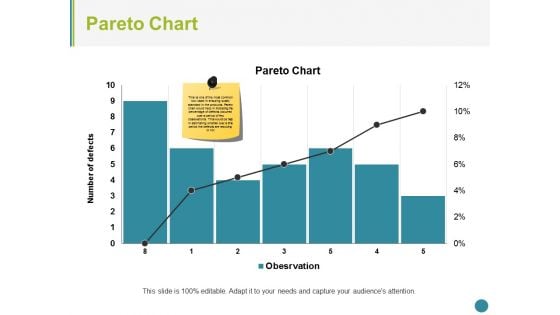
Pareto Chart Ppt PowerPoint Presentation Summary Structure
This is a pareto chart ppt powerpoint presentation summary structure. This is a seven stage process. The stages in this process are pareto chart, finance, marketing, strategy, analysis, business.
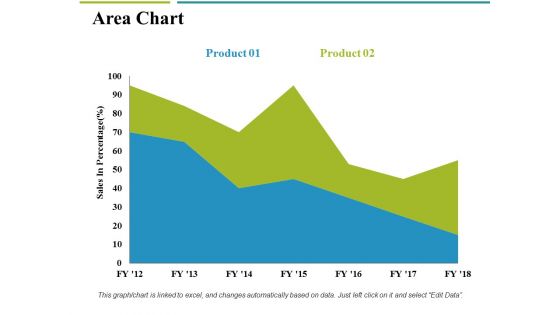
Area Chart Ppt PowerPoint Presentation Ideas Professional
This is a area chart ppt powerpoint presentation ideas professional. This is a two stage process. The stages in this process are business, sales in percentage, area chart, marketing, finance.
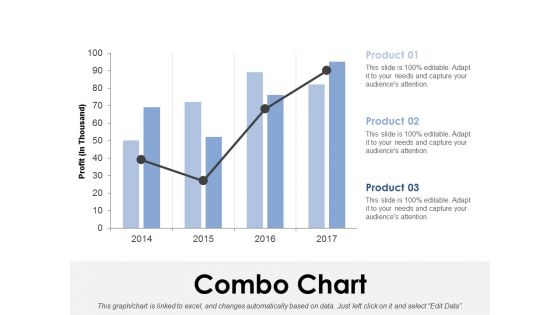
Combo Chart Ppt PowerPoint Presentation Infographics Sample
This is a combo chart ppt powerpoint presentation infographics sample. This is a three stage process. The stages in this process are combo chart, finance, analysis, marketing, strategy, business.
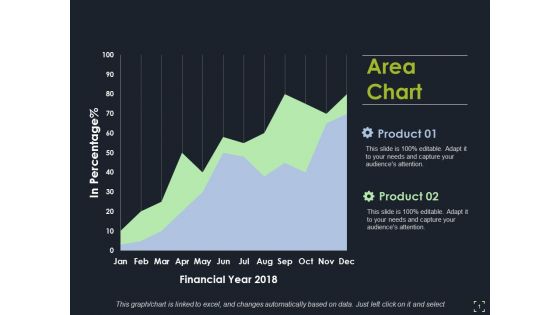
Area Chart Ppt PowerPoint Presentation Infographics Images
This is a area chart ppt powerpoint presentation infographics images. This is a two stage process. The stages in this process are area chart, finance, marketing, analysis, strategy, business.
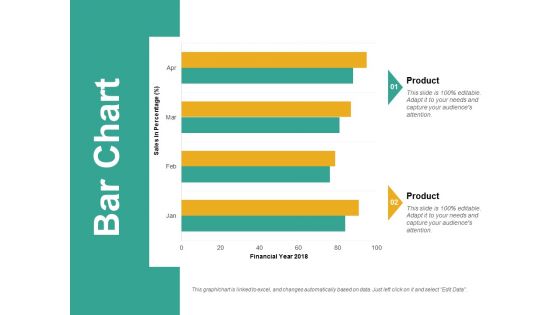
Bar Chart Ppt PowerPoint Presentation Slides Model
This is a bar chart ppt powerpoint presentation slides model. This is a two stage process. The stages in this process are bar chart, analysis, business, marketing, strategy, finance.
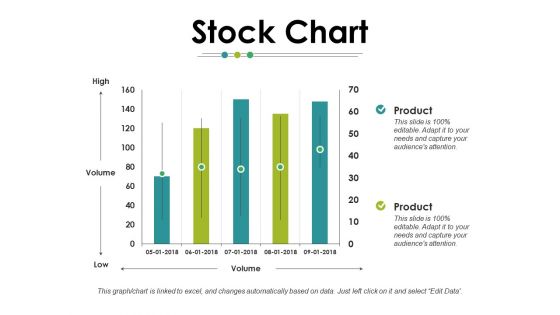
Stock Chart Ppt PowerPoint Presentation Infographics Smartart
This is a stock chart ppt powerpoint presentation infographics smartart. This is a two stages process. The stages in this process are stock chart, finance, business, planning, marketing, management.
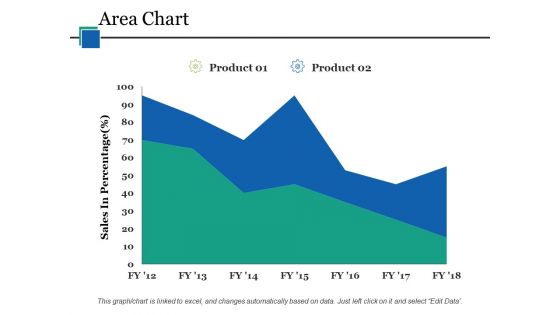
Area Chart Ppt PowerPoint Presentation Infographics Guide
This is a area chart ppt powerpoint presentation infographics guide. This is a two stage process. The stages in this process are area chart, product, sales in percentage, finance, business.

Crucial Dimensions And Structure Of CIO Transformation Decrease In IT Budget And Overall Cost Microsoft PDF
This slide shows the graph that shows the impact of successful CIO transition on of IT expenses and overall cost of the organization. Deliver an awe inspiring pitch with this creative Crucial Dimensions And Structure Of CIO Transformation Decrease In IT Budget And Overall Cost Microsoft PDF bundle. Topics like Expenses Decreased, Declined Further, Successful Transition can be discussed with this completely editable template. It is available for immediate download depending on the needs and requirements of the user.

Business Diagram Data Driven Pie Chart Inside The Magnifier PowerPoint Slide
This business slide displays 3d colorful pie graph with magnifier. This diagram is a data visualization tool that gives you a simple way to present statistical information. This slide helps your audience examine and interpret the data you present.
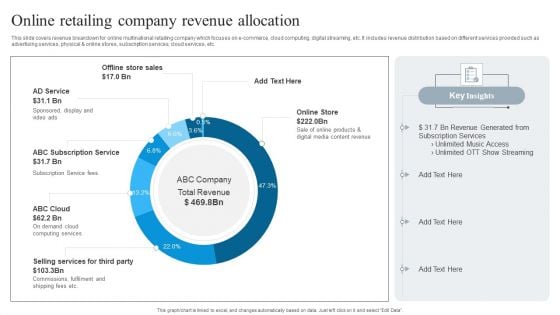
Online Retailing Company Revenue Allocation Rules PDF
This slide covers revenue breakdown for online multinational retailing company which focuses on e-commerce, cloud computing, digital streaming, etc. It includes revenue distribution based on different services provided such as advertising services, physical and online stores, subscription services, cloud services, etc. bShowcasing this set of slides titled Online Retailing Company Revenue Allocation Rules PDF. The topics addressed in these templates are Online Retailing, Company Revenue Allocation. All the content presented in this PPT design is completely editable. Download it and make adjustments in color, background, font etc. as per your unique business setting.
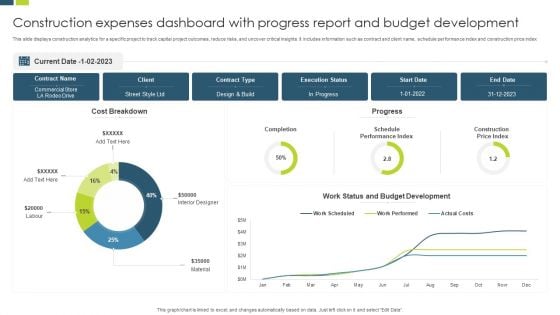
Construction Expenses Dashboard With Progress Report And Budget Development Background PDF
This slide displays construction analytics for a specific project to track capital project outcomes, reduce risks, and uncover critical insights. It includes information such as contract and client name, schedule performance index and construction price index. Showcasing this set of slides titled Construction Expenses Dashboard With Progress Report And Budget Development Background PDF. The topics addressed in these templates are Budget Development, Execution Status, Commercial Store. All the content presented in this PPT design is completely editable. Download it and make adjustments in color, background, font etc. as per your unique business setting.
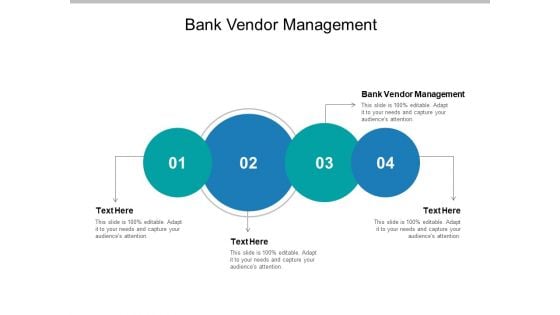
Bank Vendor Management Ppt PowerPoint Presentation Styles Vector Cpb
Presenting this set of slides with name bank vendor management ppt powerpoint presentation styles vector cpb. This is an editable Powerpoint four stages graphic that deals with topics like bank vendor management to help convey your message better graphically. This product is a premium product available for immediate download and is 100 percent editable in Powerpoint. Download this now and use it in your presentations to impress your audience.
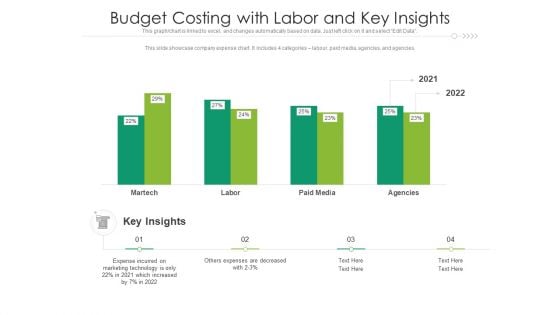
Budget Costing With Labor And Key Insights Ppt PowerPoint Presentation Styles Backgrounds PDF
Showcasing this set of slides titled budget costing with labor and key insights ppt powerpoint presentation styles backgrounds pdf. The topics addressed in these templates are expense incurred, marketing technology, others expenses are decreased . All the content presented in this PPT design is completely editable. Download it and make adjustments in color, background, font etc. as per your unique business setting.
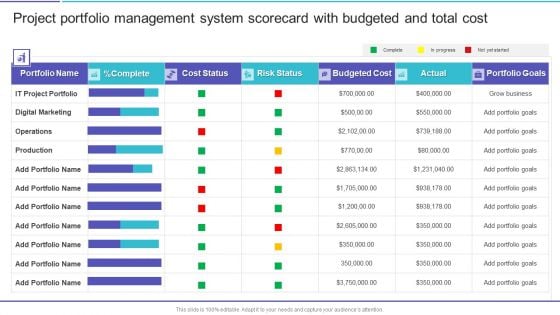
Project Portfolio Management System Scorecard With Budgeted And Total Cost Portrait PDF
Deliver an awe inspiring pitch with this creative Project Portfolio Management System Scorecard With Budgeted And Total Cost Portrait PDF bundle. Topics like Digital Marketing, Operations, Production can be discussed with this completely editable template. It is available for immediate download depending on the needs and requirements of the user.
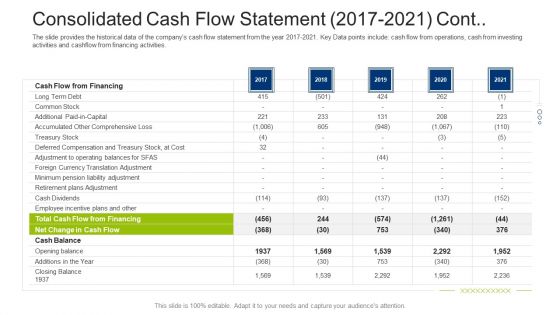
Investment Fundraising Pitch Deck From Stock Market Consolidated Cash Flow Statement 2017 2021 Cont Themes PDF
The slide provides the historical data of the companys cash flow statement from the year 2015-2019. Key Data points include cash flow from operations, cash from investing activities and cashflow from financing activities. Deliver an awe inspiring pitch with this creative investment fundraising pitch deck from stock market consolidated cash flow statement 2017 2021 cont themes pdf bundle. Topics like financing, treasury, incentive, plans, cash flow can be discussed with this completely editable template. It is available for immediate download depending on the needs and requirements of the user.
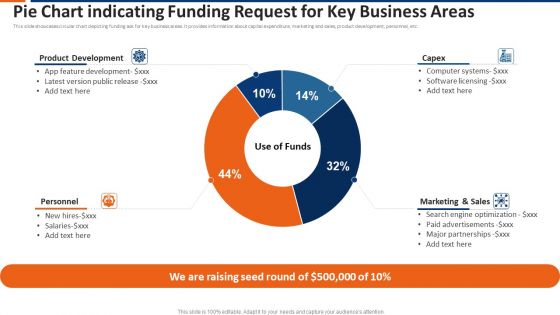
Pie Chart Indicating Funding Request For Key Business Areas Ppt Show Topics PDF
This slide showcases circular chart depicting funding ask for key business areas. It provides information about capital expenditure, marketing and sales, product development, personnel, etc. Pitch your topic with ease and precision using this pie chart indicating funding request for key business areas ppt show topics pdf. This layout presents information on product development, capex, marketing and sales, personnel. It is also available for immediate download and adjustment. So, changes can be made in the color, design, graphics or any other component to create a unique layout.

Business Graph With Dollars Success PowerPoint Themes And PowerPoint Slides 0711
Microsoft PowerPoint Theme and Slide with wooden graphic showing the percentage increase that leads to higher costs Grab the attention of your audience with our Business Graph With Dollars Success PowerPoint Themes And PowerPoint Slides 0711. Just download, type and present.
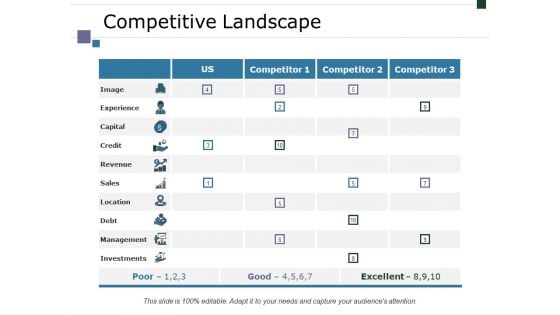
Competitive Landscape Ppt PowerPoint Presentation Styles Themes
This is a competitive landscape ppt powerpoint presentation styles themes. This is a three stage process. The stages in this process are image, experience, capital, credit, revenue.
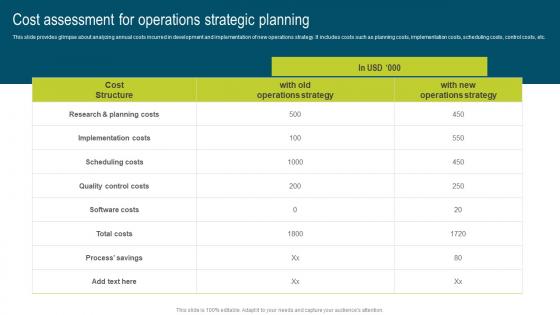
Cost Assessment For Operations Strategic Developing Extensive Plan For Operational Diagrams Pdf
This slide provides glimpse about analyzing annual costs incurred in development and implementation of new operations strategy. It includes costs such as planning costs, implementation costs, scheduling costs, control costs, etc. Whether you have daily or monthly meetings, a brilliant presentation is necessary. Cost Assessment For Operations Strategic Developing Extensive Plan For Operational Diagrams Pdf can be your best option for delivering a presentation. Represent everything in detail using Cost Assessment For Operations Strategic Developing Extensive Plan For Operational Diagrams Pdf and make yourself stand out in meetings. The template is versatile and follows a structure that will cater to your requirements. All the templates prepared by Slidegeeks are easy to download and edit. Our research experts have taken care of the corporate themes as well. So, give it a try and see the results. This slide provides glimpse about analyzing annual costs incurred in development and implementation of new operations strategy. It includes costs such as planning costs, implementation costs, scheduling costs, control costs, etc.
Dollar Chain Business PowerPoint Templates And PowerPoint Themes 0612
Dollar Chain Business PowerPoint Templates And PowerPoint Themes PPT Slides-Microsoft Powerpoint Templates and Background with chain with dollar symbol Our Dollar Chain Business PowerPoint Templates And PowerPoint Themes 0612 define the standards. Like you they excel at what they do.


 Continue with Email

 Home
Home


