Money Icon
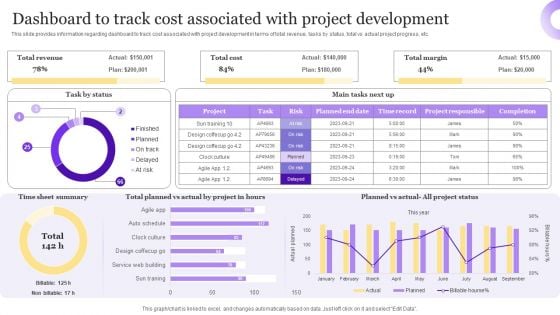
Best Techniques For Agile Project Cost Assessment Dashboard To Track Cost Associated Formats PDF
This slide provides information regarding dashboard to track cost associated with project development in terms of total revenue, tasks by status, total vs actual project progress, etc. Do you have an important presentation coming up Are you looking for something that will make your presentation stand out from the rest Look no further than Best Techniques For Agile Project Cost Assessment Dashboard To Track Cost Associated Formats PDF. With our professional designs, you can trust that your presentation will pop and make delivering it a smooth process. And with Slidegeeks, you can trust that your presentation will be unique and memorable. So why wait Grab Best Techniques For Agile Project Cost Assessment Dashboard To Track Cost Associated Formats PDF today and make your presentation stand out from the rest
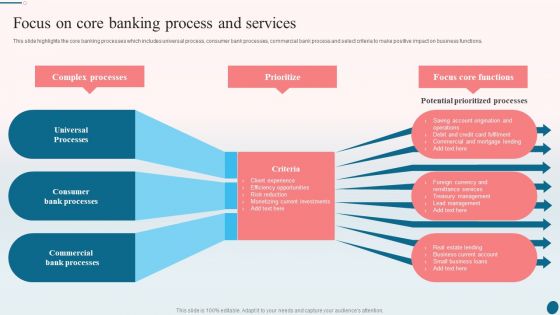
Banking Operations Management Focus On Core Banking Process And Services Diagrams PDF
This slide highlights the core banking processes which includes universal process, consumer bank processes, commercial bank process and select criteria to make positive impact on business functions. Presenting Banking Operations Management Focus On Core Banking Process And Services Diagrams PDF to provide visual cues and insights. Share and navigate important information on six stages that need your due attention. This template can be used to pitch topics like Potential Prioritized Processes, Universal Processes, Consumer Bank Processes. In addtion, this PPT design contains high resolution images, graphics, etc, that are easily editable and available for immediate download.

Three Months Effective Business Data Governance Execution Roadmap For Revenue Themes
We present our three months effective business data governance execution roadmap for revenue themes. This PowerPoint layout is easy to edit so you can change the font size, font type, color, and shape conveniently. In addition to this, the PowerPoint layout is Google Slides compatible, so you can share it with your audience and give them access to edit it. Therefore, download and save this well researched three months effective business data governance execution roadmap for revenue themes in different formats like PDF, PNG, and JPG to smoothly execute your business plan.
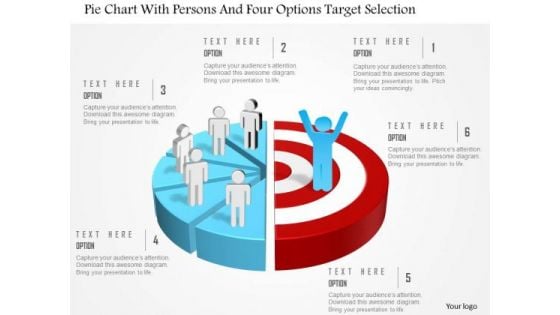
Business Diagram Pie Chart With Persons And Four Options Target Selection Presentation Template
This power point template slide has been crafted with graphic of pie chart ,persons and four options. This PPT contains the concept of option representation for targets selection. This PPT diagram is can be used business and sales presentations.
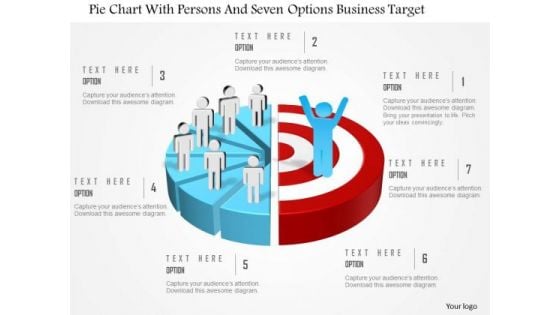
Business Diagram Pie Chart With Persons And Seven Options Business Target Presentation Template
This power point template slide has been crafted with graphic of pie chart ,persons and seven options. This PPT contains the concept of option representation for business targets. This PPT diagram is can be used business and marketing presentations.
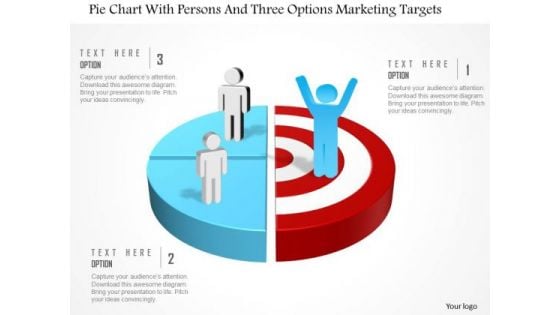
Business Diagram Pie Chart With Persons And Three Options Marketing Targets Presentation Template
This power point template slide has been crafted with graphic of pie chart and three persons. This PPT contains the concept of option representation for marketing targets. This PPT diagram is suitable for marketing presentations.
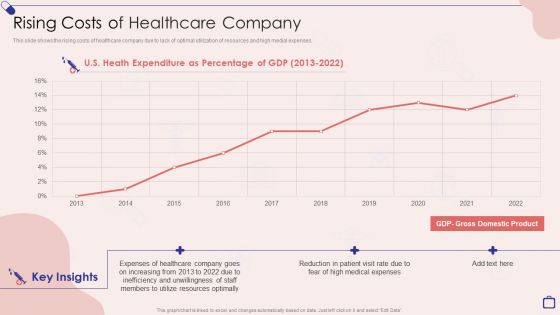
Implementing Integrated Software Rising Costs Of Healthcare Company Template PDF
This slide shows the rising costs of healthcare company due to lack of optimal utilization of resources and high medial expenses.Deliver and pitch your topic in the best possible manner with this Implementing Integrated Software Rising Costs Of Healthcare Company Template PDF. Use them to share invaluable insights on Expenses Healthcare, Unwillingness Staff, Resources Optimally and impress your audience. This template can be altered and modified as per your expectations. So, grab it now.
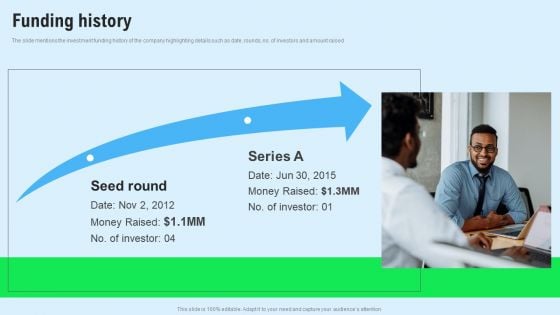
Chat Messenger Investor Funding Elevator Pitch Deck Funding History Themes PDF
The slide mentions the investment funding history of the company highlighting details such as date, rounds, no. of investors and amount raised. There are so many reasons you need a Chat Messenger Investor Funding Elevator Pitch Deck Funding History Themes PDF. The first reason is you can not spend time making everything from scratch, Thus, Slidegeeks has made presentation templates for you too. You can easily download these templates from our website easily.
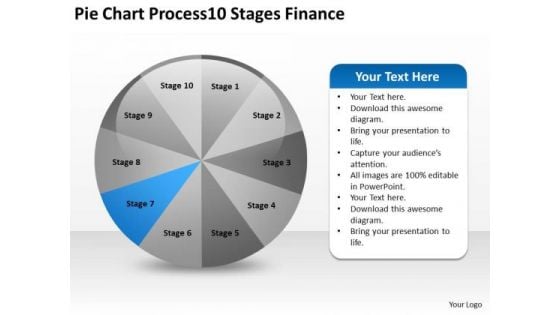
Pie Chart Process 10 Stages Finance Building Business Plan PowerPoint Slides
We present our pie chart process 10 stages finance building business plan PowerPoint Slides.Download and present our Business PowerPoint Templates because You have gained great respect for your brilliant ideas. Use our PowerPoint Templates and Slides to strengthen and enhance your reputation. Present our Flow Charts PowerPoint Templates because Our PowerPoint Templates and Slides will bullet point your ideas. See them fall into place one by one. Use our Marketing PowerPoint Templates because You are working at that stage with an air of royalty. Let our PowerPoint Templates and Slides be the jewels in your crown. Present our Circle Charts PowerPoint Templates because You can Stir your ideas in the cauldron of our PowerPoint Templates and Slides. Cast a magic spell on your audience. Download and present our Process and Flows PowerPoint Templates because They will Put the wind in your sails. Skim smoothly over the choppy waters of the market.Use these PowerPoint slides for presentations relating to Chart, pie, diagram, market, sales, achievement, corporate, business, sign, render, success, presentation, circle, graphic, report, marketing, shape, graph, illustration, piece, division, growth, company, progress, profit, part, information, financial. The prominent colors used in the PowerPoint template are Blue, Gray, White. Our Pie Chart Process 10 Stages Finance Building Business Plan PowerPoint Slides are highly esteemed. They have jump started many a career.
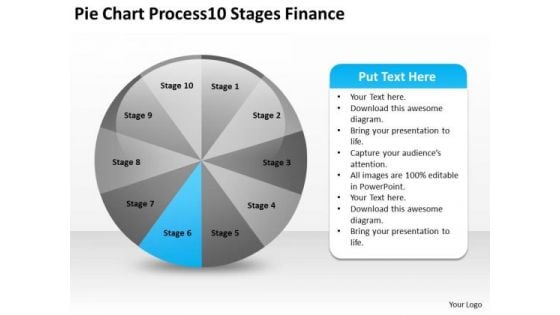
Pie Chart Process 10 Stages Finance Business Plan Form PowerPoint Templates
We present our pie chart process 10 stages finance business plan form PowerPoint templates.Use our Business PowerPoint Templates because Our PowerPoint Templates and Slides help you pinpoint your timelines. Highlight the reasons for your deadlines with their use. Download our Flow Charts PowerPoint Templates because You are an avid believer in ethical practices. Highlight the benefits that accrue with our PowerPoint Templates and Slides. Download and present our Marketing PowerPoint Templates because Our PowerPoint Templates and Slides has conjured up a web of all you need with the help of our great team. Use them to string together your glistening ideas. Download our Circle Charts PowerPoint Templates because You have gained great respect for your brilliant ideas. Use our PowerPoint Templates and Slides to strengthen and enhance your reputation. Download and present our Process and Flows PowerPoint Templates because Timeline crunches are a fact of life. Meet all deadlines using our PowerPoint Templates and Slides.Use these PowerPoint slides for presentations relating to Chart, pie, diagram, market, sales, achievement, corporate, business, sign, render, success, presentation, circle, graphic, report, marketing, shape, graph, illustration, piece, division, growth, company, progress, profit, part, information, financial. The prominent colors used in the PowerPoint template are Blue, Gray, White. Evaluate options with our Pie Chart Process 10 Stages Finance Business Plan Form PowerPoint Templates. Discern the best course of action to follow.
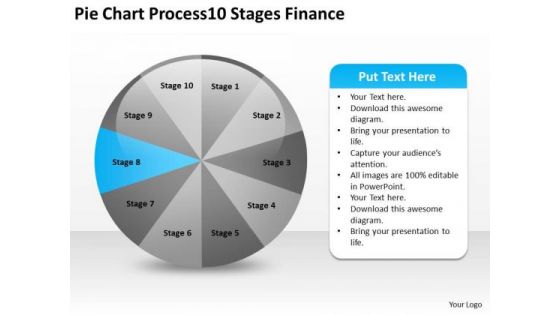
Pie Chart Process 10 Stages Finance Business Plan Sample PowerPoint Templates
We present our pie chart process 10 stages finance business plan sample PowerPoint templates.Use our Process and Flows PowerPoint Templates because These PowerPoint Templates and Slides will give the updraft to your ideas. See them soar to great heights with ease. Use our Business PowerPoint Templates because Our PowerPoint Templates and Slides will fulfill your every need. Use them and effectively satisfy the desires of your audience. Download our Circle Charts PowerPoint Templates because Your ideas provide food for thought. Our PowerPoint Templates and Slides will help you create a dish to tickle the most discerning palate. Download our Marketing PowerPoint Templates because Our PowerPoint Templates and Slides are innately eco-friendly. Their high recall value negate the need for paper handouts. Use our Flow Charts PowerPoint Templates because It is Aesthetically crafted by artistic young minds. Our PowerPoint Templates and Slides are designed to display your dexterity.Use these PowerPoint slides for presentations relating to Chart, pie, diagram, market, sales, achievement, corporate, business, sign, render, success, presentation, circle, graphic, report, marketing, shape, graph, illustration, piece, division, growth, company, progress, profit, part, information, financial. The prominent colors used in the PowerPoint template are Blue, Gray, White. With our Pie Chart Process 10 Stages Finance Business Plan Sample PowerPoint Templates fatigue is never an issue. They ensure you do not even come close to it.
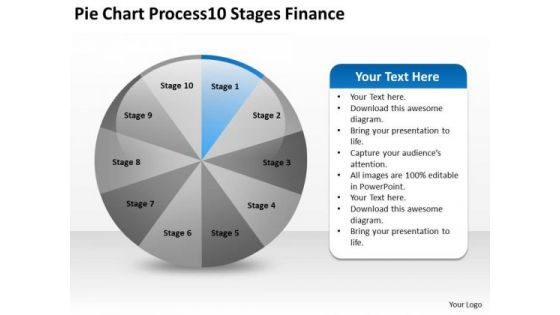
Pie Chart Process 10 Stages Finance Business Plan Template PowerPoint Slides
We present our pie chart process 10 stages finance business plan template PowerPoint Slides.Download our Process and Flows PowerPoint Templates because Our PowerPoint Templates and Slides will weave a web of your great ideas. They are gauranteed to attract even the most critical of your colleagues. Present our Business PowerPoint Templates because Watching this your Audience will Grab their eyeballs, they wont even blink. Use our Circle Charts PowerPoint Templates because Our PowerPoint Templates and Slides will embellish your thoughts. See them provide the desired motivation to your team. Use our Marketing PowerPoint Templates because Timeline crunches are a fact of life. Meet all deadlines using our PowerPoint Templates and Slides. Download and present our Flow Charts PowerPoint Templates because Our PowerPoint Templates and Slides will let you Clearly mark the path for others to follow.Use these PowerPoint slides for presentations relating to Chart, pie, diagram, market, sales, achievement, corporate, business, sign, render, success, presentation, circle, graphic, report, marketing, shape, graph, illustration, piece, division, growth, company, progress, profit, part, information, financial. The prominent colors used in the PowerPoint template are Blue light, Gray, White. Grab this opportunity to present with our Pie Chart Process 10 Stages Finance Business Plan Template PowerPoint Slides. Try us out and see what a difference our templates make.
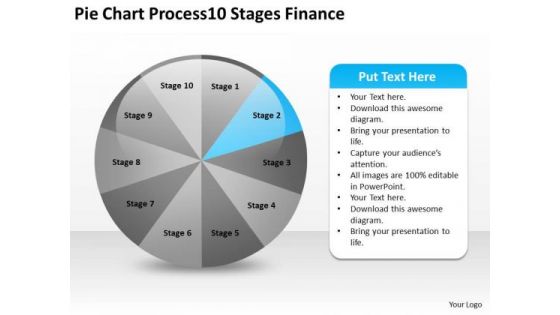
Pie Chart Process 10 Stages Finance Create Business Plan Template PowerPoint Templates
We present our pie chart process 10 stages finance create business plan template PowerPoint templates.Present our Process and Flows PowerPoint Templates because They will Put your wonderful verbal artistry on display. Our PowerPoint Templates and Slides will provide you the necessary glam and glitter. Download and present our Business PowerPoint Templates because You can Channelise the thoughts of your team with our PowerPoint Templates and Slides. Urge them to focus on the goals you have set. Download our Circle Charts PowerPoint Templates because You are an avid believer in ethical practices. Highlight the benefits that accrue with our PowerPoint Templates and Slides. Present our Marketing PowerPoint Templates because You can Double your output with our PowerPoint Templates and Slides. They make beating deadlines a piece of cake. Download our Flow Charts PowerPoint Templates because Our PowerPoint Templates and Slides will provide you the cutting edge. Slice through the doubts in the minds of your listeners.Use these PowerPoint slides for presentations relating to Chart, pie, diagram, market, sales, achievement, corporate, business, sign, render, success, presentation, circle, graphic, report, marketing, shape, graph, illustration, piece, division, growth, company, progress, profit, part, information, financial. The prominent colors used in the PowerPoint template are Blue light, Gray, White. Decide your own fate with our Pie Chart Process 10 Stages Finance Create Business Plan Template PowerPoint Templates. Create your destiny with your thoughts.
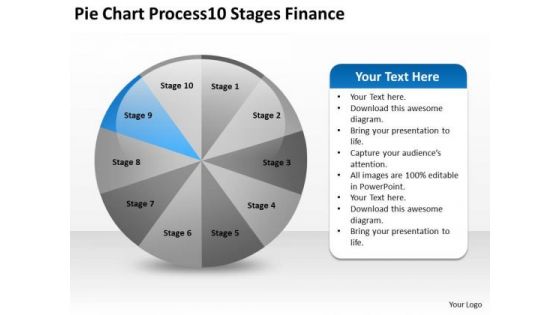
Pie Chart Process 10 Stages Finance Creating Small Business Plan PowerPoint Slides
We present our pie chart process 10 stages finance creating small business plan PowerPoint Slides.Download our Process and Flows PowerPoint Templates because Our PowerPoint Templates and Slides will embellish your thoughts. See them provide the desired motivation to your team. Present our Business PowerPoint Templates because Watching this your Audience will Grab their eyeballs, they wont even blink. Download our Circle Charts PowerPoint Templates because Our PowerPoint Templates and Slides will Activate the energies of your audience. Get their creative juices flowing with your words. Use our Marketing PowerPoint Templates because Our PowerPoint Templates and Slides will fulfill your every need. Use them and effectively satisfy the desires of your audience. Download and present our Flow Charts PowerPoint Templates because You should Bet on your luck with our PowerPoint Templates and Slides. Be assured that you will hit the jackpot.Use these PowerPoint slides for presentations relating to Chart, pie, diagram, market, sales, achievement, corporate, business, sign, render, success, presentation, circle, graphic, report, marketing, shape, graph, illustration, piece, division, growth, company, progress, profit, part, information, financial. The prominent colors used in the PowerPoint template are Blue, Gray, White. Take your audience on a fantastic journey. Allow them entry with our Pie Chart Process 10 Stages Finance Creating Small Business Plan PowerPoint Slides.
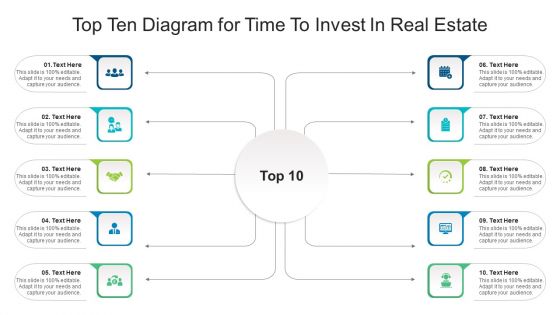
Top Ten Diagram For Time To Invest In Real Estate Ppt PowerPoint Presentation Pictures Microsoft PDF
Persuade your audience using this top ten diagram for time to invest in real estate ppt powerpoint presentation pictures microsoft pdf. This PPT design covers ten stages, thus making it a great tool to use. It also caters to a variety of topics including top ten diagram for time to invest in real estate. Download this PPT design now to present a convincing pitch that not only emphasizes the topic but also showcases your presentation skills.
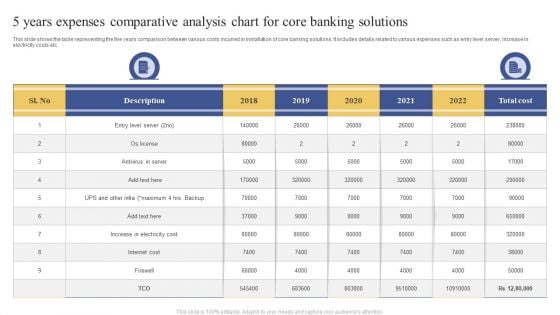
5 Years Expenses Comparative Analysis Chart For Core Banking Solutions Ppt Portfolio Clipart Images PDF
This slide shows the table representing the five years comparison between various costs incurred in installation of core banking solutions. It includes details related to various expenses such as entry level server, increase in electricity costs etc. Pitch your topic with ease and precision using this 5 Years Expenses Comparative Analysis Chart For Core Banking Solutions Ppt Portfolio Clipart Images PDF. This layout presents information on Entry Level Server, Antivirus Server, Increase Electricity Cost. It is also available for immediate download and adjustment. So, changes can be made in the color, design, graphics or any other component to create a unique layout.
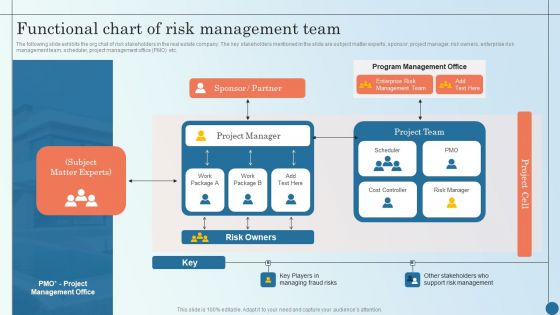
Functional Chart Of Risk Management Team Managing Commercial Property Risks Portrait PDF
The following slide exhibits the org chat of risk stakeholders in the real estate company. The key stakeholders mentioned in the slide are subject matter experts, sponsor, project manager, risk owners, enterprise risk management team, scheduler, project management office PMO etc. Deliver and pitch your topic in the best possible manner with this Functional Chart Of Risk Management Team Managing Commercial Property Risks Portrait PDF. Use them to share invaluable insights on Project Manager, Risk Manager, Risk Management and impress your audience. This template can be altered and modified as per your expectations. So, grab it now.
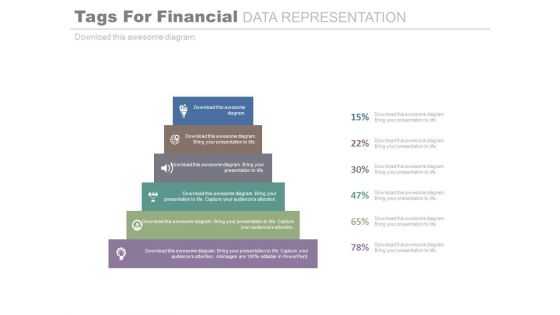
Six Steps Diagram For Financial Ratio Analysis Powerpoint Slides
This PowerPoint template contains six steps infographic diagram. You may download this PPT slide design to display financial ratio analysis. You can easily customize this template to make it more unique as per your need.
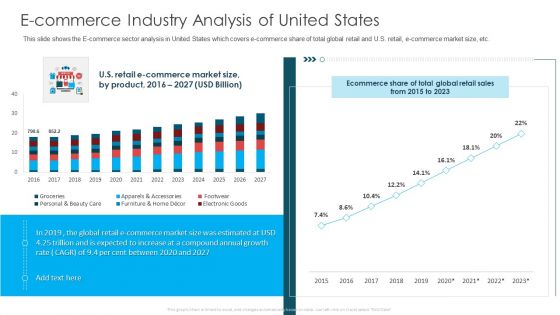
E Commerce Industry Analysis Of United States Ppt Layouts Format PDF
This slide shows the E-commerce sector analysis in United States which covers e-commerce share of total global retail and U.S. retail, e-commerce market size, etc. Deliver an awe-inspiring pitch with this creative e commerce industry analysis of united states ppt layouts format pdf bundle. Topics like retail e commerce market, ecommerce share, annual growth rate can be discussed with this completely editable template. It is available for immediate download depending on the needs and requirements of the user.
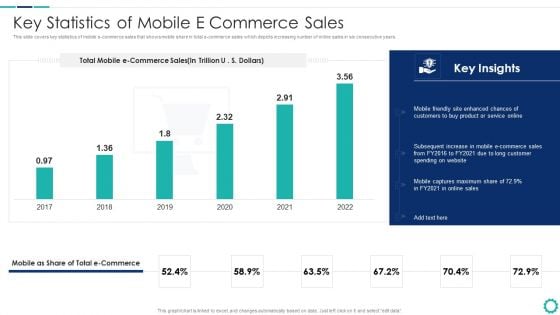
Creating Successful Strategies To Enhance Customer Experience Key Statistics Of Mobile E Commerce Sales Brochure PDF
This slide covers key statistics of mobile e-commerce sales that shows mobile share in total e-commerce sales which depicts increasing number of online sales in six consecutive years.Deliver an awe inspiring pitch with this creative Creating Successful Strategies To Enhance Customer Experience Key Statistics Of Mobile E Commerce Sales Brochure PDF bundle. Topics like Subsequent Increase, Commerce Sales, Enhanced Chances can be discussed with this completely editable template. It is available for immediate download depending on the needs and requirements of the user.
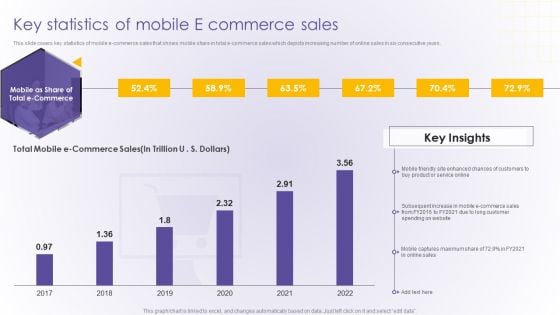
Key Statistics Of Mobile E Commerce Sales Developing Online Consumer Engagement Program Infographics PDF
This slide covers key statistics of mobile e commerce sales that shows mobile share in total e commerce sales which depicts increasing number of online sales in six consecutive years.Deliver an awe inspiring pitch with this creative Key Statistics Of Mobile E Commerce Sales Developing Online Consumer Engagement Program Infographics PDF bundle. Topics like Subsequent Increase, Ecommerce Sales, Captures Maximum can be discussed with this completely editable template. It is available for immediate download depending on the needs and requirements of the user.
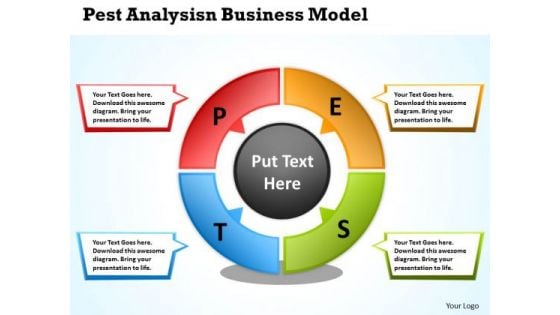
Pest Analysis Business Model Cycle Process Chart PowerPoint Templates
We present our pest analysis business model Cycle Process Chart PowerPoint templates.Download and present our Marketing PowerPoint Templates because customer satisfaction is a mantra of the marketplace. Building a loyal client base is an essential element of your business. Download our Business PowerPoint Templates because this slide represents the tools of the trade. Download and present our Leadership PowerPoint Templates because the mind is always whirring with new ideas. Present our Circle Charts PowerPoint Templates because you can Place them where they need to be. Download and present our Shapes PowerPoint Templates because you can Focus on each one and investigate which one would be the best fit for your needs.Use these PowerPoint slides for presentations relating to Analysis, Analyze, Blackboard, Board, Business, Chalk, Chalkboard, Chart, Component, Concept, Diagram, Direction, Economic, Education, Environmental, Factors, Framework, Graph, Graphics, Illustration, Law, Leadership, Management, Market, Market, Research, Model, Operations, Pest, Political, Position, Potential. The prominent colors used in the PowerPoint template are Red, Yellow, Green. We assure you our pest analysis business model Cycle Process Chart PowerPoint templates are Lush. Customers tell us our Board PowerPoint templates and PPT Slides are incredible easy to use. The feedback we get is that our pest analysis business model Cycle Process Chart PowerPoint templates are Fantastic. We assure you our Blackboard PowerPoint templates and PPT Slides are Perfect. People tell us our pest analysis business model Cycle Process Chart PowerPoint templates are the best it can get when it comes to presenting. We assure you our Chalk PowerPoint templates and PPT Slides look good visually. Assist the audience to comprehend with our Pest Analysis Business Model Cycle Process Chart PowerPoint Templates. They will always be in your debt.
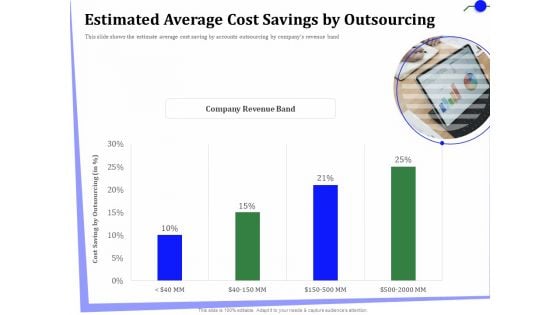
Outsourcing Of Finance And Accounting Processes Estimated Average Cost Savings By Outsourcing Graphics PDF
Presenting this set of slides with name outsourcing of finance and accounting processes estimated average cost savings by outsourcing graphics pdf. The topics discussed in these slide is estimated average cost savings by outsourcing. This is a completely editable PowerPoint presentation and is available for immediate download. Download now and impress your audience.
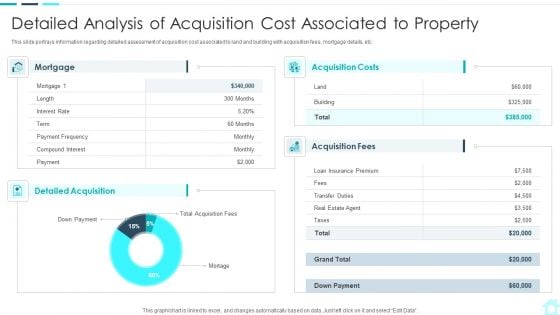
Real Estate Assets Financing Analysis Detailed Analysis Of Acquisition Cost Associated Introduction PDF
Deliver and pitch your topic in the best possible manner with this real estate assets financing analysis detailed analysis of acquisition cost associated introduction pdf. Use them to share invaluable insights on premium, acquisition costs, interest rate, payment and impress your audience. This template can be altered and modified as per your expectations. So, grab it now.
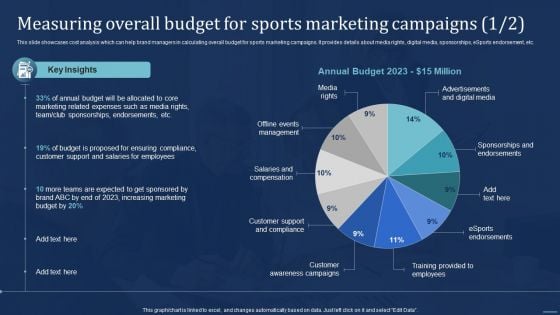
Integrating Sports Marketing Campaign Measuring Overall Budget For Sports Marketing Ideas PDF
This slide showcases cost analysis which can help brand managers in calculating overall budget for sports marketing campaigns. It provides details about media rights, digital media, sponsorships, eSports endorsement, etc. Whether you have daily or monthly meetings, a brilliant presentation is necessary. Integrating Sports Marketing Campaign Measuring Overall Budget For Sports Marketing Ideas PDF can be your best option for delivering a presentation. Represent everything in detail using Integrating Sports Marketing Campaign Measuring Overall Budget For Sports Marketing Ideas PDF and make yourself stand out in meetings. The template is versatile and follows a structure that will cater to your requirements. All the templates prepared by Slidegeeks are easy to download and edit. Our research experts have taken care of the corporate themes as well. So, give it a try and see the results.

Business Plan Methods Tools And Templates Set 2 PESTEL Analysis Diverging Radial Diagram Summary PDF
This slide displays PESTEL analysis used by organization as a strategic management tool to identify and analyze the impact of external factors on its business. External factors included in this slide are political, economic, social. Technological, environmental and legal. This is a business plan methods tools and templates set 2 pestel analysis diverging radial diagram summary pdf template with various stages. Focus and dispense information on six stages using this creative set, that comes with editable features. It contains large content boxes to add your information on topics like legal, environment, technology, social, economic, political. You can also showcase facts, figures, and other relevant content using this PPT layout. Grab it now.
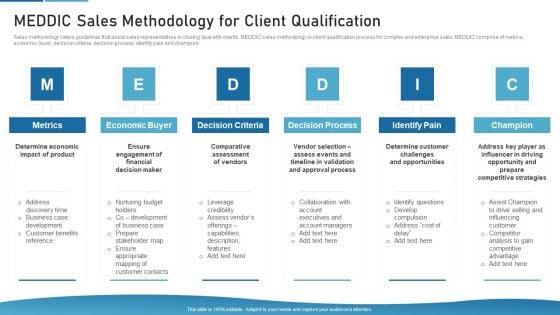
Sales Process Catalogue Template Meddic Sales Methodology For Client Qualification Diagrams PDF
Sales methodology caters guidelines that assist sales representatives in closing deal with clients. MEDDIC sales methodology is client qualification process for complex and enterprise sales. MEDDIC comprise of metrics, economic buyer, decision criteria, decision process, identify pain and champion. Presenting sales process catalogue template meddic sales methodology for client qualification diagrams pdf to provide visual cues and insights. Share and navigate important information on six stages that need your due attention. This template can be used to pitch topics like metrics, economic buyer, decision criteria, decision process, identify pain, champion. In addtion, this PPT design contains high resolution images, graphics, etc, that are easily editable and available for immediate download.
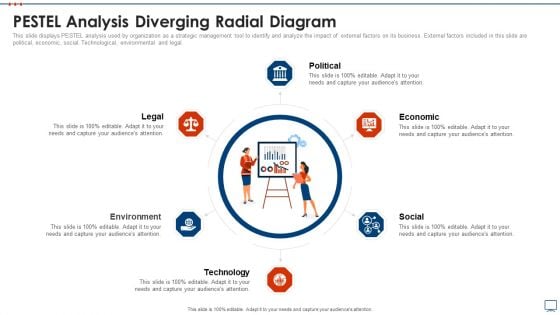
Strategic Business Plan Effective Tools PESTEL Analysis Diverging Radial Diagram Rules PDF
This slide displays PESTEL analysis used by organization as a strategic management tool to identify and analyze the impact of external factors on its business. External factors included in this slide are political, economic, social. Technological, environmental and legal. Presenting strategic business plan effective tools pestel analysis diverging radial diagram rules pdf to provide visual cues and insights. Share and navigate important information on six stages that need your due attention. This template can be used to pitch topics like political, economic, social, technology, environment, legal. In addtion, this PPT design contains high resolution images, graphics, etc, that are easily editable and available for immediate download.
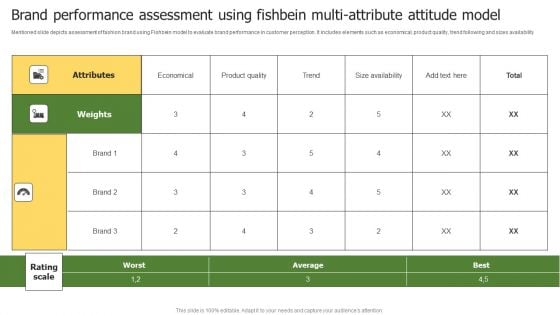
Brand Performance Assessment Using Fishbein Multi Attribute Attitude Model Diagrams PDF
Mentioned slide depicts assessment of fashion brand using Fishbein model to evaluate brand performance in customer perception. It includes elements such as economical, product quality, trend following and sizes availability. Showcasing this set of slides titled Brand Performance Assessment Using Fishbein Multi Attribute Attitude Model Diagrams PDF. The topics addressed in these templates are Economical, Product Quality, Average. All the content presented in this PPT design is completely editable. Download it and make adjustments in color, background, font etc. as per your unique business setting.
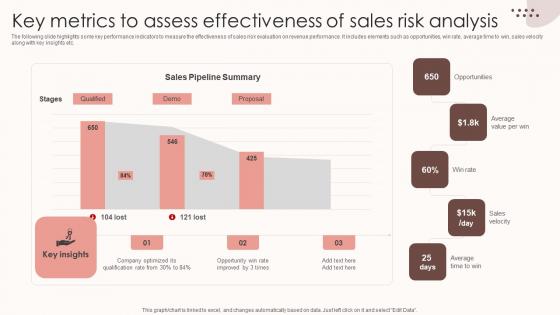
Assessing Sales Risks Key Metrics To Assess Effectiveness Of Sales Risk Analysis Diagrams PDF
The following slide highlights some key performance indicators to measure the effectiveness of sales risk evaluation on revenue performance. It includes elements such as opportunities, win rate, average time to win, sales velocity along with key insights etc. This Assessing Sales Risks Key Metrics To Assess Effectiveness Of Sales Risk Analysis Diagrams PDF is perfect for any presentation, be it in front of clients or colleagues. It is a versatile and stylish solution for organizing your meetings. The Assessing Sales Risks Key Metrics To Assess Effectiveness Of Sales Risk Analysis Diagrams PDF features a modern design for your presentation meetings. The adjustable and customizable slides provide unlimited possibilities for acing up your presentation. Slidegeeks has done all the homework before launching the product for you. So, do not wait, grab the presentation templates today The following slide highlights some key performance indicators to measure the effectiveness of sales risk evaluation on revenue performance. It includes elements such as opportunities, win rate, average time to win, sales velocity along with key insights etc.
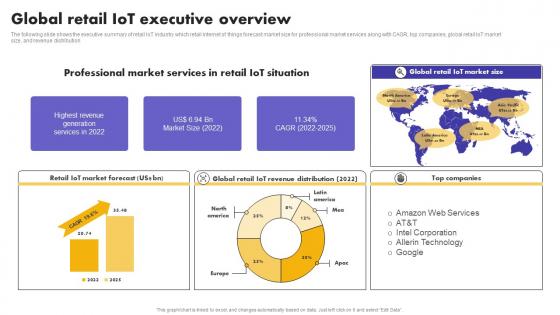
IoT Application In Global Global Retail IoT Executive Overview Diagrams Pdf
The following slide shows the executive summary of retail IoT industry which retail internet of things forecast market size for professional market services along with CAGR, top companies, global retail IoT market size, and revenue distribution. Do you have to make sure that everyone on your team knows about any specific topic I yes, then you should give IoT Application In Global Global Retail IoT Executive Overview Diagrams Pdf a try. Our experts have put a lot of knowledge and effort into creating this impeccable IoT Application In Global Global Retail IoT Executive Overview Diagrams Pdf You can use this template for your upcoming presentations, as the slides are perfect to represent even the tiniest detail. You can download these templates from the Slidegeeks website and these are easy to edit. So grab these today The following slide shows the executive summary of retail IoT industry which retail internet of things forecast market size for professional market services along with CAGR, top companies, global retail IoT market size, and revenue distribution.
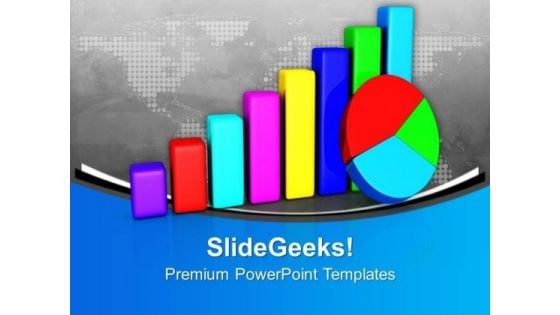
Business Chart Diagram Sales PowerPoint Templates Ppt Backgrounds For Slides 0113
We present our Business Chart Diagram Sales PowerPoint Templates PPT Backgrounds For Slides 0113.Present our Finance PowerPoint Templates because You can Be the puppeteer with our PowerPoint Templates and Slides as your strings. Lead your team through the steps of your script. Download and present our Business PowerPoint Templates because Our PowerPoint Templates and Slides are innately eco-friendly. Their high recall value negate the need for paper handouts. Download and present our Marketing PowerPoint Templates because Our PowerPoint Templates and Slides provide you with a vast range of viable options. Select the appropriate ones and just fill in your text. Present our Success PowerPoint Templates because You should Bet on your luck with our PowerPoint Templates and Slides. Be assured that you will hit the jackpot. Download our Sales PowerPoint Templates because Our PowerPoint Templates and Slides will steer your racing mind. Hit the right buttons and spur on your audience.Use these PowerPoint slides for presentations relating to Business Graph of growing up, finance, business, marketing, success, shapes. The prominent colors used in the PowerPoint template are Blue, Red, Yellow. You can be sure our Business Chart Diagram Sales PowerPoint Templates PPT Backgrounds For Slides 0113 will help them to explain complicated concepts. Professionals tell us our finance PowerPoint templates and PPT Slides are the best it can get when it comes to presenting. Customers tell us our Business Chart Diagram Sales PowerPoint Templates PPT Backgrounds For Slides 0113 will make the presenter look like a pro even if they are not computer savvy. Presenters tell us our business PowerPoint templates and PPT Slides are second to none. We assure you our Business Chart Diagram Sales PowerPoint Templates PPT Backgrounds For Slides 0113 look good visually. Presenters tell us our up PowerPoint templates and PPT Slides will make the presenter successul in his career/life. Examine all factors in detail. Give each one close attention with our Business Chart Diagram Sales PowerPoint Templates Ppt Backgrounds For Slides 0113.
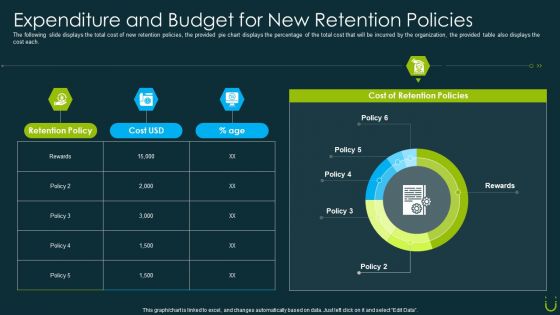
Staff Retention Plan Expenditure And Budget For New Retention Policies Ppt Ideas Graphics PDF
The following slide displays the total cost of new retention policies, the provided pie chart displays the percentage of the total cost that will be incurred by the organization, the provided table also displays the cost each. Deliver an awe inspiring pitch with this creative staff retention plan expenditure and budget for new retention policies ppt ideas graphics pdf bundle. Topics like expenditure and budget for new retention policies can be discussed with this completely editable template. It is available for immediate download depending on the needs and requirements of the user.
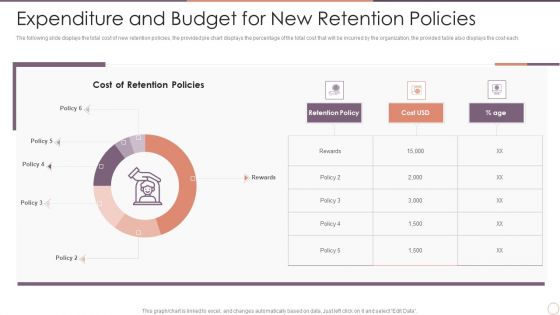
Managing Employee Turnover Expenditure And Budget For New Retention Policies Topics PDF
The following slide displays the total cost of new retention policies, the provided pie chart displays the percentage of the total cost that will be incurred by the organization, the provided table also displays the cost each. Deliver and pitch your topic in the best possible manner with this Managing Employee Turnover Expenditure And Budget For New Retention Policies Topics PDF. Use them to share invaluable insights on Expenditure And Budget, New Retention Policies and impress your audience. This template can be altered and modified as per your expectations. So, grab it now.
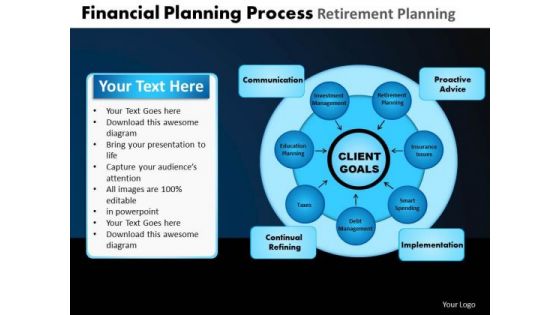
PowerPoint Design Slides Chart Financial Planning Ppt Template
Our PowerPoint Design Slides Chart Financial Planning Ppt Template are very falcon like. They keep a sharp eye on the target.
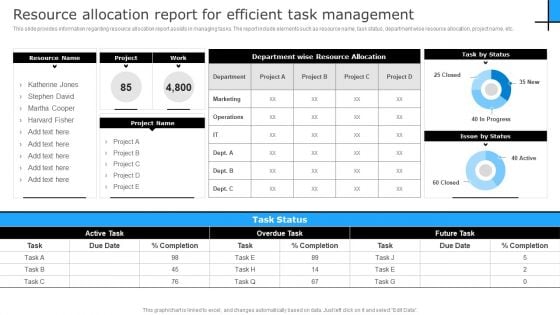
Successful Corporate Technique Enhancing Firms Performance Resource Allocation Report For Efficient Task Management Elements PDF
This slide provides information regarding resource allocation report assists in managing tasks. The report include elements such as resource name, task status, department wise resource allocation, project name, etc. Want to ace your presentation in front of a live audience Our Successful Corporate Technique Enhancing Firms Performance Resource Allocation Report For Efficient Task Management Elements PDF can help you do that by engaging all the users towards you. Slidegeeks experts have put their efforts and expertise into creating these impeccable powerpoint presentations so that you can communicate your ideas clearly. Moreover, all the templates are customizable, and easy to edit and downloadable. Use these for both personal and commercial use.
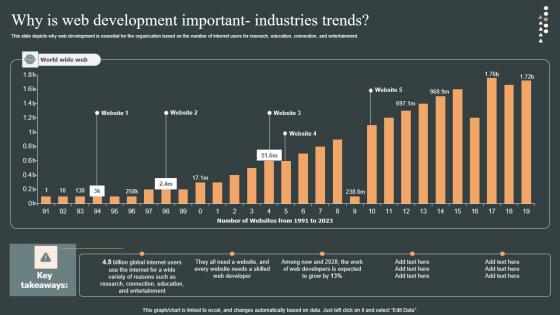
Why Is Web Development Important Role Web Designing User Engagement Themes PDF
Present like a pro with Why Is Web Development Important Role Web Designing User Engagement Themes PDF Create beautiful presentations together with your team, using our easy-to-use presentation slides. Share your ideas in real-time and make changes on the fly by downloading our templates. So whether you are in the office, on the go, or in a remote location, you can stay in sync with your team and present your ideas with confidence. With Slidegeeks presentation got a whole lot easier. Grab these presentations today. This slide depicts why web development is essential for the organization based on the number of internet users for research, education, connection, and entertainment.
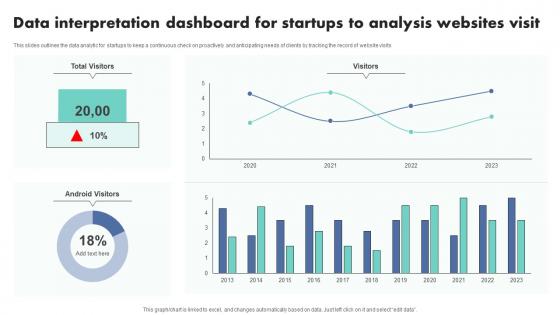
Data Interpretation Dashboard For Startups To Analysis Websites Visit Themes Pdf
This slides outlines the data analytic for startups to keep a continuous check on proactively and anticipating needs of clients by tracking the record of website visits.Showcasing this set of slides titled Data Interpretation Dashboard For Startups To Analysis Websites Visit Themes Pdf The topics addressed in these templates are Data Interpretation, Dashboard Startups, Analysis Websites Visit All the content presented in this PPT design is completely editable. Download it and make adjustments in color, background, font etc. as per your unique business setting. This slides outlines the data analytic for startups to keep a continuous check on proactively and anticipating needs of clients by tracking the record of website visits.

PowerPoint Theme Business Puzzle Ppt Themes
An excellent graphics that help you convey your ideas successfully - no matter what they are Our PowerPoint Theme Business Puzzle Ppt Themes will be a feather in your cap. They will add to your enduring charm.
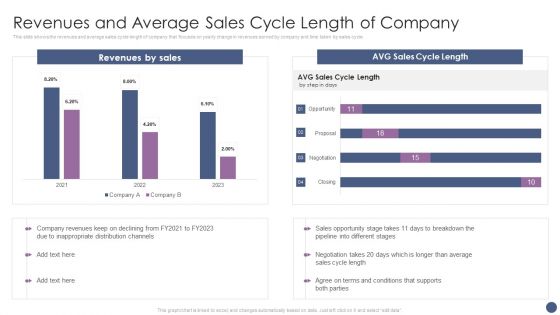
Competitive Sales Strategy Development Plan For Revenue Growth Revenues And Average Sales Ideas PDF
This slide shows the revenues and average sales cycle length of company that focuses on yearly change in revenues earned by company and time taken by sales cycle. Deliver an awe inspiring pitch with this creative Competitive Sales Strategy Development Plan For Revenue Growth Revenues And Average Sales Ideas PDF bundle. Topics like Revenues By Sales, Sales Opportunity can be discussed with this completely editable template. It is available for immediate download depending on the needs and requirements of the user.
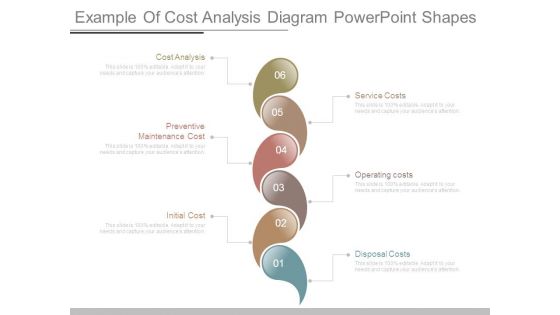
Example Of Cost Analysis Diagram Powerpoint Shapes
This is a example of cost analysis diagram powerpoint shapes. This is a six stage process. The stages in this process are disposal costs, initial cost, operating costs, preventive maintenance cost, service costs, cost analysis.
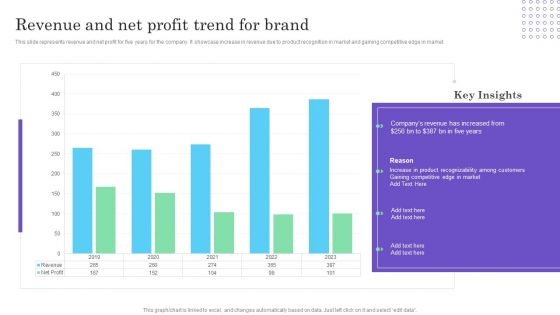
Cultural Branding Marketing Strategy To Increase Lead Generation Revenue And Net Profit Trend For Brand Inspiration PDF
This slide represents revenue and net profit for five years for the company. It showcase increase in revenue due to product recognition in market and gaining competitive edge in market. Make sure to capture your audiences attention in your business displays with our gratis customizable Cultural Branding Marketing Strategy To Increase Lead Generation Revenue And Net Profit Trend For Brand Inspiration PDF. These are great for business strategies, office conferences, capital raising or task suggestions. If you desire to acquire more customers for your tech business and ensure they stay satisfied, create your own sales presentation with these plain slides.
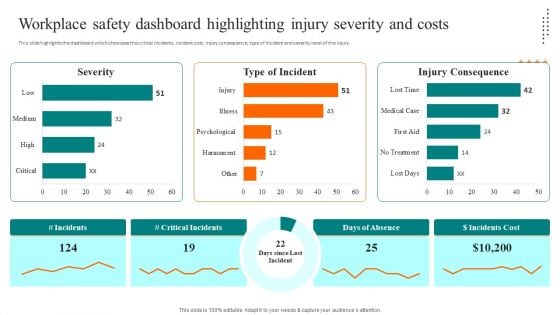
Workplace Safety Dashboard Highlighting Injury Severity And Costs Rules PDF
This slide highlights the dashboard which showcase the critical incidents, incident cost, injury consequence, type of incident and severity level of the injury. Want to ace your presentation in front of a live audience Our Workplace Safety Dashboard Highlighting Injury Severity And Costs Rules PDF can help you do that by engaging all the users towards you. Slidegeeks experts have put their efforts and expertise into creating these impeccable powerpoint presentations so that you can communicate your ideas clearly. Moreover, all the templates are customizable, and easy to edit and downloadable. Use these for both personal and commercial use.
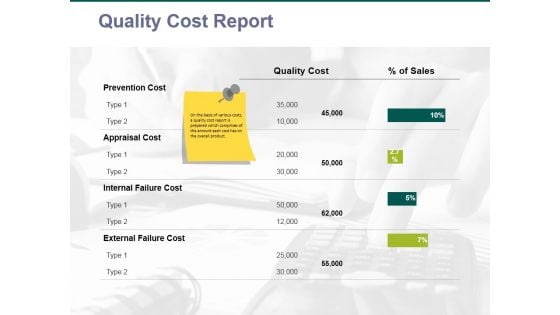
quality cost report ppt powerpoint presentation inspiration images
This is a quality cost report ppt powerpoint presentation inspiration images. This is a five stage process. The stages in this process are business, finance, marketing, analysis, quality cost.
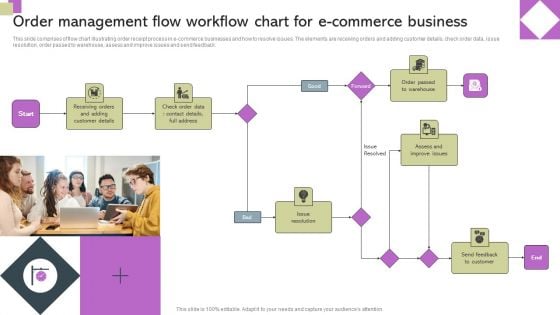
Order Management Flow Workflow Chart For E Commerce Business Ppt Professional Example Introduction PDF
This slide comprises of flow chart illustrating order receipt process in e-commerce businesses and how to resolve issues. The elements are receiving orders and adding customer details, check order data, issue resolution, order passed to warehouse, assess and improve issues and send feedback. Persuade your audience using this Order Management Flow Workflow Chart For E Commerce Business Ppt Professional Example Introduction PDF. This PPT design covers one stages, thus making it a great tool to use. It also caters to a variety of topics including Issue Resolution, Forward, Adding Customer Details, Receiving Orders. Download this PPT design now to present a convincing pitch that not only emphasizes the topic but also showcases your presentation skills.
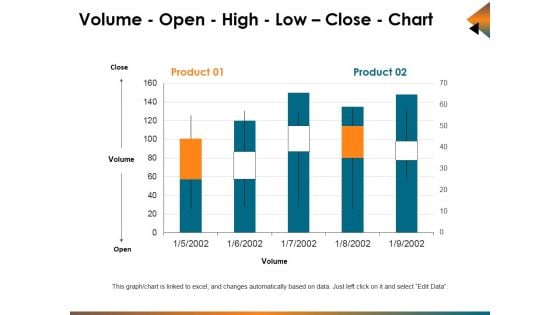
Volume Open High Low Close Chart Ppt PowerPoint Presentation Ideas Graphics Example
This is a volume open high low close chart ppt powerpoint presentation ideas graphics example. This is a five stage process. The stages in this process are business, bar graph, stock, cost, market.
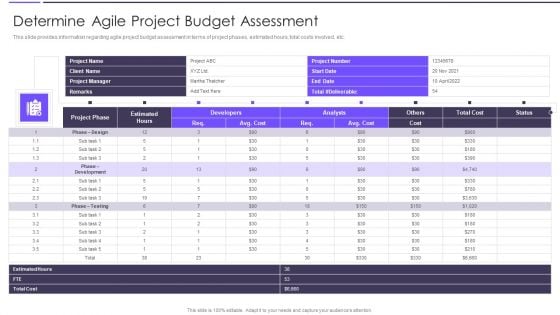
Agile Transformation Framework Determine Agile Project Budget Assessment Clipart PDF
This slide provides information regarding agile project budget assessment in terms of project phases, estimated hours, total costs involved, etc. This slide provides information regarding agile project budget assessment in terms of project phases, estimated hours, total costs involved, etc. Deliver and pitch your topic in the best possible manner with this Agile Transformation Framework Determine Agile Project Budget Assessment Clipart PDF. Use them to share invaluable insights on Project Phase, Estimated Hours, Developers Analysts and impress your audience. This template can be altered and modified as per your expectations. So, grab it now.
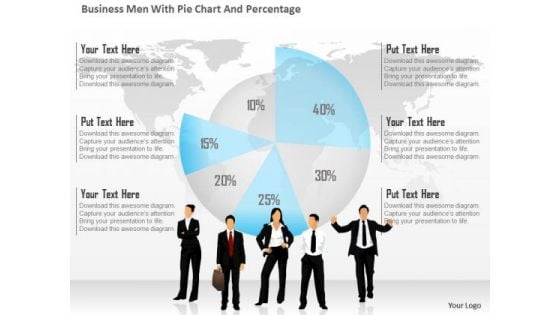
Business Diagram Business Men With Pie Chart And Percentage Presentation Template
This business diagram has been designed with graphic of business people and pie chart with percentage. This diagram is designed to depict team meeting on financial matter. This diagram offers a way for your audience to visually conceptualize the process.
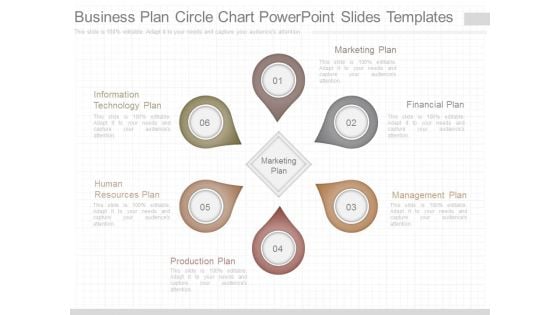
Business Plan Circle Chart Powerpoint Slides Templates
This is a business plan circle chart powerpoint slides templates. This is a six stage process. The stages in this process are information technology plan, human resources plan, production plan, marketing plan, marketing plan, financial plan, management plan.
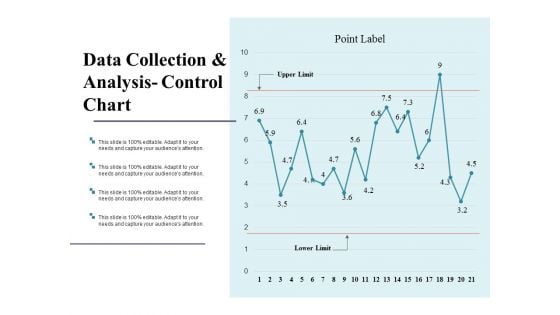
Data Collection And Analysis Control Chart Ppt PowerPoint Presentation Model Backgrounds
This is a data collection and analysis control chart ppt powerpoint presentation model backgrounds. This is a two stage process. The stages in this process are business, marketing, strategy, finance, analysis.
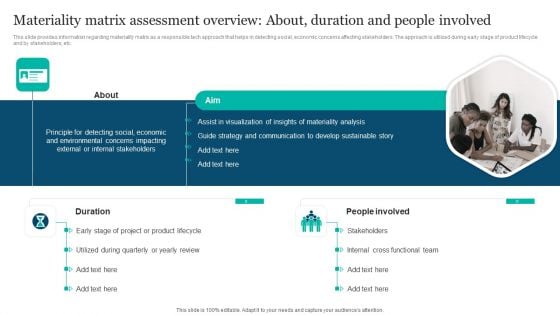
Responsible Technology Playbook Materiality Matrix Assessment Overview About Duration Diagrams PDF
This slide provides information regarding materiality matrix as a responsible tech approach that helps in detecting social, economic concerns affecting stakeholders. The approach is utilized during early stage of product lifecycle and by stakeholders, etc. Make sure to capture your audiences attention in your business displays with our gratis customizable Responsible Technology Playbook Materiality Matrix Assessment Overview About Duration Diagrams PDF. These are great for business strategies, office conferences, capital raising or task suggestions. If you desire to acquire more customers for your tech business and ensure they stay satisfied, create your own sales presentation with these plain slides.
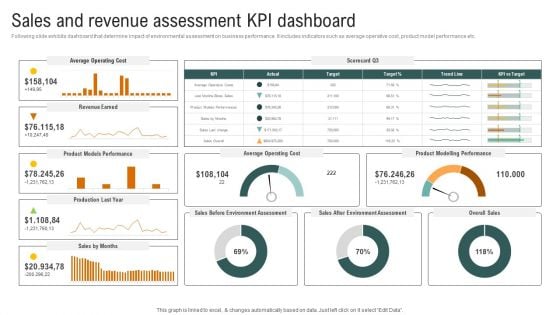
Sales And Revenue Assessment Kpi Dashboard Brochure PDF
Following slide exhibits dashboard that determine impact of environmental assessment on business performance. It includes indicators such as average operative cost, product model performance etc. If your project calls for a presentation, then Slidegeeks is your go-to partner because we have professionally designed, easy-to-edit templates that are perfect for any presentation. After downloading, you can easily edit Sales And Revenue Assessment Kpi Dashboard Brochure PDF and make the changes accordingly. You can rearrange slides or fill them with different images. Check out all the handy templates
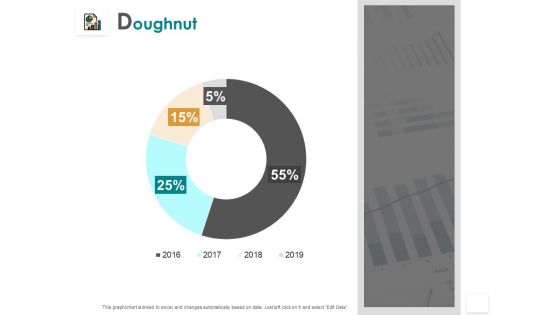
Doughnut Finance Marketing Ppt PowerPoint Presentation Portfolio Display
Presenting this set of slides with name doughnut finance marketing ppt powerpoint presentation portfolio display. The topics discussed in these slides are donut chart, finance, marketing, analysis, investment. This is a completely editable PowerPoint presentation and is available for immediate download. Download now and impress your audience.
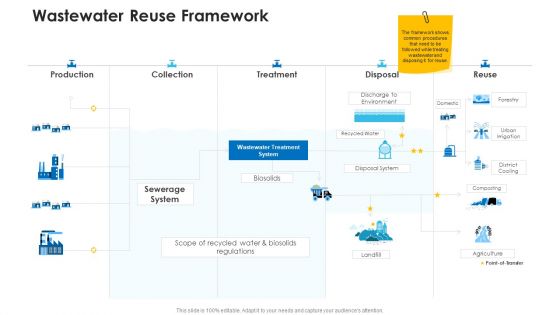
Non Rural Water Resource Administration Wastewater Reuse Framework Themes PDF
Deliver and pitch your topic in the best possible manner with this non rural water resource administration wastewater reuse framework themes pdf. Use them to share invaluable insights on production, collection, treatment, disposal, reuse and impress your audience. This template can be altered and modified as per your expectations. So, grab it now.
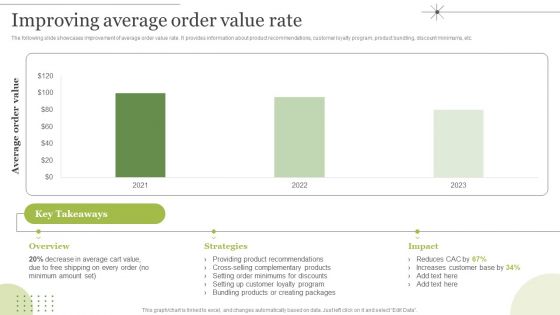
Managing E Commerce Business Accounting Improving Average Order Value Rate Graphics PDF
The following slide showcases improvement of average order value rate. It provides information about product recommendations, customer loyalty program, product bundling, discount minimums, etc. If you are looking for a format to display your unique thoughts, then the professionally designed Managing E Commerce Business Accounting Improving Average Order Value Rate Graphics PDF is the one for you. You can use it as a Google Slides template or a PowerPoint template. Incorporate impressive visuals, symbols, images, and other charts. Modify or reorganize the text boxes as you desire. Experiment with shade schemes and font pairings. Alter, share or cooperate with other people on your work. Download Managing E Commerce Business Accounting Improving Average Order Value Rate Graphics PDF and find out how to give a successful presentation. Present a perfect display to your team and make your presentation unforgettable.
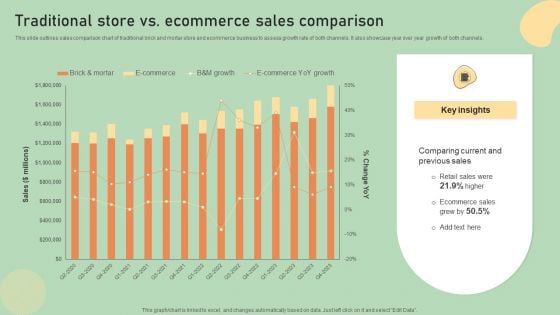
E Commerce Business Development Plan Traditional Store Vs Ecommerce Sales Comparison Guidelines PDF
This slide outlines sales comparison chart of traditional brick and mortar store and ecommerce business to assess growth rate of both channels. It also showcase year over year growth of both channels. Create an editable E Commerce Business Development Plan Traditional Store Vs Ecommerce Sales Comparison Guidelines PDF that communicates your idea and engages your audience. Whether you are presenting a business or an educational presentation, pre-designed presentation templates help save time. E Commerce Business Development Plan Traditional Store Vs Ecommerce Sales Comparison Guidelines PDF is highly customizable and very easy to edit, covering many different styles from creative to business presentations. Slidegeeks has creative team members who have crafted amazing templates. So, go and get them without any delay.
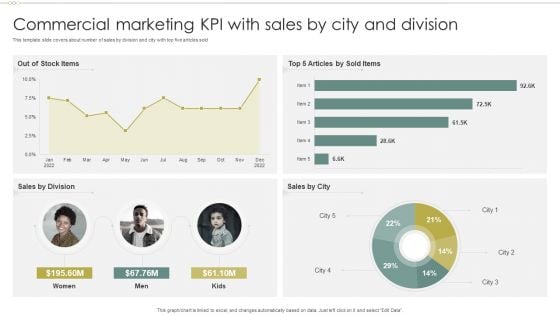
Commercial Marketing KPI With Sales By City And Division Template PDF
This template slide covers about number of sales by division and city with top five articles sold.Showcasing this set of slides titled Commercial Marketing KPI With Sales By City And Division Template PDF. The topics addressed in these templates are Commercial Marketing KPI With Sales By City And Division Template PDF. All the content presented in this PPT design is completely editable. Download it and make adjustments in color, background, font etc. as per your unique business setting.
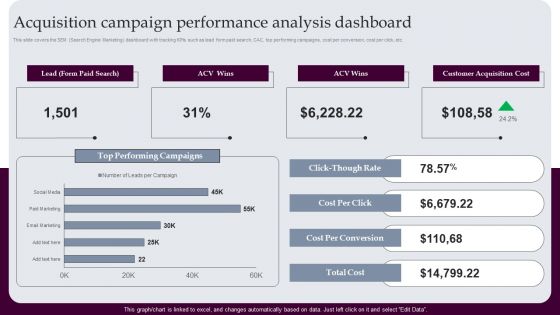
Acquisition Campaign Performance Analysis Dashboard Strategies For Acquiring Consumers Themes PDF
This slide covers the SEM Search Engine Marketing dashboard with tracking KPIs such as lead form paid search, CAC, top performing campaigns, cost per conversion, cost per click, etc. Crafting an eye-catching presentation has never been more straightforward. Let your presentation shine with this tasteful yet straightforward Acquisition Campaign Performance Analysis Dashboard Strategies For Acquiring Consumers Themes PDF template. It offers a minimalistic and classy look that is great for making a statement. The colors have been employed intelligently to add a bit of playfulness while still remaining professional. Construct the ideal Acquisition Campaign Performance Analysis Dashboard Strategies For Acquiring Consumers Themes PDF that effortlessly grabs the attention of your audience Begin now and be certain to wow your customers.
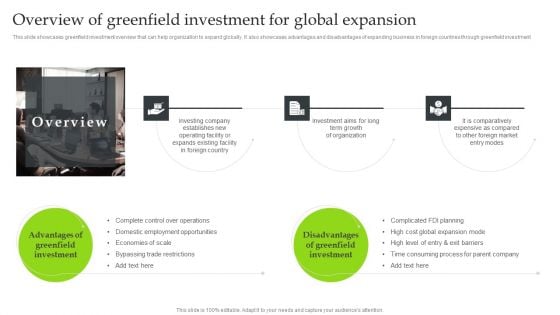
Expansion Strategic Plan Overview Of Greenfield Investment For Global Expansion Diagrams PDF
This slide showcases greenfield investment overview that can help organization to expand globally. It also showcases advantages and disadvantages of expanding business in foreign countries through greenfield investment. Are you searching for a Expansion Strategic Plan Overview Of Greenfield Investment For Global Expansion Diagrams PDF that is uncluttered, straightforward, and original Its easy to edit, and you can change the colors to suit your personal or business branding. For a presentation that expresses how much effort youve put in, this template is ideal With all of its features, including tables, diagrams, statistics, and lists, its perfect for a business plan presentation. Make your ideas more appealing with these professional slides. Download Expansion Strategic Plan Overview Of Greenfield Investment For Global Expansion Diagrams PDF from Slidegeeks today.
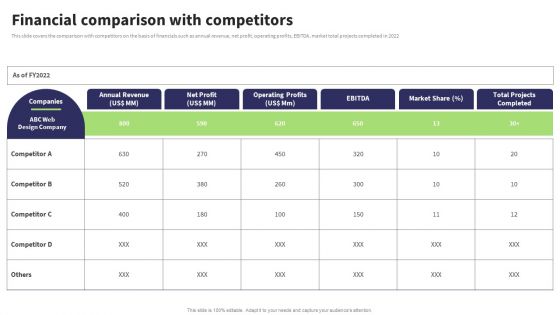
Website Design And Development Services Company Profile Financial Comparison With Competitors Diagrams PDF
This slide covers the comparison with competitors on the basis of financials such as annual revenue, net profit, operating profits, EBITDA, market total projects completed in 2022. Crafting an eye catching presentation has never been more straightforward. Let your presentation shine with this tasteful yet straightforward Website Design And Development Services Company Profile Financial Comparison With Competitors Diagrams PDF template. It offers a minimalistic and classy look that is great for making a statement. The colors have been employed intelligently to add a bit of playfulness while still remaining professional. Construct the ideal Website Design And Development Services Company Profile Financial Comparison With Competitors Diagrams PDF that effortlessly grabs the attention of your audience Begin now and be certain to wow your customers.


 Continue with Email

 Home
Home


