Money Icon
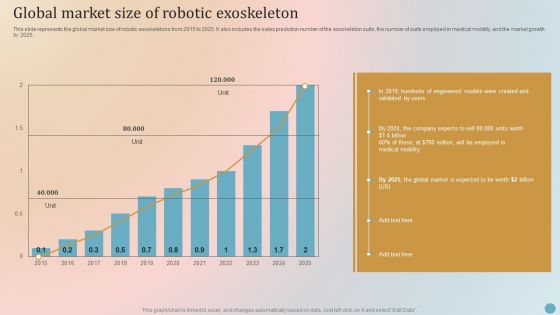
Global Market Size Of Robotic Exoskeleton Diagrams PDF
Get a simple yet stunning designed Global Market Size Of Robotic Exoskeleton Diagrams PDF. It is the best one to establish the tone in your meetings. It is an excellent way to make your presentations highly effective. So, download this PPT today from Slidegeeks and see the positive impacts. Our easy-to-edit Global Market Size Of Robotic Exoskeleton Diagrams PDF can be your go-to option for all upcoming conferences and meetings. So, what are you waiting for. Grab this template today.
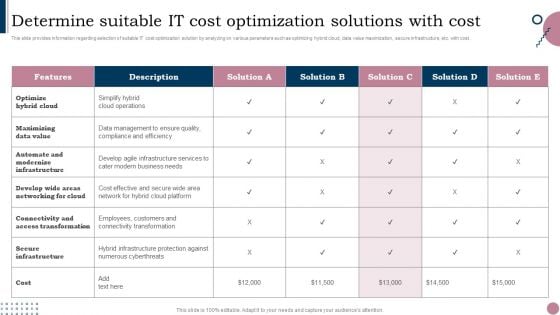
Cios Guide To Optimize Determine Suitable IT Cost Optimization Solutions With Cost Microsoft PDF
This slide provides information regarding selection of suitable IT cost optimization solution by analyzing on various parameters such as optimizing hybrid cloud, data value maximization, secure infrastructure, etc. with cost. Coming up with a presentation necessitates that the majority of the effort goes into the content and the message you intend to convey. The visuals of a PowerPoint presentation can only be effective if it supplements and supports the story that is being told. Keeping this in mind our experts created Cios Guide To Optimize Determine Suitable IT Cost Optimization Solutions With Cost Microsoft PDF to reduce the time that goes into designing the presentation. This way, you can concentrate on the message while our designers take care of providing you with the right template for the situation.
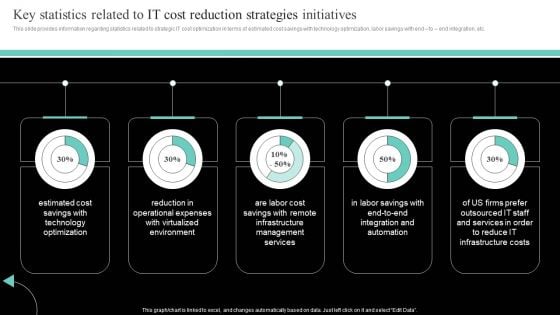
IT Cost Reduction Strategieskey Statistics Related To IT Cost Reduction Strategies Initiatives Ideas PDF
This slide provides information regarding statistics related to strategic IT cost optimization in terms of estimated cost savings with technology optimization, labor savings with end to end integration, etc. Are you in need of a template that can accommodate all of your creative concepts This one is crafted professionally and can be altered to fit any style. Use it with Google Slides or PowerPoint. Include striking photographs, symbols, depictions, and other visuals. Fill, move around, or remove text boxes as desired. Test out color palettes and font mixtures. Edit and save your work, or work with colleagues. Download IT Cost Reduction Strategieskey Statistics Related To IT Cost Reduction Strategies Initiatives Ideas PDF and observe how to make your presentation outstanding. Give an impeccable presentation to your group and make your presentation unforgettable.
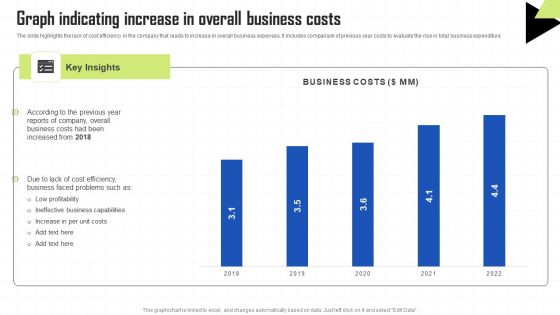
Key Techniques To Enhance Cost Efficiency Graph Indicating Increase In Overall Business Costs Structure PDF
The slide highlights the lack of cost efficiency in the company that leads to increase in overall business expenses. It includes comparison of previous year costs to evaluate the rise in total business expenditure Welcome to our selection of the Key Techniques To Enhance Cost Efficiency Graph Indicating Increase In Overall Business Costs Structure PDF. These are designed to help you showcase your creativity and bring your sphere to life. Planning and Innovation are essential for any business that is just starting out. This collection contains the designs that you need for your everyday presentations. All of our PowerPoints are 100 percent editable, so you can customize them to suit your needs. This multi purpose template can be used in various situations. Grab these presentation templates today.
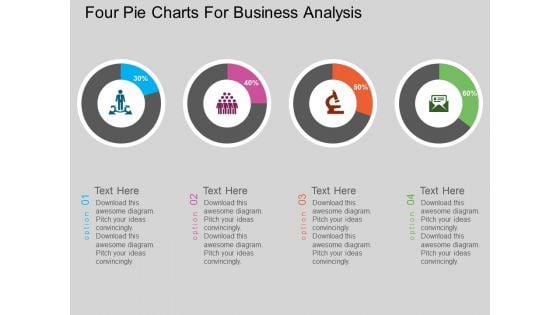
Four Pie Charts For Business Analysis Powerpoint Template
This PowerPoint template has been designed with graphics of four pie charts This diagram can be used to display financial planning and business analysis. Capture the attention of your audience with this slide.
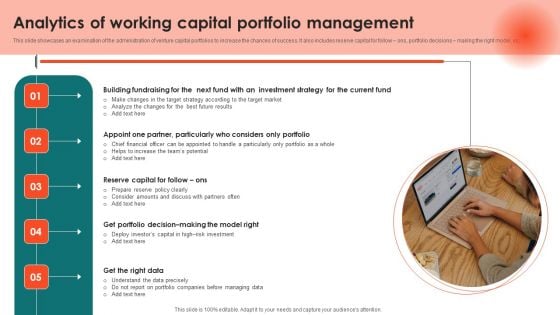
Analytics Of Working Capital Portfolio Management Rules PDF
This slide showcases an examination of the administration of venture capital portfolios to increase the chances of success. It also includes reserve capital for follow ons, portfolio decisions making the right model, etc. Presenting Analytics Of Working Capital Portfolio Management Rules PDF to dispense important information. This template comprises five stages. It also presents valuable insights into the topics including Building Fundraising, Partner, Particularly, Right Data This is a completely customizable PowerPoint theme that can be put to use immediately. So, download it and address the topic impactfully.
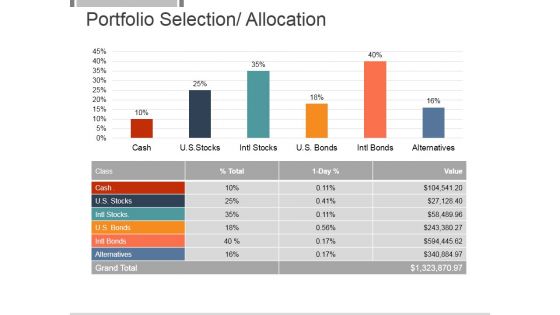
Portfolio Selection Allocation Template 1 Ppt PowerPoint Presentation Themes
This is a portfolio selection allocation template 1 ppt powerpoint presentation themes. This is a six stage process. The stages in this process are financial, business, strategy, management, marketing.
Tracking The Cashflow Improvements With Cash Guide To Corporate Financial Growth Plan Pictures Pdf
This slide showcases the KPIs that would help our business organization to track the improvements in the new cash management process. It includes quick ratio, cash balance, current ratio, days inventory outstanding, etc.Want to ace your presentation in front of a live audience Our Tracking The Cashflow Improvements With Cash Guide To Corporate Financial Growth Plan Pictures Pdf can help you do that by engaging all the users towards you.. Slidegeeks experts have put their efforts and expertise into creating these impeccable powerpoint presentations so that you can communicate your ideas clearly. Moreover, all the templates are customizable, and easy-to-edit and downloadable. Use these for both personal and commercial use. This slide showcases the KPIs that would help our business organization to track the improvements in the new cash management process. It includes quick ratio, cash balance, current ratio, days inventory outstanding, etc.

Analyzing Companys Current Sales Revenue And Customer Base Graphics PDF
The following slide highlights the current scenario of company sales and customer retention rates. It illustrates graphs of last 3 years which shows company sales and net profit margins are declining and existing customer are leaving the company.Here you can discover an assortment of the finest PowerPoint and Google Slides templates. With these templates, you can create presentations for a variety of purposes while simultaneously providing your audience with an eye-catching visual experience. Download Analyzing Companys Current Sales Revenue And Customer Base Graphics PDF to deliver an impeccable presentation. These templates will make your job of preparing presentations much quicker, yet still, maintain a high level of quality. Slidegeeks has experienced researchers who prepare these templates and write high-quality content for you. Later on, you can personalize the content by editing the Analyzing Companys Current Sales Revenue And Customer Base Graphics PDF.
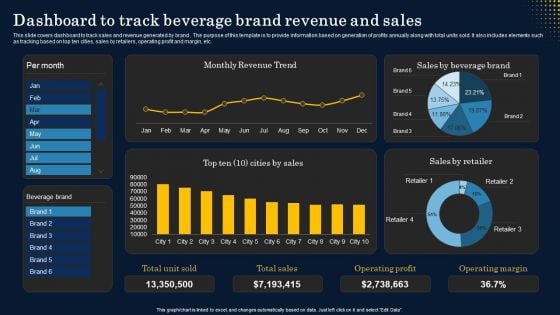
Dashboard To Track Beverage Brand Revenue And Sales Structure PDF
This slide covers dashboard to track sales and revenue generated by brand . The purpose of this template is to provide information based on generation of profits annually along with total units sold. It also includes elements such as tracking based on top ten cities, sales by retailers, operating profit and margin, etc. Are you in need of a template that can accommodate all of your creative concepts This one is crafted professionally and can be altered to fit any style. Use it with Google Slides or PowerPoint. Include striking photographs, symbols, depictions, and other visuals. Fill, move around, or remove text boxes as desired. Test out color palettes and font mixtures. Edit and save your work, or work with colleagues. Download Dashboard To Track Beverage Brand Revenue And Sales Structure PDF and observe how to make your presentation outstanding. Give an impeccable presentation to your group and make your presentation unforgettable.
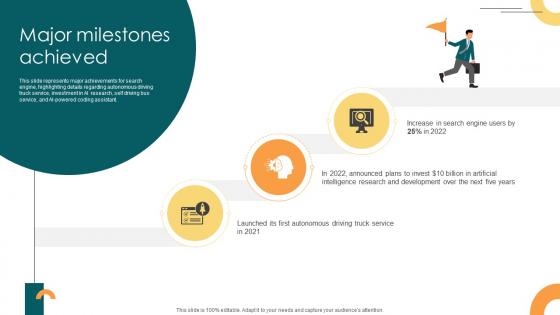
Major Milestones Achieved Internet Company Investor Funding Elevator Pitch Deck
This slide represents major achievements for search engine, highlighting details regarding autonomous driving truck service, investment in AI research, self driving bus service, and AI-powered coding assistant. If you are looking for a format to display your unique thoughts, then the professionally designed Major Milestones Achieved Internet Company Investor Funding Elevator Pitch Deck is the one for you. You can use it as a Google Slides template or a PowerPoint template. Incorporate impressive visuals, symbols, images, and other charts. Modify or reorganize the text boxes as you desire. Experiment with shade schemes and font pairings. Alter, share or cooperate with other people on your work. Download Major Milestones Achieved Internet Company Investor Funding Elevator Pitch Deck and find out how to give a successful presentation. Present a perfect display to your team and make your presentation unforgettable. This slide represents major achievements for search engine, highlighting details regarding autonomous driving truck service, investment in AI research, self driving bus service, and AI-powered coding assistant.
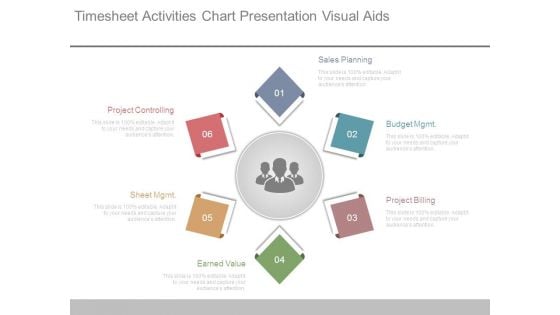
Timesheet Activities Chart Presentation Visual Aids
This is a timesheet activities chart presentation visual aids. This is a six stage process. The stages in this process are sales planning, budget mgmt, project billing, earned value, sheet mgmt, project controlling.
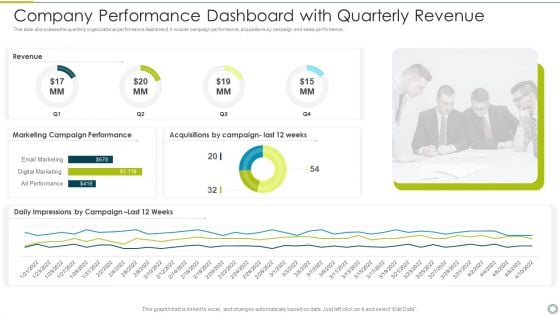
Company Performance Dashboard With Quarterly Revenue Download PDF
This slide showcases the quarterly organizational performance dashboard. It include campaign performance, acquisitions by campaign and sales performance. Showcasing this set of slides titled company performance dashboard with quarterly revenue download pdf. The topics addressed in these templates are marketing, performance. All the content presented in this PPT design is completely editable. Download it and make adjustments in color, background, font etc. as per your unique business setting.
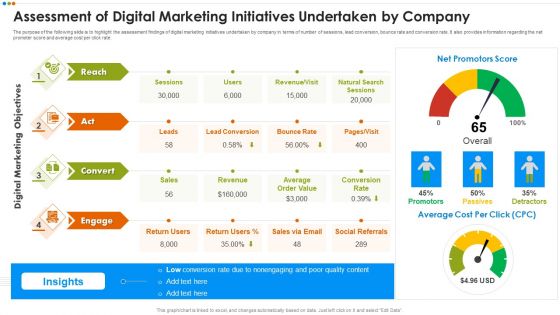
Quarterly Budget Analysis Of Business Organization Assessment Of Digital Marketing Initiatives Rules PDF
The purpose of the following slide is to highlight the assessment findings of digital marketing initiatives undertaken by company in terms of number of sessions, lead conversion, bounce rate and conversion rate. It also provides information regarding the net promoter score and average cost per click rate. Deliver an awe inspiring pitch with this creative Quarterly Budget Analysis Of Business Organization Assessment Of Digital Marketing Initiatives Rules PDF bundle. Topics like Assessment Of Digital Marketing Initiatives Undertaken By Company can be discussed with this completely editable template. It is available for immediate download depending on the needs and requirements of the user.
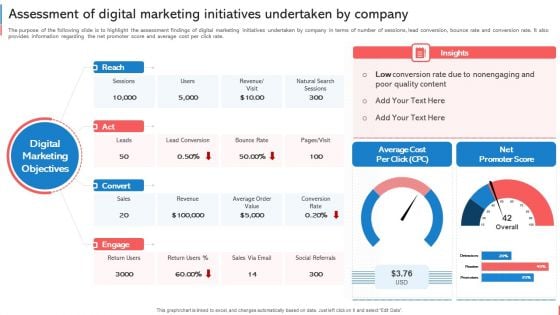
Company Budget Analysis Assessment Of Digital Marketing Initiatives Undertaken Template PDF
The purpose of the following slide is to highlight the assessment findings of digital marketing initiatives undertaken by company in terms of number of sessions, lead conversion, bounce rate and conversion rate. It also provides information regarding the net promoter score and average cost per click rate. Find a pre-designed and impeccable Company Budget Analysis Assessment Of Digital Marketing Initiatives Undertaken Template PDF. The templates can ace your presentation without additional effort. You can download these easy-to-edit presentation templates to make your presentation stand out from others. So, what are you waiting for Download the template from Slidegeeks today and give a unique touch to your presentation.

Improved Digital Expenditure Determine Overall IT Cost Breakdown And Overspend Assessment Microsoft PDF
This slide provides information regarding overall It cost breakdown and overspend assessment to determine major areas where cost are high, and budget is overspend. Deliver and pitch your topic in the best possible manner with this Improved Digital Expenditure Determine Overall IT Cost Breakdown And Overspend Assessment Microsoft PDF. Use them to share invaluable insights on Overspend Assessment, Cost Breakdown, Breakdown Comprise and impress your audience. This template can be altered and modified as per your expectations. So, grab it now.

Ppt Describing Blue Components Using Chevron Diagram PowerPoint Free Templates
PPT describing blue components using chevron diagram powerpoint free Templates-A chevron (also spelled cheveron, especially in older documents) is an inverted V-shaped pattern. It signifies badge, bar, beam, glove, insignia, mark, molding, stripe, zigzag etc. It is describing Blue part of whole Process. -Can be used for presentations on accounts, advice, arrow, art, attorney, background, bank, becoming, benefits, bills, chart, chevron, clip, clipart, diagram, drop, durable, estate, finances, financial, graphic, having, illustration, incapacitated, infographic, lawsuits, legal, loans, personal, plan, power, property, protection, real, shadow, slide, taxes, transparency, vector-PPT describing blue components using chevron diagram powerpoint free Templates Fight off critics with our Ppt Describing Blue Components Using Chevron Diagram PowerPoint Free Templates. Be confident and convinced of your assessment.
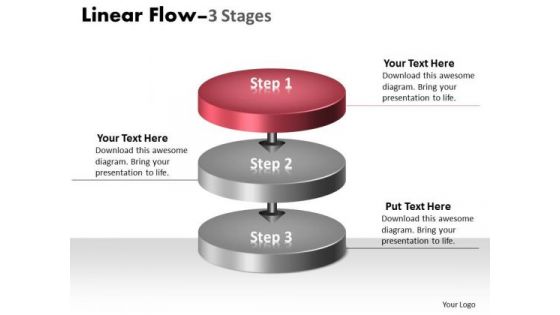
PowerPoint Template Vertical Slide Numbers For Commerce Strategy Graphic
We present our PowerPoint template vertical slide numbers for commerce strategy Graphic. Use our Circle Charts PowerPoint Templates because; illustrate your plans to your listeners with the same accuracy. Use our Shapes PowerPoint Templates because; Use this template containing to highlight the key issues of your presentation. Use our Business PowerPoint Templates because; Place them where they need to be. Use our Arrows PowerPoint Templates because, guaranteed to focus the minds of your team. Use our Process and Flows PowerPoint Templates because, Signpost your preferred roadmap to your eager co- travelers and demonstrate clearly how you intend to navigate them towards the desired corporate goal. Use these PowerPoint slides for presentations relating to Background, Blog, Business, Chain, Communication, Concept, Connection, Constructive, Contact, Design, Destination, Flow, Information, Internet, Line, Linear, Location, Logistic, Movement, Network, Path, Pointer, Reaction, Structure, System, Team. The prominent colors used in the PowerPoint template are Red, Gray, and Black Our PowerPoint Template Vertical Slide Numbers For Commerce Strategy Graphic make good companions. They also are dependable allies.

Elevating Sales Networks Impact 1 Increase In Annual Sales Revenue SA SS V
This slide showcases an increase in business sales revenue compared to the previous year due to effective sales networking strategy implementation. Welcome to our selection of the Elevating Sales Networks Impact 1 Increase In Annual Sales Revenue SA SS V. These are designed to help you showcase your creativity and bring your sphere to life. Planning and Innovation are essential for any business that is just starting out. This collection contains the designs that you need for your everyday presentations. All of our PowerPoints are 100Percent editable, so you can customize them to suit your needs. This multi-purpose template can be used in various situations. Grab these presentation templates today. This slide showcases an increase in business sales revenue compared to the previous year due to effective sales networking strategy implementation.
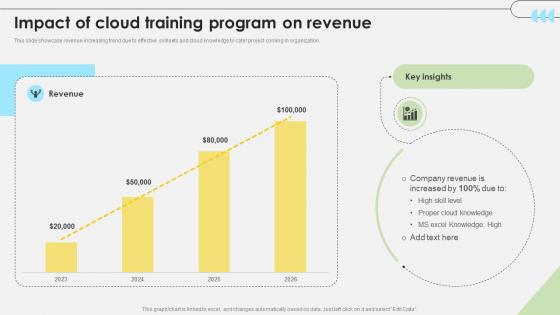
Workforce Competency Enhancement Impact Of Cloud Training Program On Revenue DTE SS V
This slide showcase revenue increasing trend due to effective skillsets and cloud knowledge to cater project coming in organization. Coming up with a presentation necessitates that the majority of the effort goes into the content and the message you intend to convey. The visuals of a PowerPoint presentation can only be effective if it supplements and supports the story that is being told. Keeping this in mind our experts created Workforce Competency Enhancement Impact Of Cloud Training Program On Revenue DTE SS V to reduce the time that goes into designing the presentation. This way, you can concentrate on the message while our designers take care of providing you with the right template for the situation. This slide showcase revenue increasing trend due to effective skillsets and cloud knowledge to cater project coming in organization.
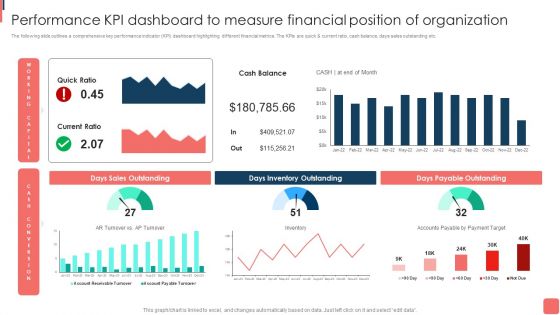
Effective Financial Planning Assessment Techniques Performance Kpi Dashboard To Measure Financial Graphics PDF
The following slide outlines a comprehensive key performance indicator KPI dashboard highlighting different financial metrics. The KPIs are quick and current ratio, cash balance, days sales outstanding etc. The best PPT templates are a great way to save time, energy, and resources. Slidegeeks have 100 precent editable powerpoint slides making them incredibly versatile. With these quality presentation templates, you can create a captivating and memorable presentation by combining visually appealing slides and effectively communicating your message. Download Effective Financial Planning Assessment Techniques Performance Kpi Dashboard To Measure Financial Graphics PDF from Slidegeeks and deliver a wonderful presentation.
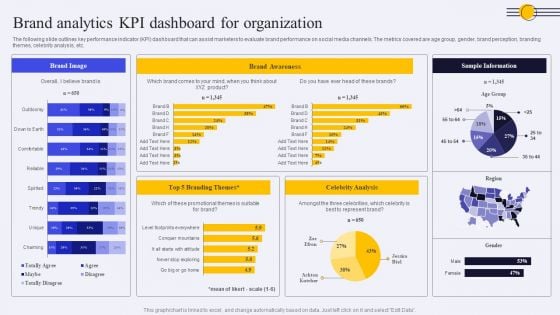
Brand Analytics KPI Dashboard For Organization Ppt PowerPoint Presentation Diagram PDF
The following slide outlines key performance indicator KPI dashboard that can assist marketers to evaluate brand performance on social media channels. The metrics covered are age group, gender, brand perception, branding themes, celebrity analysis, etc. Take your projects to the next level with our ultimate collection of Brand Analytics KPI Dashboard For Organization Ppt PowerPoint Presentation Diagram PDF. Slidegeeks has designed a range of layouts that are perfect for representing task or activity duration, keeping track of all your deadlines at a glance. Tailor these designs to your exact needs and give them a truly corporate look with your own brand colors they will make your projects stand out from the rest.
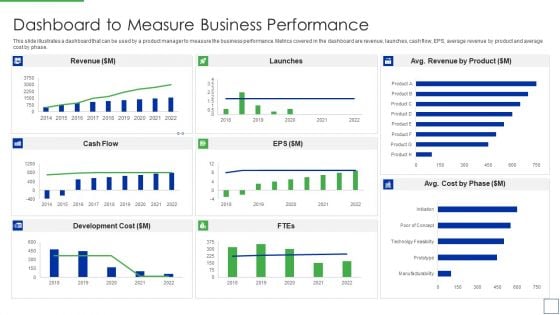
Product Portfolio Management For New Target Region Dashboard To Measure Business Rules PDF
This slide illustrates a dashboard that can be used by a product manager to measure the business performance. Metrics covered in the dashboard are revenue, launches, cash flow, EPS, average revenue by product and average cost by phase.Deliver and pitch your topic in the best possible manner with this Product Portfolio Management For New Target Region Dashboard To Measure Business Rules PDF Use them to share invaluable insights on Dashboard to Measure Business Performance and impress your audience. This template can be altered and modified as per your expectations. So, grab it now.
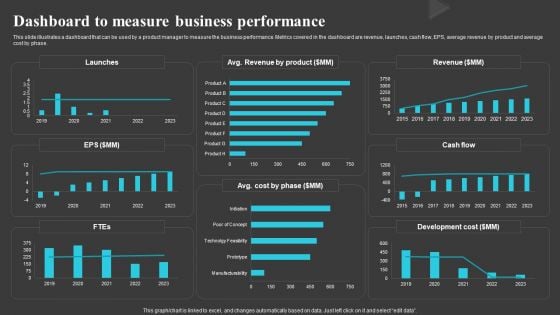
Dashboard To Measure Business Performance Creating And Offering Multiple Product Ranges In New Business Introduction PDF
This slide illustrates a dashboard that can be used by a product manager to measure the business performance. Metrics covered in the dashboard are revenue, launches, cash flow, EPS, average revenue by product and average cost by phase.There are so many reasons you need a Dashboard To Measure Business Performance Creating And Offering Multiple Product Ranges In New Business Introduction PDF. The first reason is you can notspend time making everything from scratch, Thus, Slidegeeks has made presentation templates for you too. You can easily download these templates from our website easily.
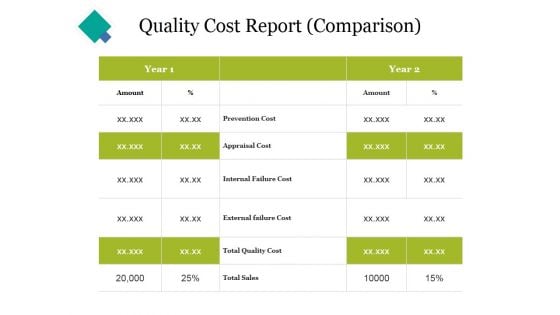
Quality Cost Report Comparison Ppt PowerPoint Presentation Portfolio Themes
This is a quality cost report comparison ppt powerpoint presentation portfolio themes. This is a two stage process. The stages in this process are prevention cost, appraisal cost, internal failure cost, external failure cost, total quality cost.
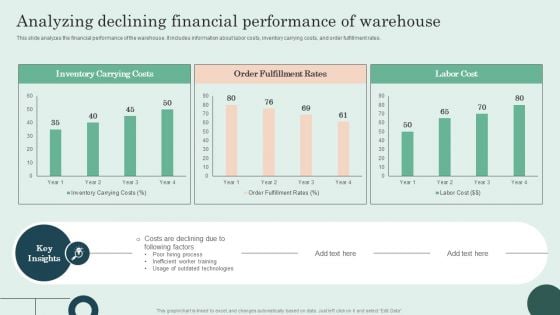
Analyzing Declining Financial Performance Of Warehouse Summary PDF
This slide analyzes the financial performance of the warehouse. It includes information about labor costs, inventory carrying costs, and order fulfillment rates. Find a pre-designed and impeccable Analyzing Declining Financial Performance Of Warehouse Summary PDF. The templates can ace your presentation without additional effort. You can download these easy-to-edit presentation templates to make your presentation stand out from others. So, what are you waiting for Download the template from Slidegeeks today and give a unique touch to your presentation.
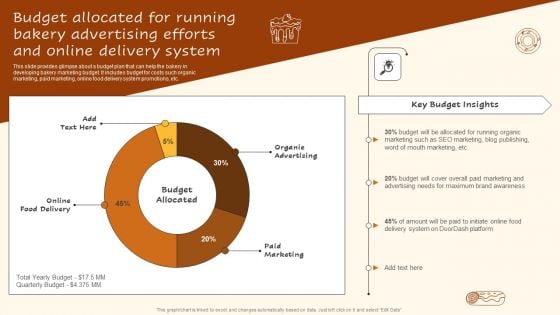
Budget Allocated For Running Bakery Advertising Efforts And Online Delivery System Topics PDF
This slide provides glimpse about a budget plan that can help the bakery in developing bakery marketing budget. It includes budget for costs such organic marketing, paid marketing, online food delivery system promotions, etc. Presenting this PowerPoint presentation, titled Budget Allocated For Running Bakery Advertising Efforts And Online Delivery System Topics PDF, with topics curated by our researchers after extensive research. This editable presentation is available for immediate download and provides attractive features when used. Download now and captivate your audience. Presenting this Budget Allocated For Running Bakery Advertising Efforts And Online Delivery System Topics PDF. Our researchers have carefully researched and created these slides with all aspects taken into consideration. This is a completely customizable Budget Allocated For Running Bakery Advertising Efforts And Online Delivery System Topics PDF that is available for immediate downloading. Download now and make an impact on your audience. Highlight the attractive features available with our PPTs.
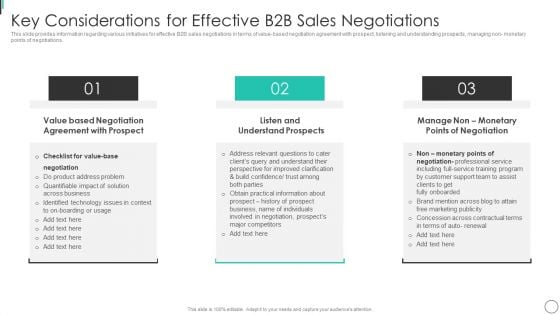
Key Considerations For Effective B2B Sales Negotiations Diagrams PDF
This slide provides information regarding various initiatives for effective B2B sales negotiations in terms of value based negotiation agreement with prospect, listening and understanding prospects, managing non- monetary points of negotiations. This is a Key Considerations For Effective B2B Sales Negotiations Diagrams PDF template with various stages. Focus and dispense information on three stages using this creative set, that comes with editable features. It contains large content boxes to add your information on topics like Agreement Prospect, Understand Prospects, Points Negotiation. You can also showcase facts, figures, and other relevant content using this PPT layout. Grab it now.

Bar Graph02 Success PowerPoint Templates And PowerPoint Themes 0512
Microsoft Powerpoint Templates and Background with bar chart growth-These templates can be used for presentations relating to-Bar chart growth, abstract, business, finance, success, marketing-Bar Graph02 Success PowerPoint Templates And PowerPoint Themes 0512 Take your cause forward with passion. Our Bar Graph02 Success PowerPoint Templates And PowerPoint Themes 0512 will espouse your thoughts.

Business Growth Statistics PowerPoint Templates And PowerPoint Themes 0912
Business Growth Statistics PowerPoint Templates And PowerPoint Themes 0912-Microsoft Powerpoint Templates and Background with business growth chart-Business growth chart, internet, technology, marketing, success, finance Arm your team with our Business Growth Statistics PowerPoint Templates And PowerPoint Themes 0912. You will come out on top.
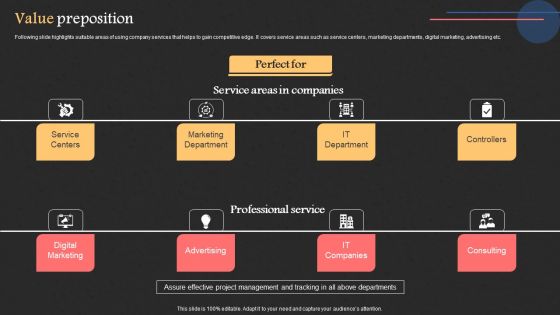
Project Management Software Capital Raising Deck Value Preposition Mockup PDF
Following slide highlights suitable areas of using company services that helps to gain competitive edge. It covers service areas such as service centers, marketing departments, digital marketing, advertising etc. Retrieve professionally designed Project Management Software Capital Raising Deck Value Preposition Mockup PDF to effectively convey your message and captivate your listeners. Save time by selecting pre made slideshows that are appropriate for various topics, from business to educational purposes. These themes come in many different styles, from creative to corporate, and all of them are easily adjustable and can be edited quickly. Access them as PowerPoint templates or as Google Slides themes. You do not have to go on a hunt for the perfect presentation because Slidegeeks got you covered from everywhere.
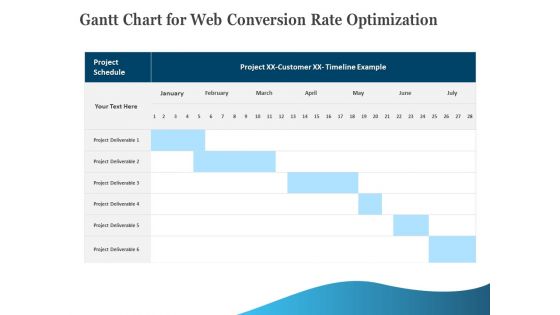
Gantt Chart For Web Conversion Rate Optimization Download PDF
Your complex projects can be managed and organized simultaneously using this detailed gantt chart for web conversion rate optimization download pdf template. Track the milestones, tasks, phases, activities, and subtasks to get an updated visual of your project. Share your planning horizon and release plan with this well-crafted presentation template. This exemplary template can be used to plot various dependencies to distinguish the tasks in the pipeline and their impact on the schedules and deadlines of the project. Apart from this, you can also share this visual presentation with your team members and stakeholders. It a resourceful tool that can be incorporated into your business structure. Therefore, download and edit it conveniently to add the data and statistics as per your requirement.
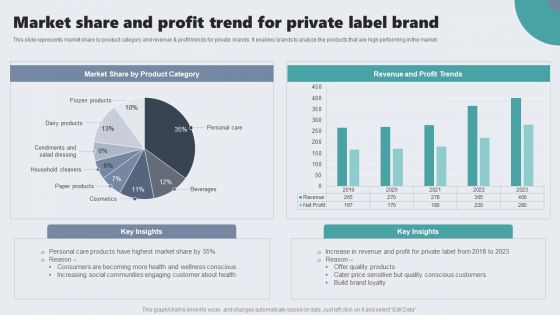
Guide To Private Branding For Increase Brand Value Market Share And Profit Trend For Private Label Brand Themes PDF
This slide represents market share by product category and revenue and profit trends for private brands. It enables brands to analyze the products that are high performing in the market. Are you in need of a template that can accommodate all of your creative concepts This one is crafted professionally and can be altered to fit any style. Use it with Google Slides or PowerPoint. Include striking photographs, symbols, depictions, and other visuals. Fill, move around, or remove text boxes as desired. Test out color palettes and font mixtures. Edit and save your work, or work with colleagues. Download Guide To Private Branding For Increase Brand Value Market Share And Profit Trend For Private Label Brand Themes PDF and observe how to make your presentation outstanding. Give an impeccable presentation to your group and make your presentation unforgettable.
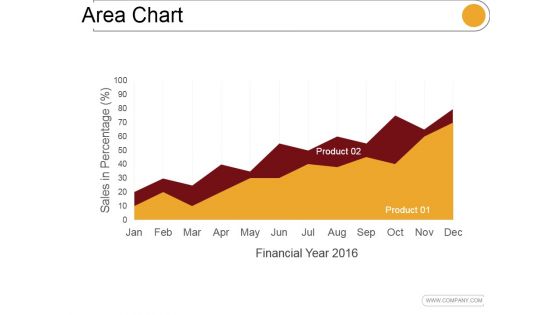
Area Chart Ppt PowerPoint Presentation Samples
This is a area chart ppt powerpoint presentation samples. This is a two stage process. The stages in this process are financial year, sales in percentage, jan, feb.
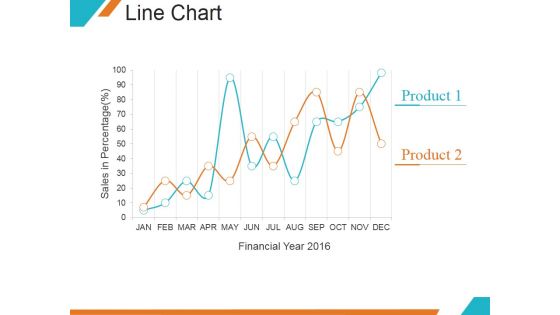
Line Chart Ppt PowerPoint Presentation Samples
This is a line chart ppt powerpoint presentation samples. This is a two stage process. The stages in this process are financial year, product, growth, marketing.
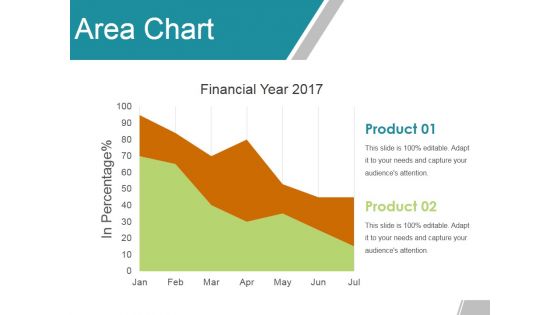
Area Chart Ppt Powerpoint Presentation Ideas Templates
This is a area chart ppt powerpoint presentation ideas templates. This is a two stage process. The stages in this process are product, financial year, in percentage, graph.
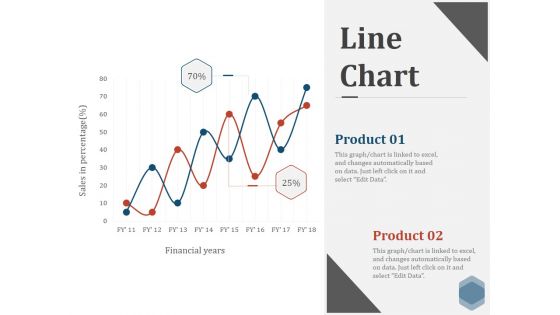
Line Chart Ppt PowerPoint Presentation Show Visuals
This is a line chart ppt powerpoint presentation show visuals. This is a two stage process. The stages in this process are financial, graph, line, marketing, success.
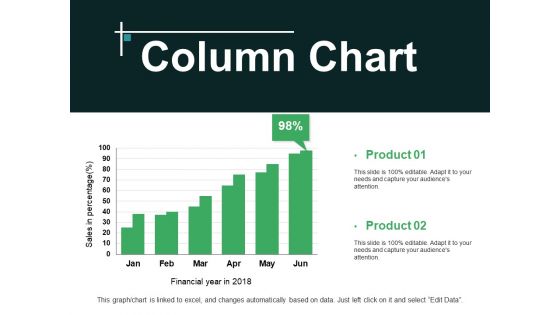
Column Chart Ppt PowerPoint Presentation Professional Aids
This is a column chart ppt powerpoint presentation professional aids. This is a two stage process. The stages in this process are product, sales in percentage, financial years.
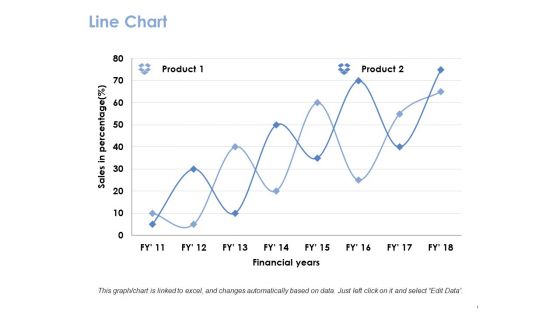
Line Chart Ppt PowerPoint Presentation Gallery Guide
This is a line chart ppt powerpoint presentation gallery guide. This is a two stage process. The stages in this process are product, financial years, sales in percentage.
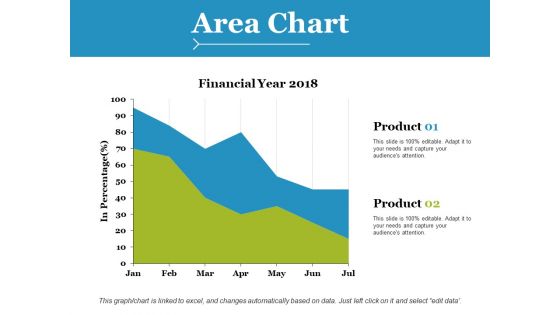
Area Chart Ppt PowerPoint Presentation Styles Brochure
This is a area chart ppt powerpoint presentation styles brochure. This is a two stage process. The stages in this process are product, financial years, in percentage.
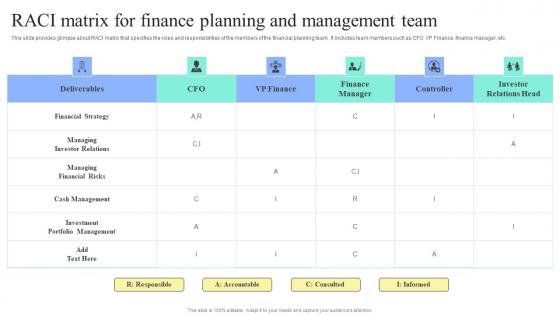
Strategic Financial Planning And Administration RACI Matrix For Finance Planning Management Team Slides PDF
This slide provides glimpse about RACI matrix that specifies the roles and responsibilities of the members of the financial planning team . It includes team members such as CFO, VP Finance, finance manager, etc. Do you know about Slidesgeeks Strategic Financial Planning And Administration RACI Matrix For Finance Planning Management Team Slides PDF These are perfect for delivering any kind od presentation. Using it, create PowerPoint presentations that communicate your ideas and engage audiences. Save time and effort by using our pre-designed presentation templates that are perfect for a wide range of topic. Our vast selection of designs covers a range of styles, from creative to business, and are all highly customizable and easy to edit. Download as a PowerPoint template or use them as Google Slides themes. This slide provides glimpse about RACI matrix that specifies the roles and responsibilities of the members of the financial planning team . It includes team members such as CFO, VP Finance, finance manager, etc.

Strategies To Select Effective Impact On Companys Revenues Formats PDF
This template covers the impact of choosing the right price optimization strategy for our company which increases companys sales and profits. The Strategies To Select Effective Impact On Companys Revenues Formats PDF is a compilation of the most recent design trends as a series of slides. It is suitable for any subject or industry presentation, containing attractive visuals and photo spots for businesses to clearly express their messages. This template contains a variety of slides for the user to input data, such as structures to contrast two elements, bullet points, and slides for written information. Slidegeeks is prepared to create an impression.
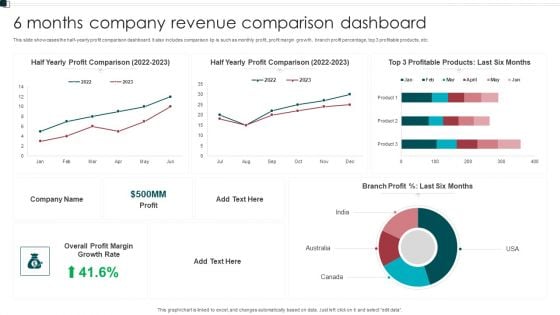
6 Months Company Revenue Comparison Dashboard Graphics PDF
This slide showcases the half yearly profit comparison dashboard. It also includes comparison kp is such as monthly profit, profit margin growth, branch profit percentage, top 3 profitable products, etc. Showcasing this set of slides titled 6 Months Company Revenue Comparison Dashboard Graphics PDF. The topics addressed in these templates are Growth Rate, Overall Profit Margin, Branch Profit. All the content presented in this PPT design is completely editable. Download it and make adjustments in color, background, font etc. as per your unique business setting.
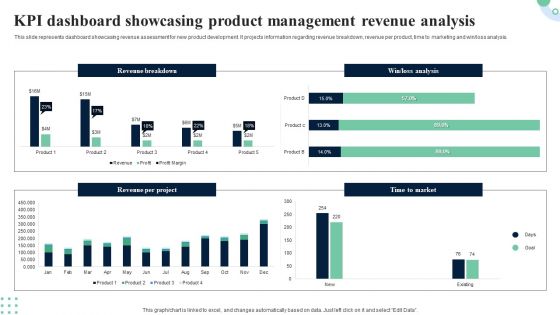
KPI Dashboard Showcasing Product Management Revenue Analysis Portrait PDF
This slide provides dashboard showcasing product development project overview with completion status. It provides information regarding cash flow statements, completion progress, project overview and product approval status. Pitch your topic with ease and precision using this KPI Dashboard Showcasing Product Management Revenue Analysis Portrait PDF. This layout presents information on Completion Progress, Product Approval Status, Cash Flow Statements. It is also available for immediate download and adjustment. So, changes can be made in the color, design, graphics or any other component to create a unique layout.
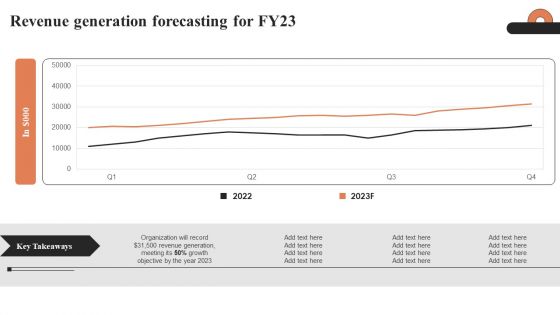
Revenue Generation Forecasting For Fy23 Ppt Portfolio Gallery PDF
Coming up with a presentation necessitates that the majority of the effort goes into the content and the message you intend to convey. The visuals of a PowerPoint presentation can only be effective if it supplements and supports the story that is being told. Keeping this in mind our experts created Revenue Generation Forecasting For Fy23 Ppt Portfolio Gallery PDF to reduce the time that goes into designing the presentation. This way, you can concentrate on the message while our designers take care of providing you with the right template for the situation.
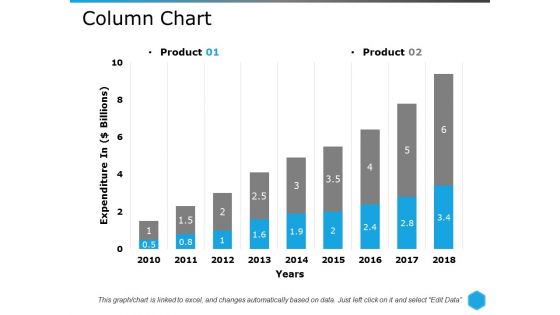
Column Chart Template 2 Ppt PowerPoint Presentation Infographic Template Example Introduction
This is a column chart template 2 ppt powerpoint presentation infographic template example introduction. This is a two stage process. The stages in this process are column chart, finance, analysis, marketing, strategy.

Pie Chart Internet PowerPoint Template 1110
3d illustration of a simple internet browser with a simple pie-chart floating in the display window There are no mixed feelings about our Pie Chart Internet PowerPoint Template 1110. They are a definite asset for all.
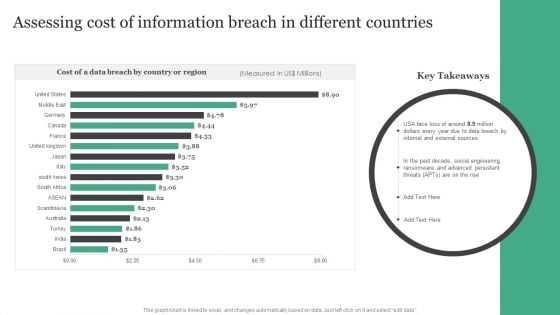
Assessing Cost Of Information Breach In Different Countries Information Security Risk Administration Topics PDF
Retrieve professionally designed Assessing Cost Of Information Breach In Different Countries Information Security Risk Administration Topics PDF to effectively convey your message and captivate your listeners. Save time by selecting pre-made slideshows that are appropriate for various topics, from business to educational purposes. These themes come in many different styles, from creative to corporate, and all of them are easily adjustable and can be edited quickly. Access them as PowerPoint templates or as Google Slides themes. You do not have to go on a hunt for the perfect presentation because Slidegeeks got you covered from everywhere.
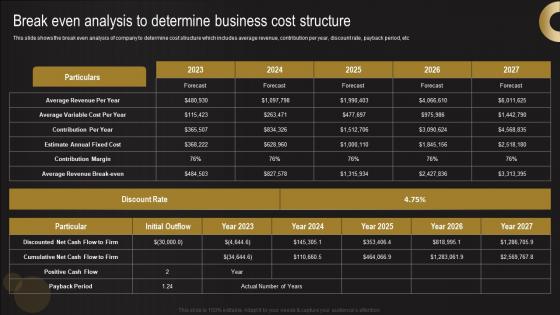
Break Even Analysis To Determine Business Cost Structure Jewelry Business Plan Download Pdf
This slide shows the break even analysis of company to determine cost structure which includes average revenue, contribution per year, discount rate, payback period, etc If you are looking for a format to display your unique thoughts, then the professionally designed Break Even Analysis To Determine Business Cost Structure Jewelry Business Plan Download Pdf is the one for you. You can use it as a Google Slides template or a PowerPoint template. Incorporate impressive visuals, symbols, images, and other charts. Modify or reorganize the text boxes as you desire. Experiment with shade schemes and font pairings. Alter, share or cooperate with other people on your work. Download Break Even Analysis To Determine Business Cost Structure Jewelry Business Plan Download Pdf and find out how to give a successful presentation. Present a perfect display to your team and make your presentation unforgettable. This slide shows the break even analysis of company to determine cost structure which includes average revenue, contribution per year, discount rate, payback period, etc
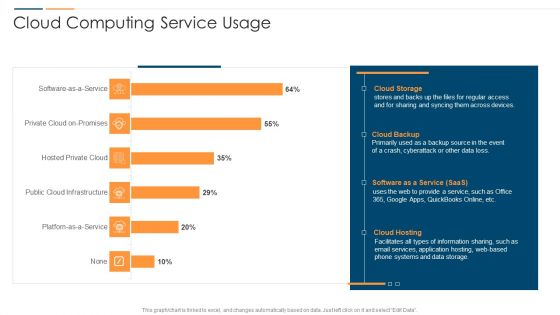
Revolution In Online Business Cloud Computing Service Usage Ppt PowerPoint Presentation File Themes PDF
This graph or chart is linked to excel, and changes automatically based on data. Just left click on it and select Edit Data. Deliver and pitch your topic in the best possible manner with this Revolution In Online Business Cloud Computing Service Usage Ppt PowerPoint Presentation File Themes PDF. Use them to share invaluable insights on Cloud Storage System, Cloud Backup Saas, Cloud Hosting Storage and impress your audience. This template can be altered and modified as per your expectations. So, grab it now.
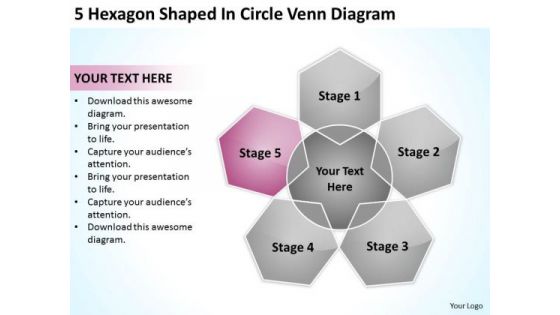
5 Hexagon Shaped In Circle Venn Diagram Ppt Business Financial Plan PowerPoint Templates
We present our 5 hexagon shaped in circle venn diagram ppt business financial plan PowerPoint templates.Download and present our Circle Charts PowerPoint Templates because Our PowerPoint Templates and Slides will let you Leave a lasting impression to your audiences. They possess an inherent longstanding recall factor. Use our Marketing PowerPoint Templates because These PowerPoint Templates and Slides will give the updraft to your ideas. See them soar to great heights with ease. Use our Business PowerPoint Templates because our PowerPoint Templates and Slides are the string of your bow. Fire of your ideas and conquer the podium. Download our Shapes PowerPoint Templates because Our PowerPoint Templates and Slides help you pinpoint your timelines. Highlight the reasons for your deadlines with their use. Download and present our Process and Flows PowerPoint Templates because Our PowerPoint Templates and Slides are Clear and concise. Use them and dispel any doubts your team may have.Use these PowerPoint slides for presentations relating to Flow, chart, business concept, step, future, business, vector, sign, presentation, symbol, template, process, flowchart, report, title, shape, abstract, illustration, system, strategy, project, catalog, round, color full, web, solution, design, color, text, motion, hexagon, structure . The prominent colors used in the PowerPoint template are Pink, Gray, Black. Many a popular belief turn out fallacious. Establish the factual position with our 5 Hexagon Shaped In Circle Venn Diagram Ppt Business Financial Plan PowerPoint Templates.
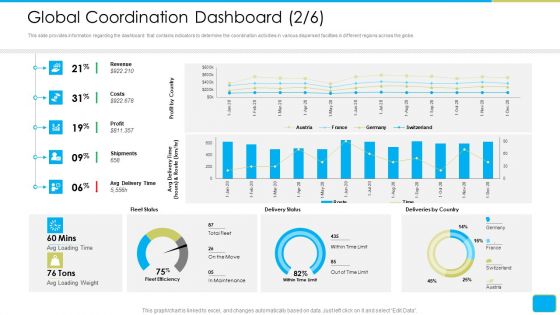
Cross Border Integration In Multinational Corporation Global Coordination Dashboard Revenue Information PDF
This slide provides information regarding the dashboard that contains indicators to determine the coordination activities in various dispersed facilities in different regions across the globe. Deliver and pitch your topic in the best possible manner with this cross border integration in multinational corporation global coordination dashboard revenue information pdf. Use them to share invaluable insights on revenue, costs, profit, shipments, avg delivery time and impress your audience. This template can be altered and modified as per your expectations. So, grab it now.
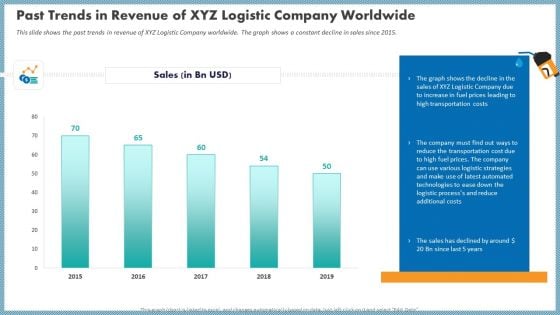
Past Trends In Revenue Of XYZ Logistic Company Worldwide Inspiration PDF
This slide shows the past trends in revenue of XYZ Logistic Company worldwide. The graph shows a constant decline in sales since 2015. Deliver an awe inspiring pitch with this creative past trends in revenue of xyz logistic company worldwide inspiration pdf bundle. Topics like transportation costs, prices, strategies, process, technology can be discussed with this completely editable template. It is available for immediate download depending on the needs and requirements of the user.
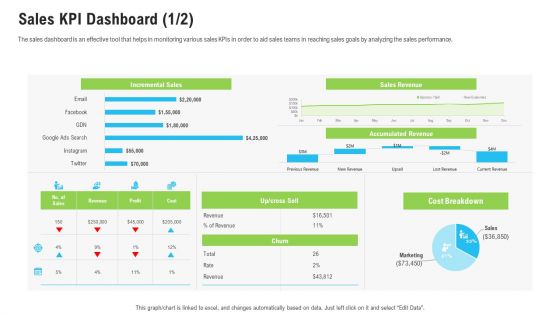
Sales Department Strategies Increase Revenues Sales KPI Dashboard Email Ppt Outline Microsoft PDF
The sales dashboard is an effective tool that helps in monitoring various sales KPIs in order to aid sales teams in reaching sales goals by analyzing the sales performance. Deliver an awe-inspiring pitch with this creative sales department strategies increase revenues sales kpi dashboard email ppt outline microsoft pdf bundle. Topics like sales revenue, cost breakdown, marketing can be discussed with this completely editable template. It is available for immediate download depending on the needs and requirements of the user.
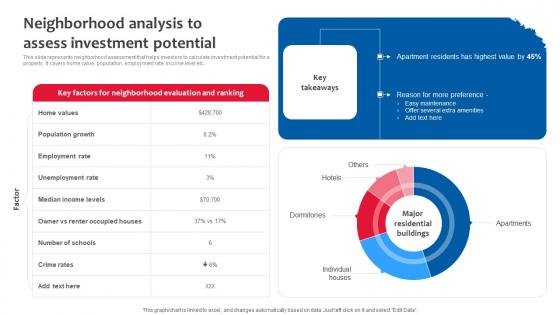
Neighborhood Analysis To Assess Deploying Effective Property Flipping Strategies Ideas Pdf
This slide represents neighborhood assessment that helps investors to calculate investment potential for a property. It covers home value, population, employment rate, income level etc. Do you have to make sure that everyone on your team knows about any specific topic I yes, then you should give Neighborhood Analysis To Assess Deploying Effective Property Flipping Strategies Ideas Pdf a try. Our experts have put a lot of knowledge and effort into creating this impeccable Neighborhood Analysis To Assess Deploying Effective Property Flipping Strategies Ideas Pdf. You can use this template for your upcoming presentations, as the slides are perfect to represent even the tiniest detail. You can download these templates from the Slidegeeks website and these are easy to edit. So grab these today This slide represents neighborhood assessment that helps investors to calculate investment potential for a property. It covers home value, population, employment rate, income level etc.
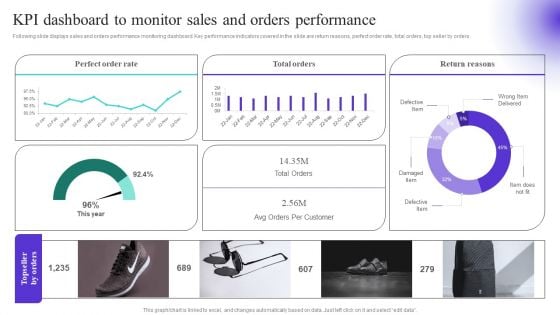
KPI Dashboard To Monitor Sales And Orders Performance Diagrams PDF
Following slide displays sales and orders performance monitoring dashboard. Key performance indicators covered in the slide are return reasons, perfect order rate, total orders, top seller by orders. Create an editable KPI Dashboard To Monitor Sales And Orders Performance Diagrams PDF that communicates your idea and engages your audience. Whether you are presenting a business or an educational presentation, pre designed presentation templates help save time. KPI Dashboard To Monitor Sales And Orders Performance Diagrams PDF is highly customizable and very easy to edit, covering many different styles from creative to business presentations. Slidegeeks has creative team members who have crafted amazing templates. So, go and get them without any delay.
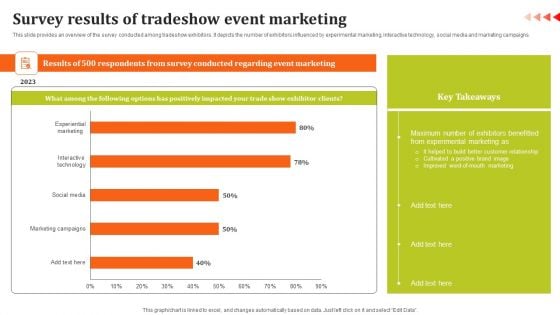
Survey Results Of Tradeshow Event Marketing Diagrams PDF
This slide provides an overview of the survey conducted among tradeshow exhibitors. It depicts the number of exhibitors influenced by experimental marketing, interactive technology, social media and marketing campaigns. Get a simple yet stunning designed Survey Results Of Tradeshow Event Marketing Diagrams PDF. It is the best one to establish the tone in your meetings. It is an excellent way to make your presentations highly effective. So, download this PPT today from Slidegeeks and see the positive impacts. Our easy to edit Survey Results Of Tradeshow Event Marketing Diagrams PDF can be your go to option for all upcoming conferences and meetings. So, what are you waiting for Grab this template today.
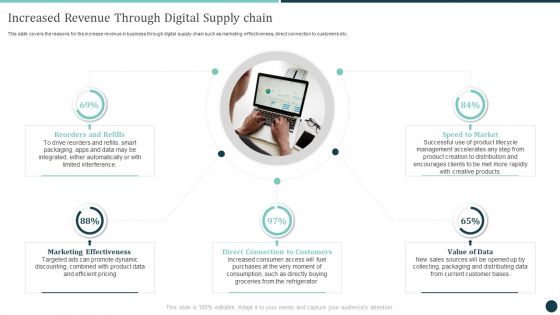
Increased Revenue Through Digital Supply Chain Logistics Strategy To Improve Structure PDF
The best PPT templates are a great way to save time, energy, and resources. Slidegeeks have 100precent editable powerpoint slides making them incredibly versatile. With these quality presentation templates, you can create a captivating and memorable presentation by combining visually appealing slides and effectively communicating your message. Download Increased Revenue Through Digital Supply Chain Logistics Strategy To Improve Structure PDF from Slidegeeks and deliver a wonderful presentation.
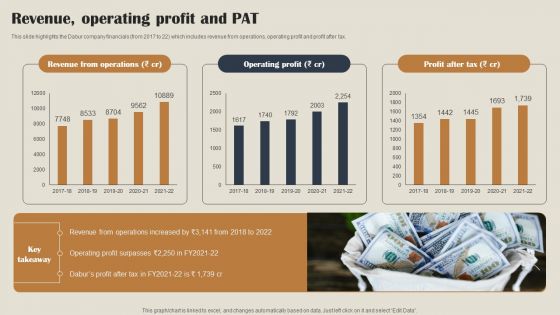
Self Care Products Company Outline Revenue Operating Profit And PAT Background PDF
The best PPT templates are a great way to save time, energy, and resources. Slidegeeks have 100 percent editable powerpoint slides making them incredibly versatile. With these quality presentation templates, you can create a captivating and memorable presentation by combining visually appealing slides and effectively communicating your message. Download Self Care Products Company Outline Revenue Operating Profit And PAT Background PDF from Slidegeeks and deliver a wonderful presentation.

Global Financial Economy Pie Chart PowerPoint Templates Ppt Backgrounds For Slides 0513
With our globe powerpoint templates you will be doubly sure. They possess that stamp of authority. Our earth powerpoint templates do it in double quick time. Speed up the process in a tangible way. The worth of our Global Financial Economy Pie Chart PowerPoint Templates Ppt Backgrounds For Slides 0513 is self evident. Their ability is there for all to see.


 Continue with Email

 Home
Home


