Money Icon
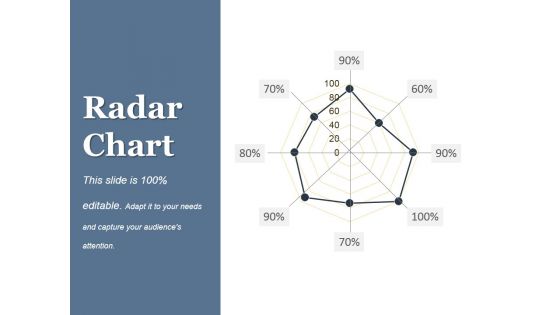
Radar Chart Ppt PowerPoint Presentation Gallery Design Ideas
This is a radar chart ppt powerpoint presentation gallery design ideas. This is a eight stage process. The stages in this process are business, marketing, strategy, planning, graph.
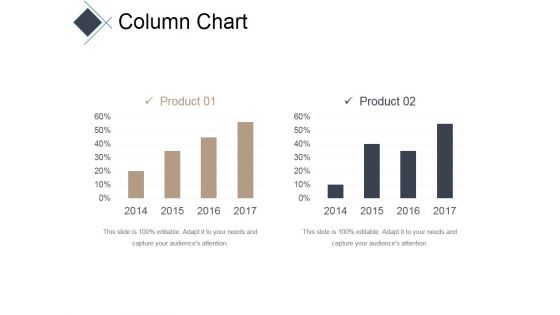
Column Chart Ppt PowerPoint Presentation Infographic Template Inspiration
This is a column chart ppt powerpoint presentation infographic template inspiration. This is a two stage process. The stages in this process are bar, years, business, marketing, success.
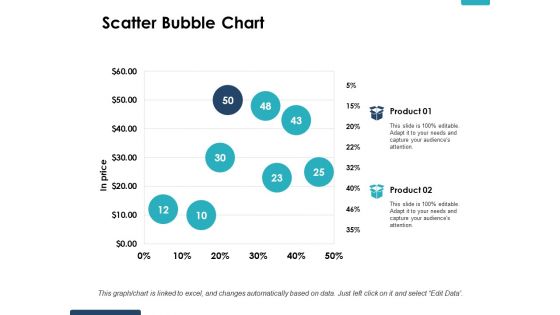
Scatter Bubble Chart Ppt PowerPoint Presentation Layouts Gridlines
This is a scatter bubble chart ppt powerpoint presentation layouts gridlines. This is a two stage process. The stages in this process are percentage, product, business, marketing.
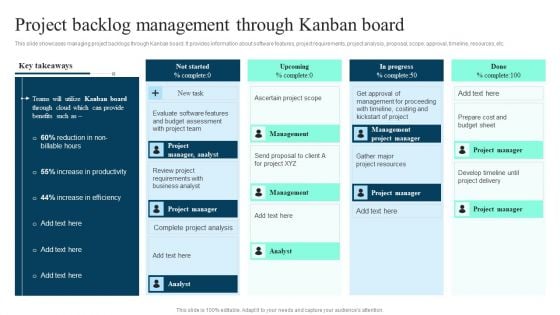
Project Backlog Management Through Kanban Board Ppt PowerPoint Presentation Diagram Graph Charts PDF
This slide showcases managing project backlogs through Kanban board. It provides information about software features, project requirements, project analysis, proposal, scope, approval, timeline, resources, etc. Slidegeeks is here to make your presentations a breeze with Project Backlog Management Through Kanban Board Ppt PowerPoint Presentation Diagram Graph Charts PDF With our easy to use and customizable templates, you can focus on delivering your ideas rather than worrying about formatting. With a variety of designs to choose from, you are sure to find one that suits your needs. And with animations and unique photos, illustrations, and fonts, you can make your presentation pop. So whether you are giving a sales pitch or presenting to the board, make sure to check out Slidegeeks first.
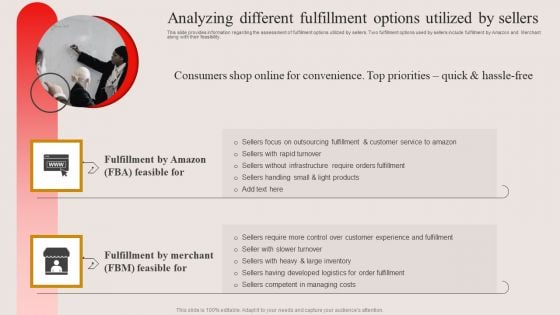
Analyzing Different Fulfillment Options Utilized By Sellers Ppt PowerPoint Presentation Diagram Graph Charts PDF
This slide provides information regarding the assessment of fulfillment options utilized by sellers. Two fulfillment options used by sellers include fulfillment by Amazon and Merchant along with their feasibility. Slidegeeks is one of the best resources for PowerPoint templates. You can download easily and regulate Analyzing Different Fulfillment Options Utilized By Sellers Ppt PowerPoint Presentation Diagram Graph Charts PDF for your personal presentations from our wonderful collection. A few clicks is all it takes to discover and get the most relevant and appropriate templates. Use our Templates to add a unique zing and appeal to your presentation and meetings. All the slides are easy to edit and you can use them even for advertisement purposes.
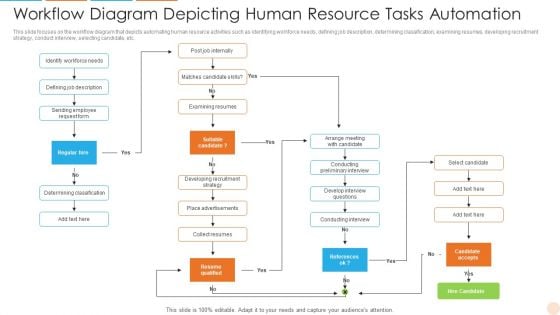
Workflow Diagram Depicting Human Resource Tasks Automation Rules PDF
This slide focuses on the workflow diagram that depicts automating human resource activities such as identifying workforce needs, defining job description, determining classification, examining resumes, developing recruitment strategy, conduct interview, selecting candidate, etc. Showcasing this set of slides titled Workflow Diagram Depicting Human Resource Tasks Automation Rules PDF. The topics addressed in these templates are Strategy, Develop, Determining Classification. All the content presented in this PPT design is completely editable. Download it and make adjustments in color, background, font etc. as per your unique business setting.
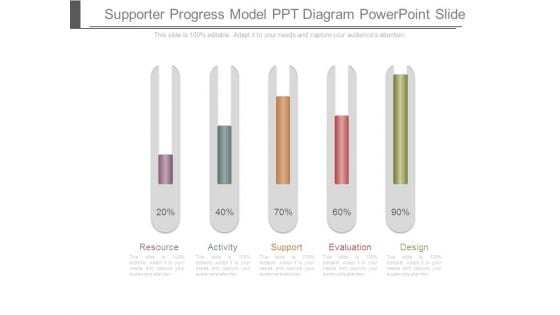
Supporter Progress Model Ppt Diagram Powerpoint Slide
This is a supporter progress model ppt diagram powerpoint slide. This is a five stage process. The stages in this process are resource, activity, support, evaluation, design.
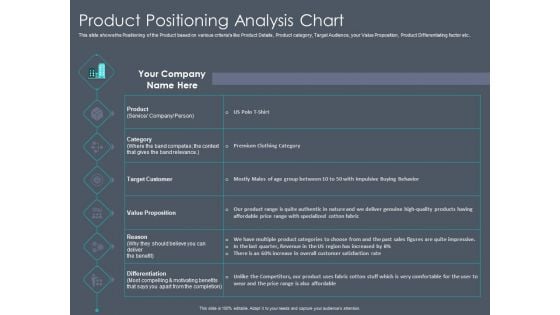
Private Equity Fund Pitch Deck To Raise Series C Funding Product Positioning Analysis Chart Guidelines PDF
Deliver an awe-inspiring pitch with this creative private equity fund pitch deck to raise series c funding product positioning analysis chart guidelines pdf bundle. Topics like product, target customer, value proposition, reason, differentiation, analysis can be discussed with this completely editable template. It is available for immediate download depending on the needs and requirements of the user.
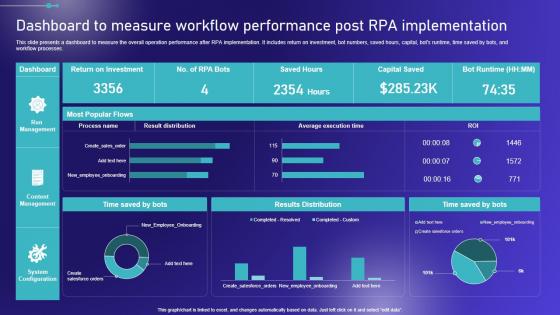
Dashboard To Measure Workflow Performance Post Embracing Robotic Process Portrait PDF
This slide presents a dashboard to measure the overall operation performance after RPA implementation. It includes return on investment, bot numbers, saved hours, capital, bots runtime, time saved by bots, and workflow processes. Are you in need of a template that can accommodate all of your creative concepts This one is crafted professionally and can be altered to fit any style. Use it with Google Slides or PowerPoint. Include striking photographs, symbols, depictions, and other visuals. Fill, move around, or remove text boxes as desired. Test out color palettes and font mixtures. Edit and save your work, or work with colleagues. Download Dashboard To Measure Workflow Performance Post Embracing Robotic Process Portrait PDF and observe how to make your presentation outstanding. Give an impeccable presentation to your group and make your presentation unforgettable. This slide presents a dashboard to measure the overall operation performance after RPA implementation. It includes return on investment, bot numbers, saved hours, capital, bots runtime, time saved by bots, and workflow processes.
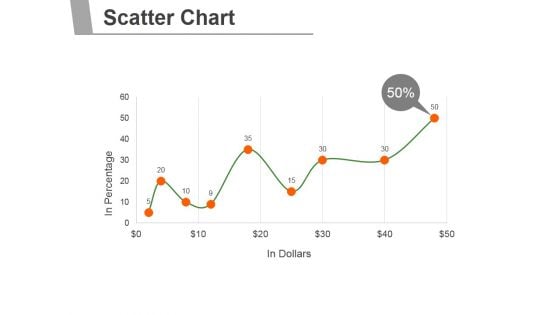
Scatter Chart Ppt PowerPoint Presentation Rules
This is a scatter chart ppt powerpoint presentation rules. This is a ten stage process. The stages in this process are business, marketing, scatter chart, growth, management.
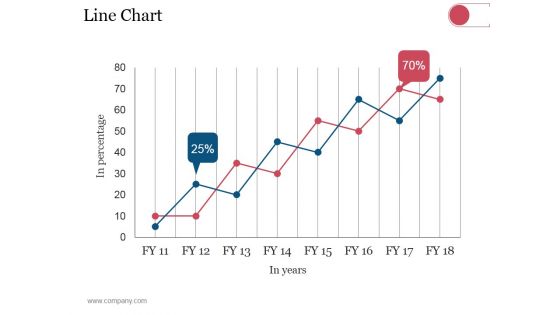
Line Chart Ppt PowerPoint Presentation Model Elements
This is a line chart ppt powerpoint presentation model elements. This is a eight stage process. The stages in this process are business, strategy, analysis, planning, line chart.
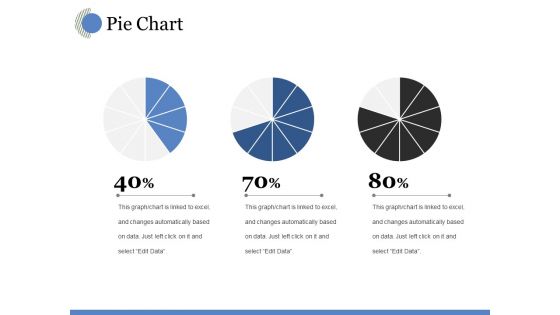
Pie Chart Ppt PowerPoint Presentation Professional Graphics
This is a pie chart ppt powerpoint presentation professional graphics. This is a three stage process. The stages in this process are chart, percentage, business, marketing, strategy.
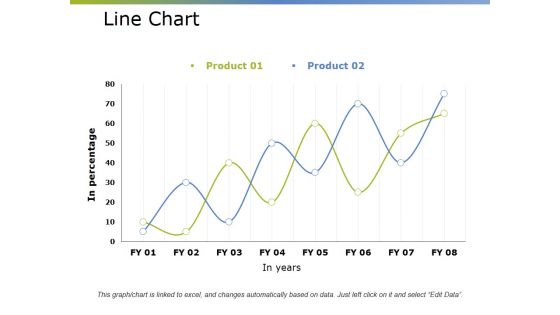
Line Chart Ppt PowerPoint Presentation Professional Gridlines
This is a line chart ppt powerpoint presentation professional gridlines. This is a two stage process. The stages in this process are business, marketing, growth, success, line chart.
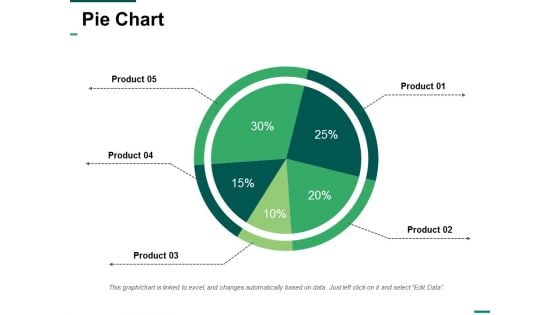
Pie Chart Ppt PowerPoint Presentation Designs Download
This is a pie chart ppt powerpoint presentation designs download. This is a five stage process. The stages in this process are pie chart, business, marketing, strategy, planning.
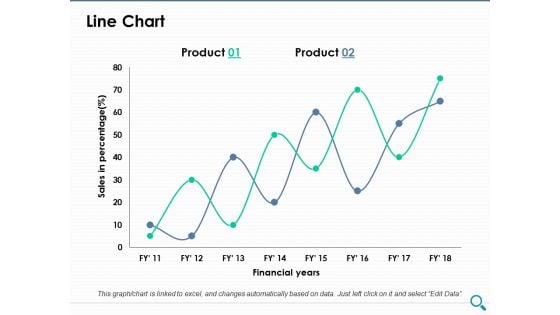
Line Chart Ppt PowerPoint Presentation Model Model
This is a line chart ppt powerpoint presentation model model. This is a two stage process. The stages in this process are line chart, growth, strategy, business, analysis.
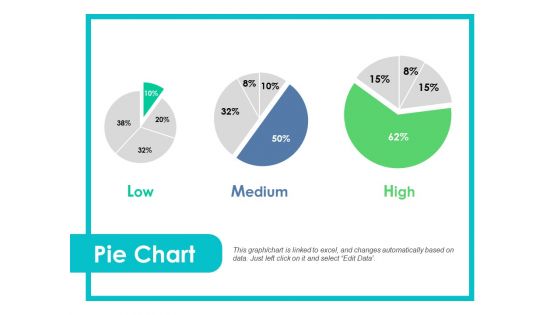
Pie Chart Ppt PowerPoint Presentation Gallery Brochure
This is a pie chart ppt powerpoint presentation gallery brochure. This is a three stages process. The stages in this process are low, medium, high, pie chart.
Requirement Analysis Technique Gantt Chart Guidelines Pdf
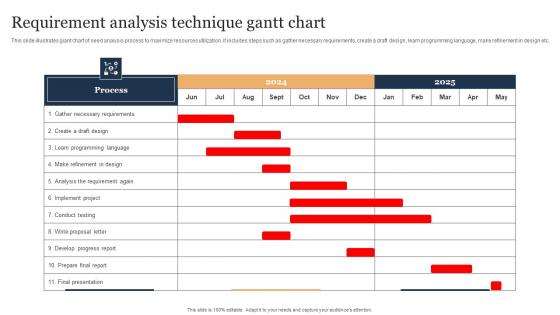
This slide illustrates giant chart of need analysis process to maximize resources utilization. It includes steps such as gather necessary requirements, create a draft design, learn programming language, make refinement in design etc. Pitch your topic with ease and precision using this Requirement Analysis Technique Gantt Chart Guidelines Pdf. This layout presents information on Requirement Analysis Technique, Resources Utilization, Learn Programming Language. It is also available for immediate download and adjustment. So, changes can be made in the color, design, graphics or any other component to create a unique layout. This slide illustrates giant chart of need analysis process to maximize resources utilization. It includes steps such as gather necessary requirements, create a draft design, learn programming language, make refinement in design etc.
Microsoft Strategic Plan To Become Market Leader Key Revenue Generation Sources Of Microsoft Formats PDF
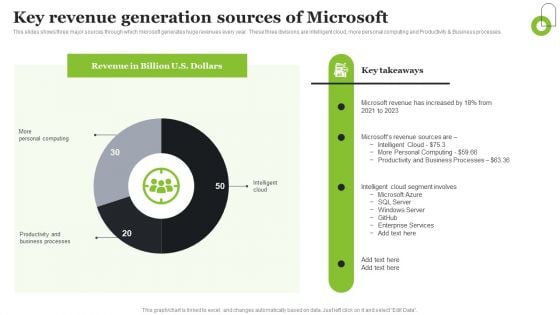
This slides shows three major sources through which microsoft generates huge revenues every year. These three divisions are intelligent cloud, more personal computing and Productivity and Business processes. Slidegeeks is one of the best resources for PowerPoint templates. You can download easily and regulate Microsoft Strategic Plan To Become Market Leader Key Revenue Generation Sources Of Microsoft Formats PDF for your personal presentations from our wonderful collection. A few clicks is all it takes to discover and get the most relevant and appropriate templates. Use our Templates to add a unique zing and appeal to your presentation and meetings. All the slides are easy to edit and you can use them even for advertisement purposes.
Approaches To Achieve Target 5 Stages Ppt Startup Business Plans PowerPoint Templates
We present our approaches to achieve target 5 stages ppt startup business plans PowerPoint templates.Use our Business PowerPoint Templates because the NASA Space programme took mankind to the moon and so much more. Like them you too can look far beyond normal boundaries. Show them that in your mind the sky is certainly not the limit. Use our Process and Flows PowerPoint Templates because spreading the light of knowledge around you will clear the doubts and enlighten the questioning minds with your brilliance and ability. Use our Success PowerPoint Templates because you have come up with a brilliant breakthrough idea. you can also visualise the interest it will generate. Present our Arrows PowerPoint Templates because you know that the core of any organisation is the people who work for it. Download our Flow Charts PowerPoint Templates because you have a good grasp of the essentials of such a venture. Alternate energy presents an array of opportunities.Use these PowerPoint slides for presentations relating to Account, Achievement, Aim, Arrow, Business, Diagram, Finance, Financial, Graph, Grow, Growing, Growth, Idea, Illustration, Increase, Isolated, Market, Performance, Pointing, Progress, Report, Stock, success. The prominent colors used in the PowerPoint template are Orange, Gray, White. Use our approaches to achieve target 5 stages ppt startup business plans PowerPoint templates are Elevated. Customers tell us our Aim PowerPoint templates and PPT Slides are Striking. You can be sure our approaches to achieve target 5 stages ppt startup business plans PowerPoint templates are Tasteful. The feedback we get is that our Diagram PowerPoint templates and PPT Slides are Liberated. You can be sure our approaches to achieve target 5 stages ppt startup business plans PowerPoint templates are Youthful. People tell us our Graph PowerPoint templates and PPT Slides are Beautiful. Guide your ambitions with our Approaches To Achieve Target 5 Stages Ppt Startup Business Plans PowerPoint Templates. You will come out on top.
Recruitment Budget Ppt PowerPoint Presentation Visual Aids Diagrams
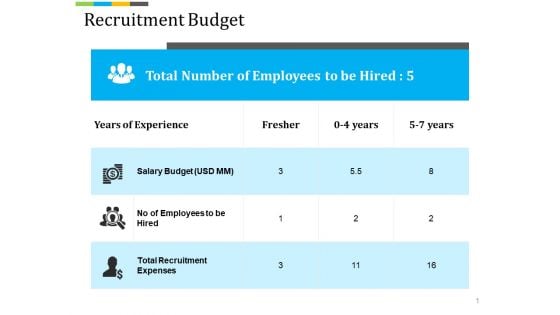
This is a recruitment budget ppt powerpoint presentation visual aids diagrams. This is a three stage process. The stages in this process are years of experience, fresher, salary budget, total recruitment.
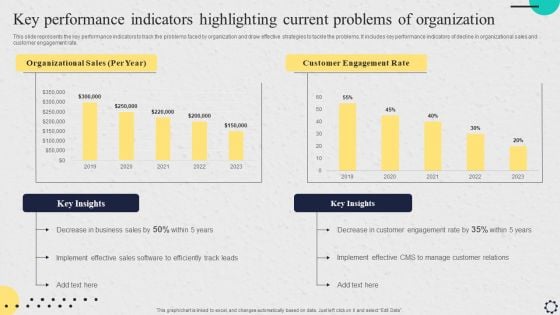
Software Implementation Strategy Key Performance Indicators Highlighting Current Problems Of Organization Professional PDF
This slide represents the key performance indicators to track the problems faced by organization and draw effective strategies to tackle the problems. It includes key performance indicators of decline in organizational sales and customer engagement rate. Make sure to capture your audiences attention in your business displays with our gratis customizable Software Implementation Strategy Key Performance Indicators Highlighting Current Problems Of Organization Professional PDF. These are great for business strategies, office conferences, capital raising or task suggestions. If you desire to acquire more customers for your tech business and ensure they stay satisfied, create your own sales presentation with these plain slides.
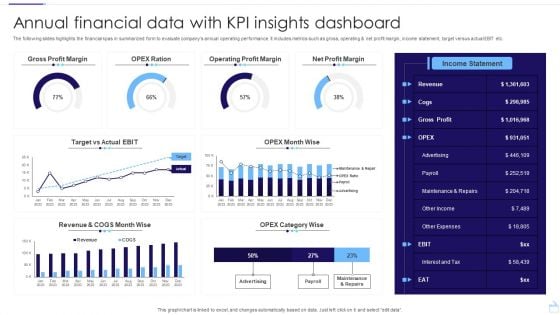
Annual Financial Data With KPI Insights Dashboard Structure PDF
The following slides highlights the financial kpas in summarized form to evaluate companys annual operating performance. It includes metrics such as gross, operating and net profit margin, income statement, target versus actual EBIT etc. Pitch your topic with ease and precision using this Annual Financial Data With KPI Insights Dashboard Structure PDF. This layout presents information on Gross Profit Margin, Operating Profit Margin, Net Profit Margin. It is also available for immediate download and adjustment. So, changes can be made in the color, design, graphics or any other component to create a unique layout.
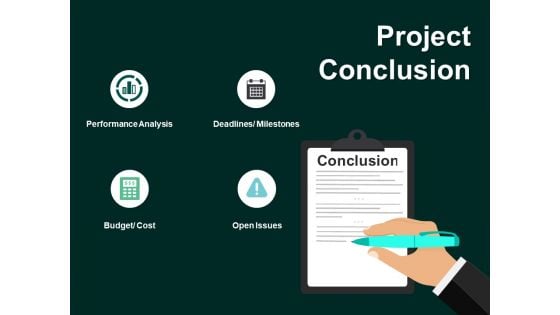
Project Conclusion Budget Ppt PowerPoint Presentation Gallery Diagrams
This is a project conclusion budget ppt powerpoint presentation gallery diagrams. This is a four stage process. The stages in this process are business, planning, strategy, analysis, marketing.
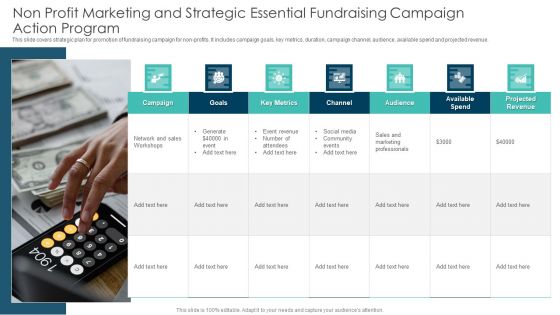
Non Profit Marketing And Strategic Essential Fundraising Campaign Action Program Topics PDF
This slide covers strategic plan for promotion of fundraising campaign for non-profits. It includes campaign goals, key metrics, duration, campaign channel, audience, available spend and projected revenue. Presenting Non Profit Marketing And Strategic Essential Fundraising Campaign Action Program Topics PDF to dispense important information. This template comprises seven stages. It also presents valuable insights into the topics including Campaign, Goals, Key Metrics, Audience, Projected Revenue. This is a completely customizable PowerPoint theme that can be put to use immediately. So, download it and address the topic impactfully.

Techniques To Decrease Customer Decline In Revenues Due To High Attrition Rate Pictures PDF
This slide shows the decline in revenues due to high attrition rate, increased customer acquisition costs, lack of latest technologies, poor customer services which impacts the number of customers associated with company. Do you have an important presentation coming up Are you looking for something that will make your presentation stand out from the rest Look no further than Techniques To Decrease Customer Decline In Revenues Due To High Attrition Rate Pictures PDF. With our professional designs, you can trust that your presentation will pop and make delivering it a smooth process. And with Slidegeeks, you can trust that your presentation will be unique and memorable. So why wait Grab Techniques To Decrease Customer Decline In Revenues Due To High Attrition Rate Pictures PDF today and make your presentation stand out from the rest.
Contact Us For Human Resource Management Platform Diagrams PDF
This is a Contact Us For Human Resource Management Platform Diagrams PDF template with various stages. Focus and dispense information on three stages using this creative set, that comes with editable features. It contains large content boxes to add your information on topics like Human Resource, Management Platform. You can also showcase facts, figures, and other relevant content using this PPT layout. Grab it now.
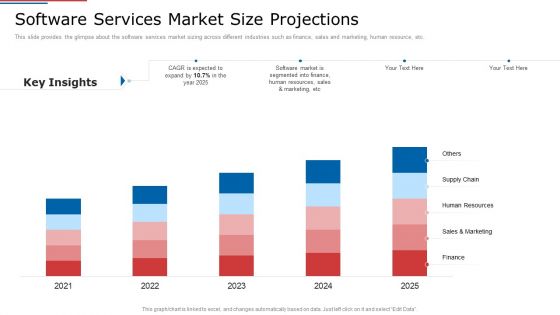
IT Services Shareholder Funding Elevator Software Services Market Size Projections Designs PDF
This slide provides the glimpse about the software services market sizing across different industries such as finance, sales and marketing, human resource, etc. Deliver an awe inspiring pitch with this creative it services shareholder funding elevator software services market size projections designs pdf bundle. Topics like finance, sales and marketing, human resource can be discussed with this completely editable template. It is available for immediate download depending on the needs and requirements of the user.
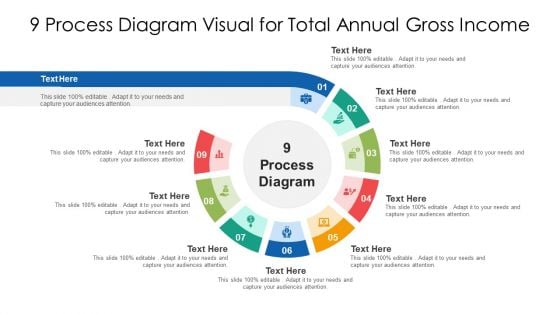
9 Process Diagram Visual For Total Annual Gross Income Ppt PowerPoint Presentation Visual Aids Backgrounds PDF
Persuade your audience using this 9 process diagram visual for total annual gross income ppt powerpoint presentation visual aids backgrounds pdf. This PPT design covers nine stages, thus making it a great tool to use. It also caters to a variety of topics including 9 process diagram visual for total annual gross income. Download this PPT design now to present a convincing pitch that not only emphasizes the topic but also showcases your presentation skills.
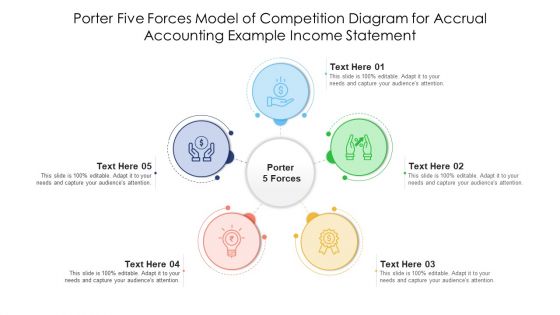
Porter Five Forces Model Of Competition Diagram For Accrual Accounting Example Income Statement Demonstration PDF
Persuade your audience using this porter five forces model of competition diagram for accrual accounting example income statement demonstration pdf. This PPT design covers five stages, thus making it a great tool to use. It also caters to a variety of topics including porter five forces model of competition diagram for accrual accounting example income statement. Download this PPT design now to present a convincing pitch that not only emphasizes the topic but also showcases your presentation skills.
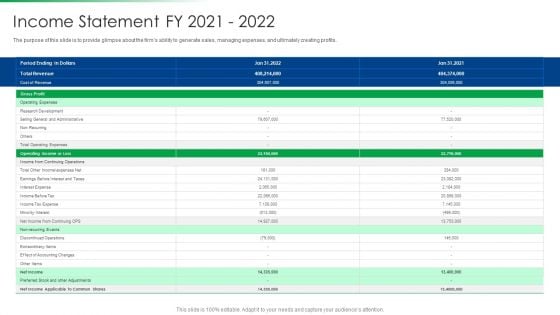
Strawman Project Action Plan Income Statement Fy 2021 To 2022 Diagrams PDF
Deliver and pitch your topic in the best possible manner with this strawman project action plan income statement fy 2021 to 2022 diagrams pdf. Use them to share invaluable insights on total operating expenses, interest expense, income, minority interest and impress your audience. This template can be altered and modified as per your expectations. So, grab it now.
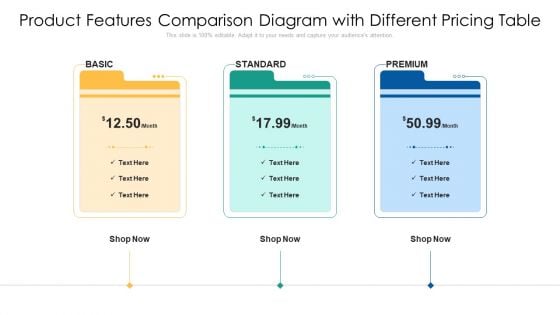
Product Features Comparison Diagram With Different Pricing Table Information PDF
Presenting product features comparison diagram with different pricing table information pdf to dispense important information. This template comprises three stages. It also presents valuable insights into the topics including product features comparison diagram with different pricing table. This is a completely customizable PowerPoint theme that can be put to use immediately. So, download it and address the topic impactfully.
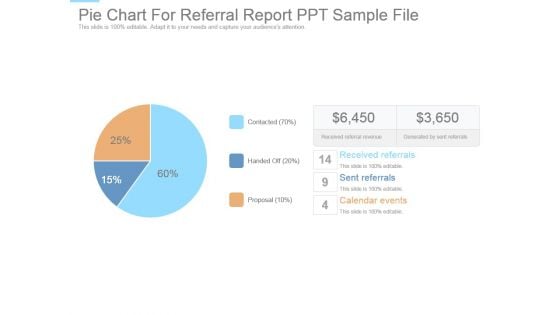
Pie Chart For Referral Report Ppt Sample File
This is a pie chart for referral report ppt sample file. This is a three stage process. The stages in this process are received referrals, sent referrals, calendar events, proposal, handed off, contacted, received referral revenue, generated by sent referrals.
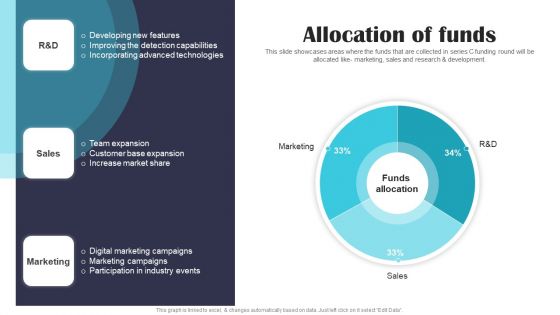
Security Software Company Investor Funding Pitch Deck Allocation Of Funds Portrait PDF
This slide showcases areas where the funds that are collected in series C funding round will be allocated like- marketing, sales and research and development. If you are looking for a format to display your unique thoughts, then the professionally designed Security Software Company Investor Funding Pitch Deck Allocation Of Funds Portrait PDF is the one for you. You can use it as a Google Slides template or a PowerPoint template. Incorporate impressive visuals, symbols, images, and other charts. Modify or reorganize the text boxes as you desire. Experiment with shade schemes and font pairings. Alter, share or cooperate with other people on your work. Download Security Software Company Investor Funding Pitch Deck Allocation Of Funds Portrait PDF and find out how to give a successful presentation. Present a perfect display to your team and make your presentation unforgettable.
Integrated Water Resource Management Idea Generation Diagrams PDF
Presenting this set of slides with name integrated water resource management idea generation diagrams pdf. This is a three stage process. The stages in this process are idea generation. This is a completely editable PowerPoint presentation and is available for immediate download. Download now and impress your audience.
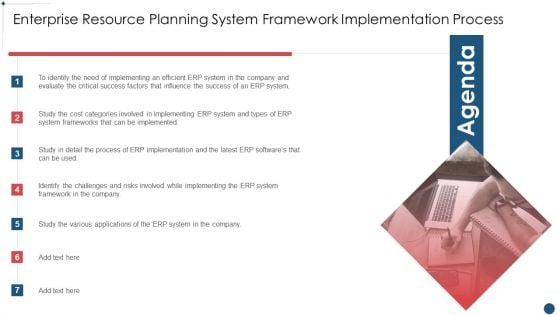
Agenda Enterprise Resource Planning System Framework Implementation Process Diagrams PDF
This is a Agenda Enterprise Resource Planning System Framework Implementation Process Diagrams PDF template with various stages. Focus and dispense information on seven stages using this creative set, that comes with editable features. It contains large content boxes to add your information on topics like Agenda You can also showcase facts, figures, and other relevant content using this PPT layout. Grab it now.
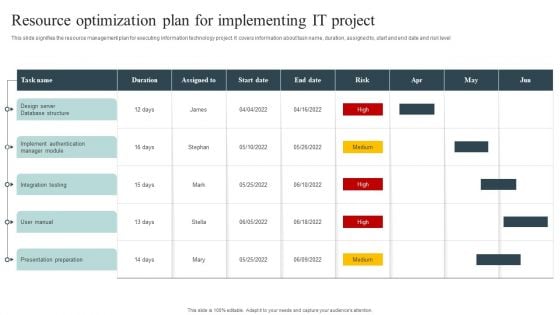
Resource Optimization Plan For Implementing It Project Diagrams PDF
Showcasing this set of slides titled Resource Optimization Plan For Implementing It Project Diagrams PDF. The topics addressed in these templates are Presentation Preparation, Implement Authentication, Database Structure. All the content presented in this PPT design is completely editable. Download it and make adjustments in color, background, font etc. as per your unique business setting.
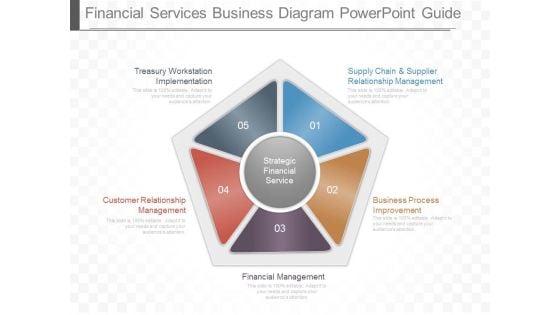
Financial Services Business Diagram Powerpoint Guide
This is a financial services business diagram powerpoint guide. This is a five stage process. The stages in this process are treasury workstation implementation, customer relationship management, financial management, business process improvement, supply chain and supplier relationship management, strategic financial service.
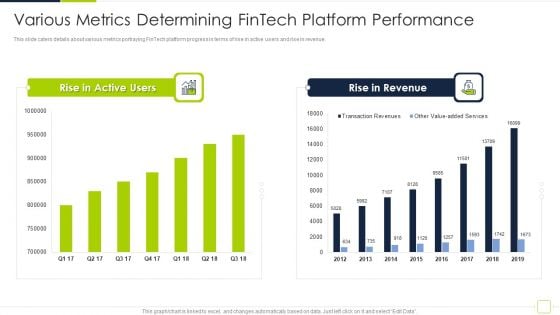
Fintech Solutions Company Venture Capitalist Funding Elevator Various Metrics Determining Fintech Platform Diagrams PDF
This slide caters details about various metrics portraying FinTech platform progress in terms of rise in active users and rise in revenue. Deliver an awe inspiring pitch with this creative fintech solutions company venture capitalist funding elevator various metrics determining fintech platform diagrams pdf bundle. Topics like various metrics determining fintech platform performance can be discussed with this completely editable template. It is available for immediate download depending on the needs and requirements of the user.
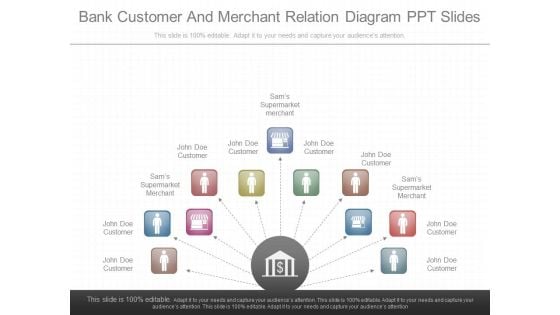
Bank Customer And Merchant Relation Diagram Ppt Slides
This is a bank customer and merchant relation diagram ppt slides. This is a eleven stage process. The stages in this process are john doe customer, sams supermarket merchant.
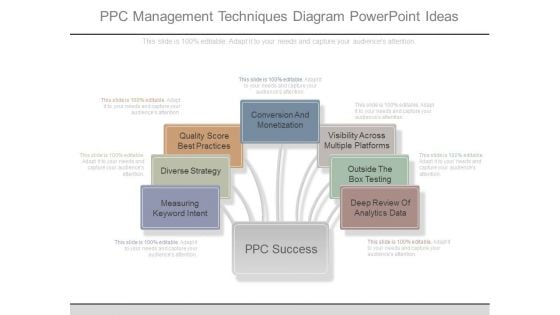
Ppc Management Techniques Diagram Powerpoint Ideas
This is a ppc management techniques diagram powerpoint ideas. This is a seven stage process. The stages in this process are measuring keyword intent, diverse strategy, quality score best practices, conversion and monetization, visibility across multiple platforms, outside the box testing, deep review of analytics data, ppc success.
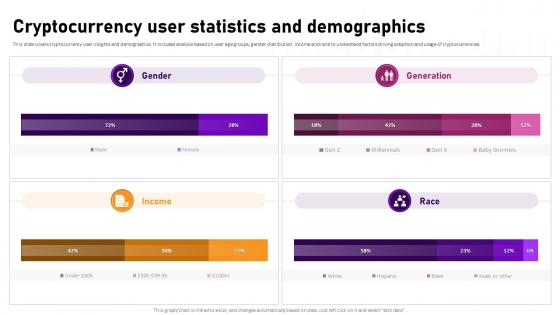
Cryptocurrency User Statistics And Demographics Complete Roadmap To Blockchain BCT SS V
This slide covers cryptocurrency user insights and demographics. It includes analysis based on user age groups, gender distribution, income and race to understand factors driving adoption and usage of cryptocurrencies. Make sure to capture your audiences attention in your business displays with our gratis customizable Cryptocurrency User Statistics And Demographics Complete Roadmap To Blockchain BCT SS V. These are great for business strategies, office conferences, capital raising or task suggestions. If you desire to acquire more customers for your tech business and ensure they stay satisfied, create your own sales presentation with these plain slides. This slide covers cryptocurrency user insights and demographics. It includes analysis based on user age groups, gender distribution, income and race to understand factors driving adoption and usage of cryptocurrencies.
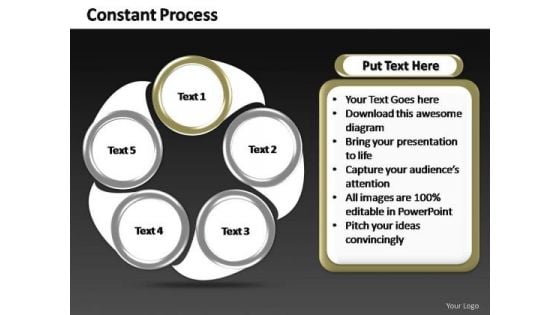
PowerPoint Slide Chart Constant Process Ppt Design
PowerPoint Slide Chart Constant Process PPT Design-PowerPoint Slide Designs Teamwork Round Moving PPT Slide Designs-Explore the various directions and layers existing in your in your plans and processes. Unravel the desired and essential elements of your overall strategy. Explain the relevance of the different layers and stages and directions in getting down to your core competence, ability and desired result.-PowerPoint Slide Chart Constant Process PPT Design Our PowerPoint Slide Chart Constant Process Ppt Design are aces at conflict control. Convert divergence into convergence.
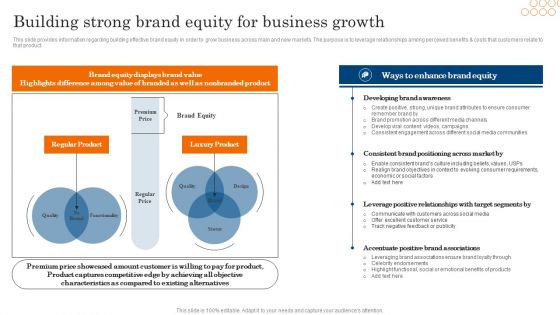
Building Strong Brand Equity For Business Growth Ppt PowerPoint Presentation Diagram PDF
This slide provides information regarding building effective brand equity in order to grow business across main and new markets. The purpose is to leverage relationships among perceived benefits and costs that customers relate to that product. Want to ace your presentation in front of a live audience. Our Building Strong Brand Equity For Business Growth Ppt PowerPoint Presentation Diagram PDF can help you do that by engaging all the users towards you. Slidegeeks experts have put their efforts and expertise into creating these impeccable powerpoint presentations so that you can communicate your ideas clearly. Moreover, all the templates are customizable, and easy to edit and downloadable. Use these for both personal and commercial use.
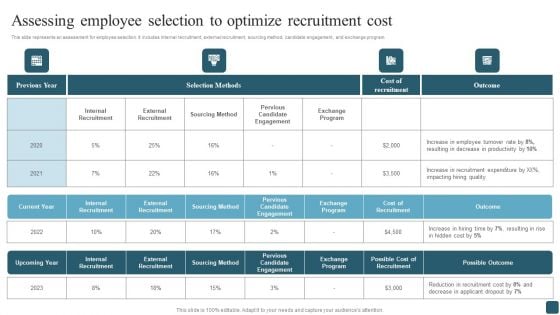
Assessing Employee Selection To Optimize Recruitment Cost Themes PDF
This slide represents an assessment for employee selection. It includes internal recruitment, external recruitment, sourcing method, candidate engagement, and exchange program. Welcome to our selection of the Assessing Employee Selection To Optimize Recruitment Cost Themes PDF. These are designed to help you showcase your creativity and bring your sphere to life. Planning and Innovation are essential for any business that is just starting out. This collection contains the designs that you need for your everyday presentations. All of our PowerPoints are 100 percent editable, so you can customize them to suit your needs. This multi-purpose template can be used in various situations. Grab these presentation templates today
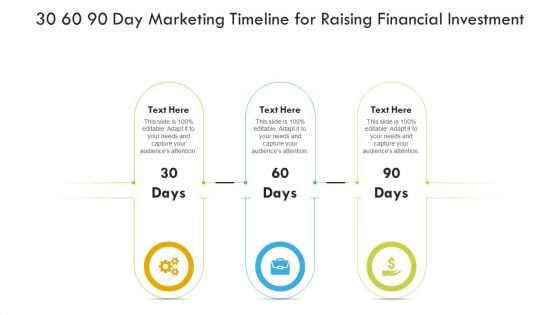
30 60 90 Day Marketing Timeline For Raising Financial Investment Ppt PowerPoint Presentation File Clipart Images PDF
Presenting 30 60 90 day marketing timeline for raising financial investment ppt powerpoint presentation file clipart images pdf to dispense important information. This template comprises three stages. It also presents valuable insights into the topics including 30 60 90 day marketing timeline for raising financial investment. This is a completely customizable PowerPoint theme that can be put to use immediately. So, download it and address the topic impactfully.
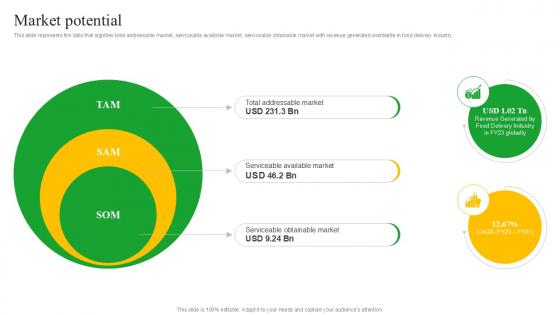
Market Potential Meal Delivery Service Investor Funding Ppt Presentation
This slide represents the data that signifies total addressable market, serviceable available market, serviceable obtainable market with revenue generated worldwide in food delivery industry. If you are looking for a format to display your unique thoughts, then the professionally designed Market Potential Meal Delivery Service Investor Funding PPT Presentation is the one for you. You can use it as a Google Slides template or a PowerPoint template. Incorporate impressive visuals, symbols, images, and other charts. Modify or reorganize the text boxes as you desire. Experiment with shade schemes and font pairings. Alter, share or cooperate with other people on your work. Download Market Potential Meal Delivery Service Investor Funding PPT Presentation and find out how to give a successful presentation. Present a perfect display to your team and make your presentation unforgettable. This slide represents the data that signifies total addressable market, serviceable available market, serviceable obtainable market with revenue generated worldwide in food delivery industry.

Detailed Strategic Account Plan To Decrease Cost Ppt Slide SS
The following slide outlines strategic account plans for three months to boost sales and increase business revenue. It provides information about 30, 60, 90 day plans which helps to achieve organisational goals Whether you have daily or monthly meetings, a brilliant presentation is necessary. Detailed Strategic Account Plan To Decrease Cost Ppt Slide SS can be your best option for delivering a presentation. Represent everything in detail using Detailed Strategic Account Plan To Decrease Cost Ppt Slide SS and make yourself stand out in meetings. The template is versatile and follows a structure that will cater to your requirements. All the templates prepared by Slidegeeks are easy to download and edit. Our research experts have taken care of the corporate themes as well. So, give it a try and see the results. The following slide outlines strategic account plans for three months to boost sales and increase business revenue. It provides information about 30, 60, 90 day plans which helps to achieve organisational goals
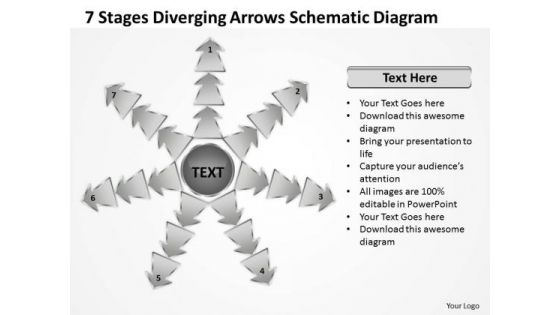
7 Stages Diverging Arrows Schematic Diagram Charts And Networks PowerPoint Slides
We present our 7 stages diverging arrows schematic diagram Charts and Networks PowerPoint Slides.Download and present our Marketing PowerPoint Templates because different personalities, different abilities but formidable together. Download and present our Shapes PowerPoint Templates because you have to coordinate and motivate your team. Download and present our Arrows PowerPoint Templates because our templates illustrates your ability. Download and present our Business PowerPoint Templates because everybody knows The world over it is a priority for many. Along with it there are so many oppurtunities waiting to be utilised. Use our Process and Flows PowerPoint Templates because they pinpoint the core values of your organisation.Use these PowerPoint slides for presentations relating to Arrows, Business, Chart, Cyclic, Data, Diagram, Financial, Goal, Graph, Illustration, Info, Information, Marketing, Model, Option, Part, Pie, Presentation, Process, Result, Sphere, Statistics. The prominent colors used in the PowerPoint template are White, Gray, Black. The feedback we get is that our 7 stages diverging arrows schematic diagram Charts and Networks PowerPoint Slides help you meet deadlines which are an element of today's workplace. Just browse and pick the slides that appeal to your intuitive senses. People tell us our Data PowerPoint templates and PPT Slides are Cheerful. Presenters tell us our 7 stages diverging arrows schematic diagram Charts and Networks PowerPoint Slides look good visually. Use our Data PowerPoint templates and PPT Slides are Wonderful. Use our 7 stages diverging arrows schematic diagram Charts and Networks PowerPoint Slides are Youthful. Use our Diagram PowerPoint templates and PPT Slides are Upbeat. Correct the errant with our 7 Stages Diverging Arrows Schematic Diagram Charts And Networks PowerPoint Slides. They will willingly accept your advice.
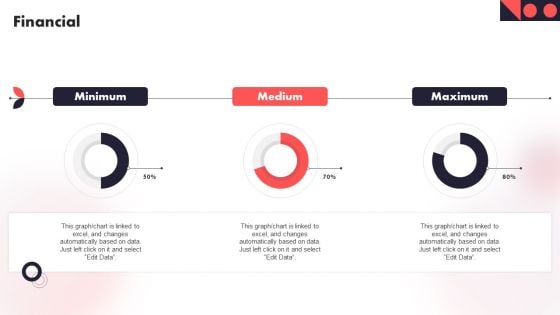
Financial Year Over Year Business Success Playbook Formats PDF
Do you know about Slidesgeeks Financial Year Over Year Business Success Playbook Formats PDF These are perfect for delivering any kind od presentation. Using it, create PowerPoint presentations that communicate your ideas and engage audiences. Save time and effort by using our pre-designed presentation templates that are perfect for a wide range of topic. Our vast selection of designs covers a range of styles, from creative to business, and are all highly customizable and easy to edit. Download as a PowerPoint template or use them as Google Slides themes.
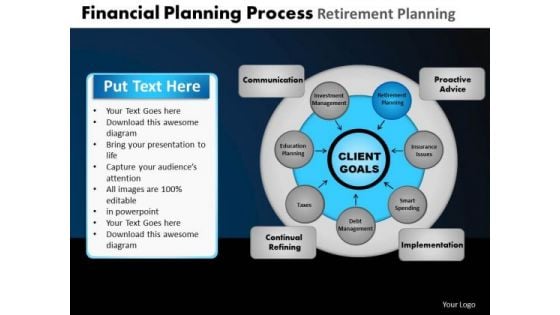
PowerPoint Layouts Success Enterprise Resource Ppt Slide Designs
Extend an invitation with our PowerPoint Layouts Success Enterprise Resource Ppt Slide Designs. Allow the audience into your thoughts.
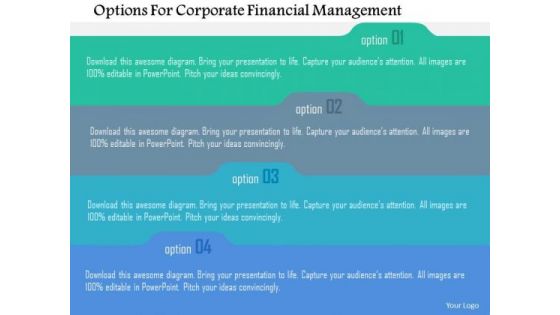
Business Diagram Options For Corporate Financial Management Presentation Template
This diagram contains list of four options. Download this diagram slide to display corporate financial management. This diagram provides an effective way of displaying information you can edit text, color, shade and style as per you need.
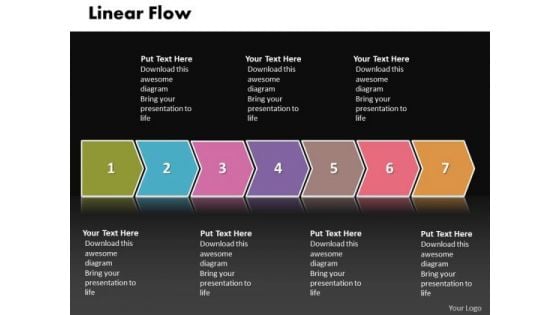
Ppt Linear Flow Process Charts Illustration Stages Of PowerPoint Templates
PPT linear flow process charts illustration stages of PowerPoint Templates-Above diagram will help you visualize and structure information. Present your views using this innovative slide and be assured of leaving a lasting impression.-PPT linear flow process charts illustration stages of PowerPoint Templates-3d, Arrow, Background, Banner, Business, Chart, Colorful, Diagram, Direction, Element, Financial, Flow, Gradient, Illustration, Isolated, Mirrored, Placeholder, Presentation, Process, Steps Put out some feelers on our Ppt Linear Flow Process Charts Illustration Stages Of PowerPoint Templates. They will extract encouraging responses.
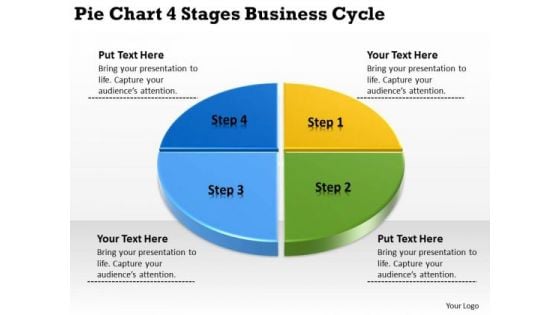
Business PowerPoint Templates Cycle Construction Plan Slides
We present our business powerpoint templates cycle construction plan Slides.Present our Circle Charts PowerPoint Templates because It can Leverage your style with our PowerPoint Templates and Slides. Charm your audience with your ability. Use our Process and Flows PowerPoint Templates because Our PowerPoint Templates and Slides come in all colours, shades and hues. They help highlight every nuance of your views. Use our Business PowerPoint Templates because You can Hit the nail on the head with our PowerPoint Templates and Slides. Embed your ideas in the minds of your audience. Present our Marketing PowerPoint Templates because Our PowerPoint Templates and Slides will let you meet your Deadlines. Download our Shapes PowerPoint Templates because You can Hit a home run with our PowerPoint Templates and Slides. See your ideas sail into the minds of your audience.Use these PowerPoint slides for presentations relating to Abstract, analysis, backgrounds, bank, blue, business, chart, colors, confident, cooperation, credit, currency, data, diagram, economy, entrepreneur, finance, goal,graph, graphic, growing, illustration, image, integration, investment, isolated, market, moving, percentage, pie, plan, projection, report, sales, scale, share, sign,statistics, stats, stock, strength, succeed, success, trend, walking. The prominent colors used in the PowerPoint template are Blue, Blue light, Yellow. Develop an equation with our Business PowerPoint Templates Cycle Construction Plan Slides. You will always arrive at correct answers.
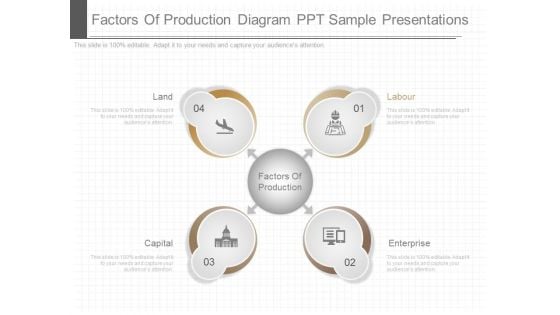
Factors Of Production Diagram Ppt Sample Presentations
This is factors of production diagram ppt sample presentations. This is a four stage process. The stages in this process are land, capital, factors of production, enterprise, labor.
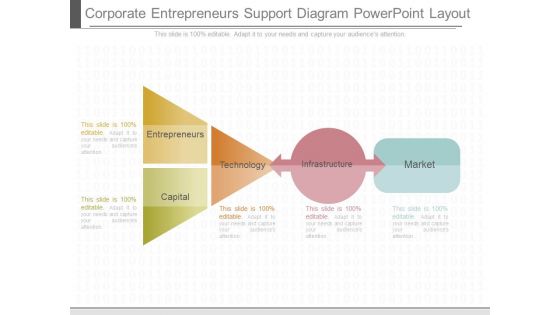
Corporate Entrepreneurs Support Diagram Powerpoint Layout
This is a corporate entrepreneurs support diagram powerpoint layout. This is a four stage process. The stages in this process are entrepreneurs, capital, technology, infrastructure, market.
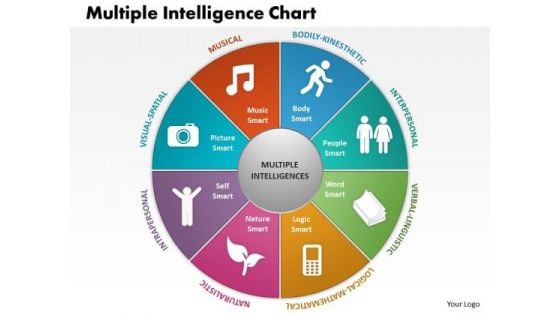
Business Framework Multiple Intelligence Chart PowerPoint Presentation
This business framework power point template has been designed with graphic of multiple intelligence chart. This kind of charts are used for testing and assessment process of any business. Add this template in your presentation and show creative ideas graphically.
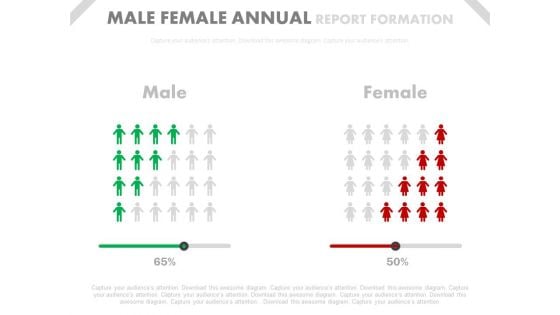
Male Female Ratio Comparison Chart Powerpoint Slides
This PowerPoint template has been designed with graphics of comparison chart. You may download this PPT slide to depict male female ratio comparison chart. Add this slide to your presentation and impress your superiors.
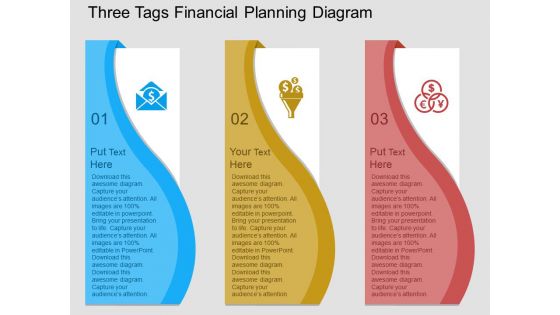
Three Tags Financial Planning Diagram Powerpoint Template
This PowerPoint template has been designed with three infographic banners. This diagram helps to portray concepts of marketing and financial planning. Present your views using this innovative slide and be assured of leaving a lasting impression.
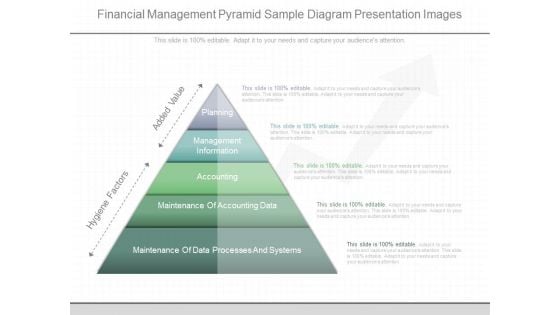
Financial Management Pyramid Sample Diagram Presentation Images
This is a financial management pyramid sample diagram presentation images. This is a five stage process. The stages in this process are planning, management information, accounting, maintenance of accounting data, maintenance of data processes and systems, hygiene factors, added value.
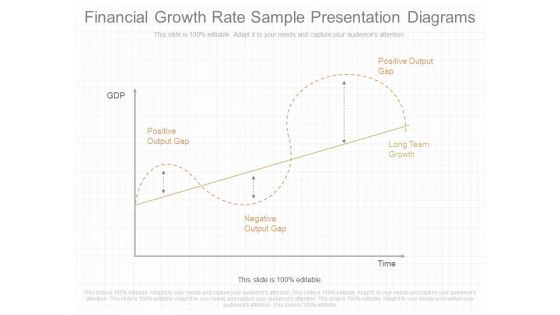
Financial Growth Rate Sample Presentation Diagrams
This is a financial growth rate sample presentation diagrams. This is a four stage process. The stages in this process are positive output gap, negative output gap, positive output gap, long team growth.


 Continue with Email

 Home
Home


