Monthly Marketing Report
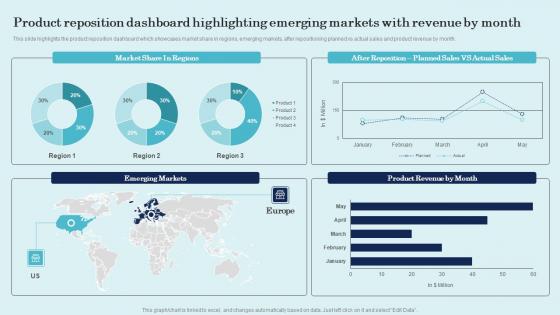
Product Reposition Dashboard Highlighting Emerging Product Repositioning Technique Pictures Pdf
This slide highlights the product reposition dashboard which showcases market share in regions, emerging markets, after repositioning planned vs actual sales and product revenue by month. Welcome to our selection of the Product Reposition Dashboard Highlighting Emerging Product Repositioning Technique Pictures Pdf. These are designed to help you showcase your creativity and bring your sphere to life. Planning and Innovation are essential for any business that is just starting out. This collection contains the designs that you need for your everyday presentations. All of our PowerPoints are 100 percent editable, so you can customize them to suit your needs. This multi-purpose template can be used in various situations. Grab these presentation templates today. This slide highlights the product reposition dashboard which showcases market share in regions, emerging markets, after repositioning planned vs actual sales and product revenue by month.
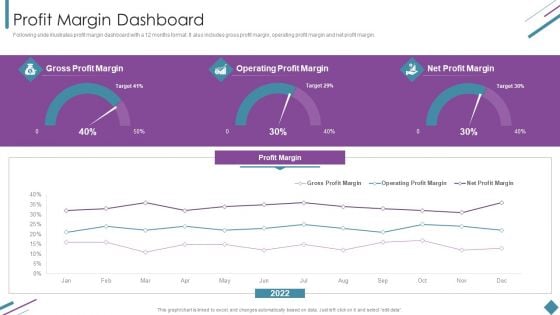
Metrics To Measure Business Performance Profit Margin Dashboard Designs PDF
Following slide illustrates profit margin dashboard with a 12 months format. It also includes gross profit margin, operating profit margin and net profit margin. Deliver and pitch your topic in the best possible manner with this Metrics To Measure Business Performance Profit Margin Dashboard Designs PDF. Use them to share invaluable insights on Gross Profit Margin, Operating Profit Margin, Net Profit Margin and impress your audience. This template can be altered and modified as per your expectations. So, grab it now.
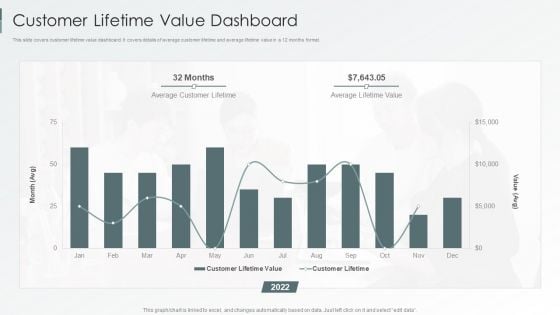
Enterprise Sustainability Performance Metrics Customer Lifetime Value Dashboard Graphics PDF
This slide covers customer lifetime value dashboard. It covers details of average customer lifetime and average lifetime value in a 12 months format.Deliver and pitch your topic in the best possible manner with this Enterprise Sustainability Performance Metrics Customer Lifetime Value Dashboard Graphics PDF. Use them to share invaluable insights on Average Customer, Lifetime Value, Customer Lifetime and impress your audience. This template can be altered and modified as per your expectations. So, grab it now.
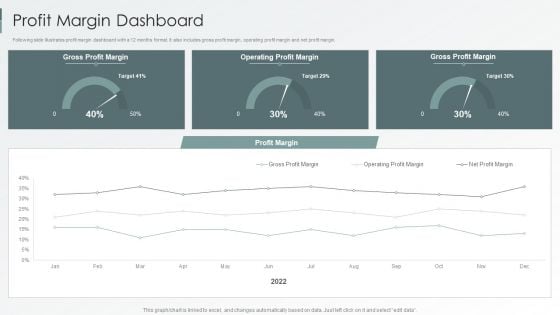
Enterprise Sustainability Performance Metrics Profit Margin Dashboard Brochure PDF
Following slide illustrates profit margin dashboard with a 12 months format. It also includes gross profit margin, operating profit margin and net profit margin.Deliver an awe inspiring pitch with this creative Enterprise Sustainability Performance Metrics Profit Margin Dashboard Brochure PDF bundle. Topics like Gross Profit, Margin Operating, Profit Margin can be discussed with this completely editable template. It is available for immediate download depending on the needs and requirements of the user.
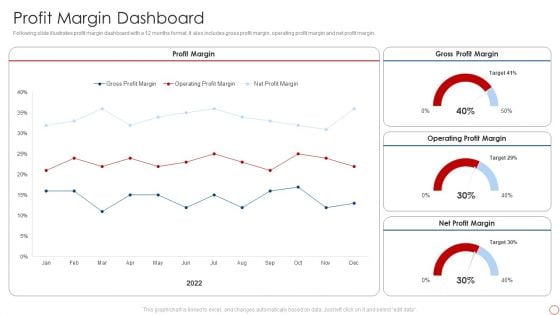
Kpis For Evaluating Business Sustainability Profit Margin Dashboard Pictures PDF
Following slide illustrates profit margin dashboard with a 12 months format. It also includes gross profit margin, operating profit margin and net profit margin. Deliver and pitch your topic in the best possible manner with this Kpis For Evaluating Business Sustainability Profit Margin Dashboard Pictures PDF. Use them to share invaluable insights on Profit Margin, Gross Profit Margin, Operating Profit Margin and impress your audience. This template can be altered and modified as per your expectations. So, grab it now.
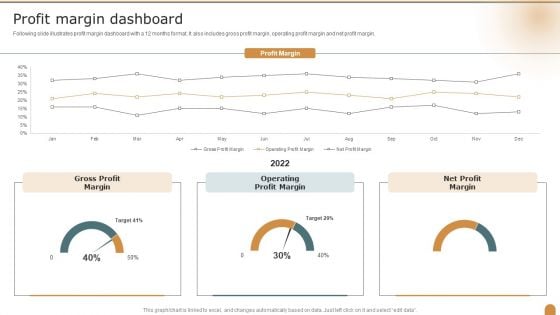
Profit Margin Dashboard Company Performance Evaluation Using KPI Elements PDF
Following slide illustrates profit margin dashboard with a 12 months format. It also includes gross profit margin, operating profit margin and net profit margin. Deliver and pitch your topic in the best possible manner with this Profit Margin Dashboard Company Performance Evaluation Using KPI Elements PDF. Use them to share invaluable insights on Gross Profit Margin, Operating Profit Margin, Net Profit Margin and impress your audience. This template can be altered and modified as per your expectations. So, grab it now.
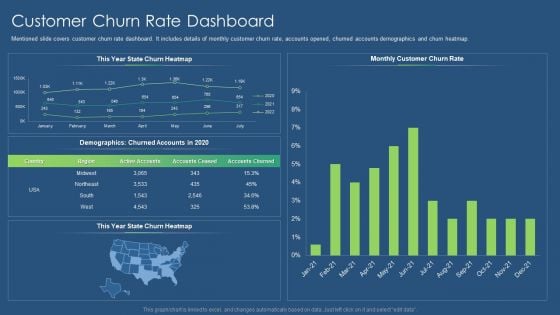
Sustainability Calculation With KPI Customer Churn Rate Dashboard Mockup PDF Mockup PDF
Mentioned slide covers cash flow dashboard. It shows detailed cash flow status in a 12 months format and working capital with accounts receivable and payable details. Deliver and pitch your topic in the best possible manner with this sustainability calculation with kpi cash flow dashboard liquidity ratio inspiration pdf. Use them to share invaluable insights on cash flow dashboard and impress your audience. This template can be altered and modified as per your expectations. So, grab it now.
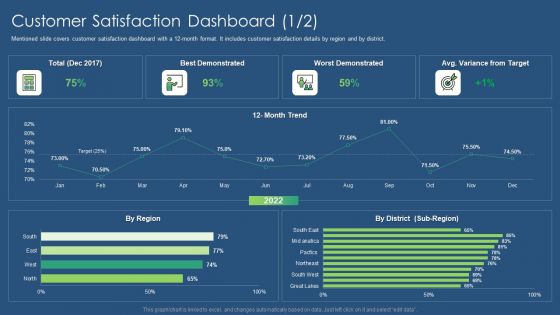
Sustainability Calculation With KPI Customer Satisfaction Dashboard Target Professional PDF Structure PDF
This slide covers customer lifetime value dashboard. It covers details of average customer lifetime and average lifetime value in a 12 months format. Deliver and pitch your topic in the best possible manner with this sustainability calculation with kpi customer lifetime value dashboard formats pdf. Use them to share invaluable insights on customer lifetime value dashboard and impress your audience. This template can be altered and modified as per your expectations. So, grab it now.
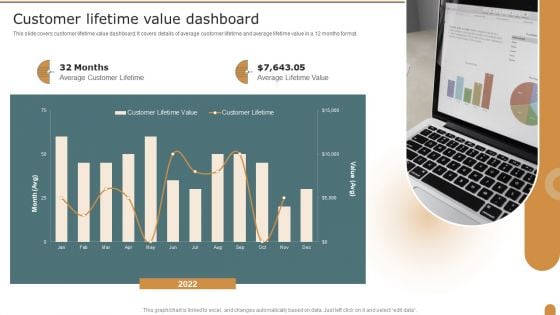
Customer Lifetime Value Dashboard Company Performance Evaluation Using KPI Formats PDF
This slide covers customer lifetime value dashboard. It covers details of average customer lifetime and average lifetime value in a 12 months format. Deliver and pitch your topic in the best possible manner with this Customer Lifetime Value Dashboard Company Performance Evaluation Using KPI Formats PDF. Use them to share invaluable insights on Customer Lifetime, Value Dashboard and impress your audience. This template can be altered and modified as per your expectations. So, grab it now.
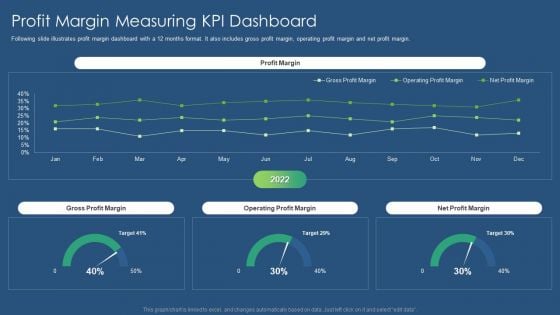
Sustainability Calculation With KPI Profit Margin Measuring Kpi Dashboard Inspiration PDF Topics PDF
Following slide illustrates profit margin dashboard with a 12 months format. It also includes gross profit margin, operating profit margin and net profit margin. Deliver and pitch your topic in the best possible manner with this sustainability calculation with kpi profit margin measuring kpi dashboard inspiration pdf. Use them to share invaluable insights on net profit margin, operating profit margin, gross profit margin and impress your audience. This template can be altered and modified as per your expectations. So, grab it now.
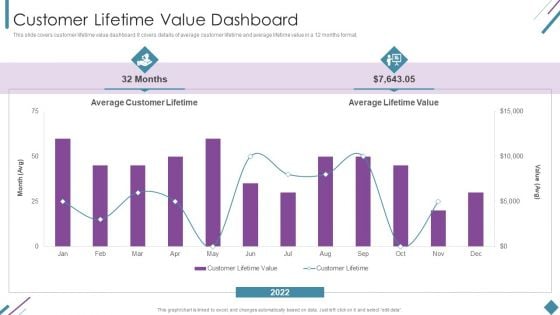
Metrics To Measure Business Performance Customer Lifetime Value Dashboard Slides PDF
This slide covers customer lifetime value dashboard. It covers details of average customer lifetime and average lifetime value in a 12 months format. Deliver and pitch your topic in the best possible manner with this Metrics To Measure Business Performance Customer Lifetime Value Dashboard Slides PDF. Use them to share invaluable insights on Average Customer Lifetime, Average Lifetime Value, 2022 and impress your audience. This template can be altered and modified as per your expectations. So, grab it now.
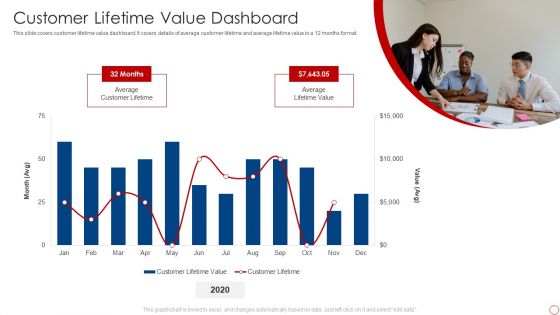
Kpis For Evaluating Business Sustainability Customer Lifetime Value Dashboard Clipart PDF
This slide covers customer lifetime value dashboard. It covers details of average customer lifetime and average lifetime value in a 12 months format. Deliver and pitch your topic in the best possible manner with this Kpis For Evaluating Business Sustainability Customer Lifetime Value Dashboard Clipart PDF. Use them to share invaluable insights on Average Customer Lifetime, Average Lifetime Value and impress your audience. This template can be altered and modified as per your expectations. So, grab it now.

Economic Facts And Insights Analysis Dashboard Ppt PowerPoint Presentation Inspiration Slide Download PDF
Showcasing this set of slides titled economic facts and insights analysis dashboard ppt powerpoint presentation inspiration slide download pdf. The topics addressed in these templates are current working capital, cash conversion cycle in days last, current quick stats, vendor payment error rate last, 12 months currnet budget variance. All the content presented in this PPT design is completely editable. Download it and make adjustments in color, background, font etc. as per your unique business setting.
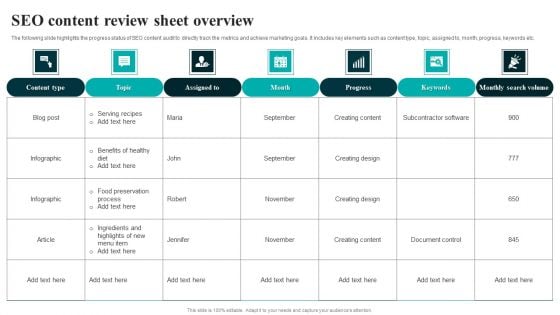
SEO Content Review Sheet Overview Infographics PDF
The following slide highlights the progress status of SEO content audit to directly track the metrics and achieve marketing goals. It includes key elements such as content type, topic, assigned to, month, progress, keywords etc. Pitch your topic with ease and precision using this SEO Content Review Sheet Overview Infographics PDF. This layout presents information on Serving Recipes, Benefits Of Healthy, Food Preservation Process. It is also available for immediate download and adjustment. So, changes can be made in the color, design, graphics or any other component to create a unique layout.
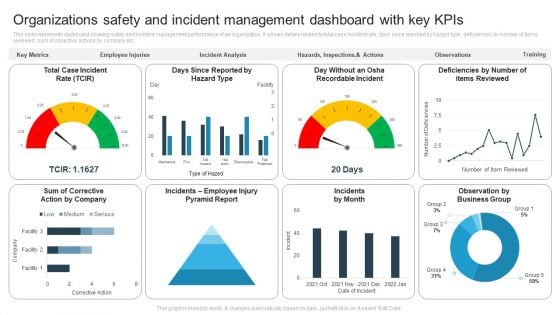
Organizations Safety And Incident Management Dashboard With Key Kpis Themes PDF
This slide represents dashboard showing safety and incident management performance of an organization. It shows details related to total case incident rate, days since reported by hazard type, deficiencies by number of items reviewed, sum of corrective actions by company etc. Showcasing this set of slides titled Organizations Safety And Incident Management Dashboard With Key Kpis Themes PDF. The topics addressed in these templates are Incidents By Month, Observation By Business Group. All the content presented in this PPT design is completely editable. Download it and make adjustments in color, background, font etc. as per your unique business setting.
Strawman Proposal For Enterprise Critical Thinking Potential Prospect Management Dashboard Icons PDF
The dashboard will provide overall scenario of all accounts and track new leads, top campaigns, expected revenue earned, etc. Deliver and pitch your topic in the best possible manner with this strawman proposal for enterprise critical thinking potential prospect management dashboard icons pdf. Use them to share invaluable insights on new leads this month, top campaigns, expected revenue by marketing channel, reasons for unqualified leads, lead status by owner and impress your audience. This template can be altered and modified as per your expectations. So, grab it now.
SFA Dashboard To Track Performance Ppt PowerPoint Presentation Icon Example File PDF
This Slide visually represents sales force automation dashboard to track performance which can be utilized by marketing managers to streamline the process of automated selling. It includes information about sales pipeline, competitors, opportunities, key competitors, etc. Pitch your topic with ease and precision using this sfa dashboard to track performance ppt powerpoint presentation icon example file pdf. This layout presents information on sales pipeline, sales pipeline by sales rep, key competitors, forecast by month, key opportunities. It is also available for immediate download and adjustment. So, changes can be made in the color, design, graphics or any other component to create a unique layout.
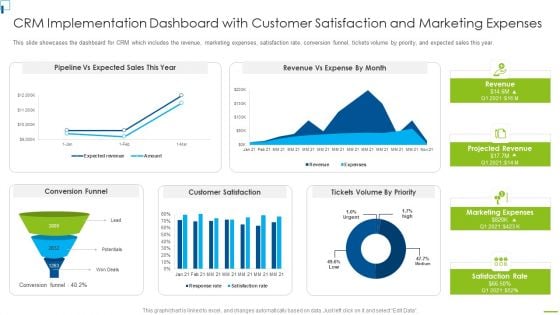
Designing And Deployment CRM Implementation Dashboard With Customer Satisfaction Clipart PDF
This slide showcases the dashboard for CRM which includes the revenue, marketing expenses, satisfaction rate, conversion funnel, tickets volume by priority, and expected sales this year. Deliver an awe inspiring pitch with this creative designing and deployment crm implementation dashboard with customer satisfaction clipart pdf bundle. Topics like pipeline vs expected sales this year, revenue vs expense by month, customer satisfaction, conversion funnel, tickets volume by priority can be discussed with this completely editable template. It is available for immediate download depending on the needs and requirements of the user.

New Product Development Process Optimization Impact Of Product Differentiation Infographics PDF
This slide covers impact of product differentiation strategy on customer experience by completing target and improving customer experience rate in twelve months Deliver an awe inspiring pitch with this creative new product development process optimization impact of product differentiation infographics pdf bundle. Topics like dashboard depicting product usage metrics can be discussed with this completely editable template. It is available for immediate download depending on the needs and requirements of the user.
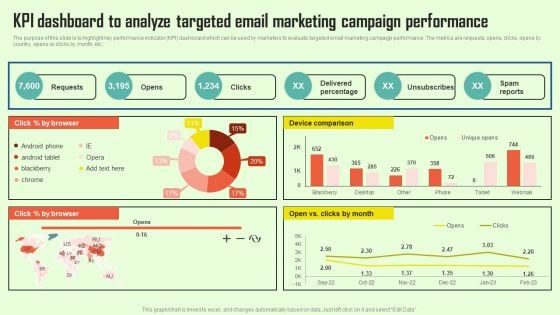
Increasing Consumer Engagement With Database KPI Dashboard To Analyze Targeted Email Infographics PDF
The purpose of this slide is to highlight key performance indicator KPI dashboard which can be used by marketers to evaluate targeted email marketing campaign performance. The metrics are requests, opens, clicks, opens by country, opens vs clicks by month, etc. This modern and well arranged Increasing Consumer Engagement With Database KPI Dashboard To Analyze Targeted Email Infographics PDF provides lots of creative possibilities. It is very simple to customize and edit with the Powerpoint Software. Just drag and drop your pictures into the shapes. All facets of this template can be edited with Powerpoint no extra software is necessary. Add your own material, put your images in the places assigned for them, adjust the colors, and then you can show your slides to the world, with an animated slide included.
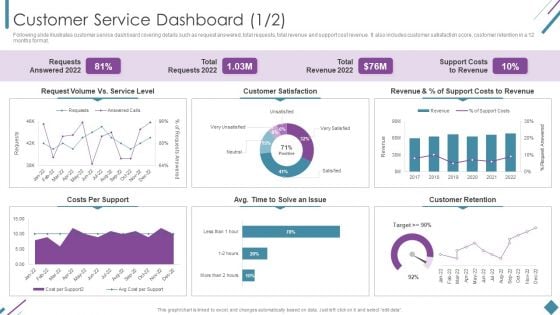
Metrics To Measure Business Performance Customer Service Dashboard Sample PDF
Following slide illustrates customer service dashboard covering details such as request answered, total requests, total revenue and support cost revenue. It also includes customer satisfaction score, customer retention in a 12 months format. Deliver and pitch your topic in the best possible manner with this Metrics To Measure Business Performance Customer Service Dashboard Sample PDF. Use them to share invaluable insights on Requests Answered 2022, Total Requests 2022, Total Revenue 2022 and impress your audience. This template can be altered and modified as per your expectations. So, grab it now.
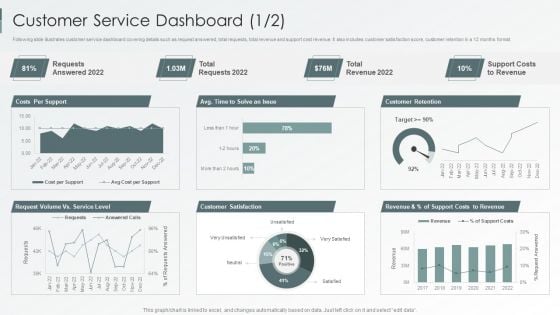
Enterprise Sustainability Performance Metrics Customer Service Dashboard Professional PDF
Following slide illustrates customer service dashboard covering details such as request answered, total requests, total revenue and support cost revenue. It also includes customer satisfaction score, customer retention in a 12 months format.Deliver and pitch your topic in the best possible manner with this Enterprise Sustainability Performance Metrics Customer Service Dashboard Professional PDF. Use them to share invaluable insights on Customer Satisfaction, Customer Retention, Support Revenue and impress your audience. This template can be altered and modified as per your expectations. So, grab it now.
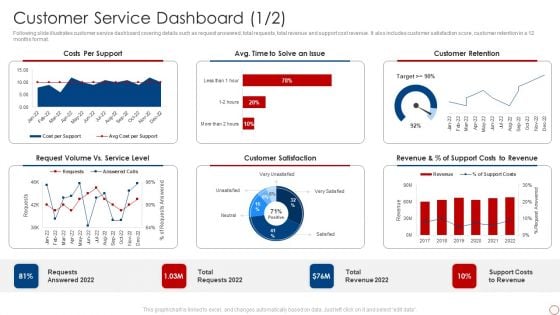
Kpis For Evaluating Business Sustainability Customer Service Dashboard Designs PDF
Following slide illustrates customer service dashboard covering details such as request answered, total requests, total revenue and support cost revenue. It also includes customer satisfaction score, customer retention in a 12 months format. Deliver and pitch your topic in the best possible manner with this Kpis For Evaluating Business Sustainability Customer Service Dashboard Designs PDF. Use them to share invaluable insights on Costs Per Support, Customer Retention, Customer Satisfaction and impress your audience. This template can be altered and modified as per your expectations. So, grab it now.
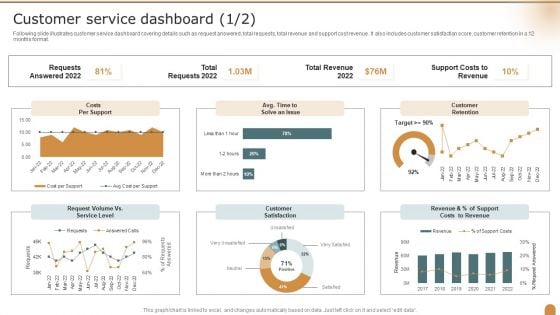
Customer Service Dashboard Company Performance Evaluation Using KPI Themes PDF
Following slide illustrates customer service dashboard covering details such as request answered, total requests, total revenue and support cost revenue. It also includes customer satisfaction score, customer retention in a 12 months format. Deliver and pitch your topic in the best possible manner with this Customer Service Dashboard Company Performance Evaluation Using KPI Themes PDF. Use them to share invaluable insights on Requests Answered, Total Revenue, Customer Retention and impress your audience. This template can be altered and modified as per your expectations. So, grab it now.
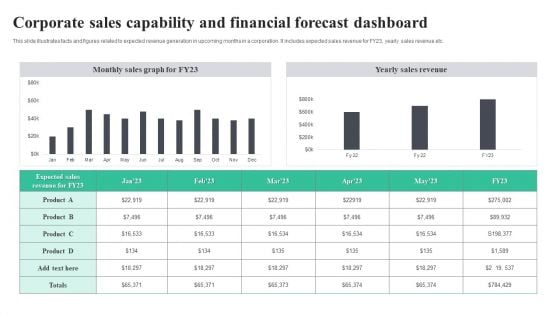
Corporate Sales Capability And Financial Forecast Dashboard Download PDF
This slide illustrates facts and figures related to expected revenue generation in upcoming months in a corporation. It includes expected sales revenue for FY23, yearly sales revenue etc. Showcasing this set of slides titled Corporate Sales Capability And Financial Forecast Dashboard Download PDF. The topics addressed in these templates are Corporate Sales, Capability And Financial, Forecast Dashboard. All the content presented in this PPT design is completely editable. Download it and make adjustments in color, background, font etc. as per your unique business setting
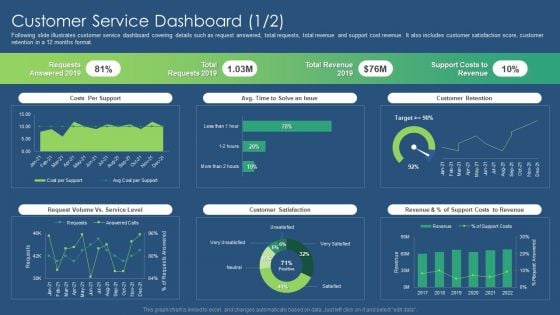
Sustainability Calculation With KPI Customer Service Dashboard Revenue Ideas PDF Graphics PDF
Following slide illustrates customer service dashboard covering details such as request answered, total requests, total revenue and support cost revenue. It also includes customer satisfaction score, customer retention in a 12 months format. Deliver and pitch your topic in the best possible manner with this sustainability calculation with kpi customer service dashboard microsoft pdf. Use them to share invaluable insights on customer satisfaction, revenue, customer retention and impress your audience. This template can be altered and modified as per your expectations. So, grab it now.
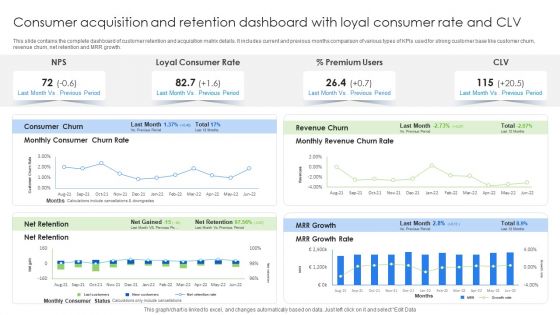
Consumer Acquisition And Retention Dashboard With Loyal Consumer Rate And CLV Brochure PDF
This slide contains the complete dashboard of customer retention and acquisition matrix details. It includes current and previous months comparison of various types of KPIs used for strong customer base like customer churn, revenue churn, net retention and MRR growth. Showcasing this set of slides titled Consumer Acquisition And Retention Dashboard With Loyal Consumer Rate And CLV Brochure PDF. The topics addressed in these templates are Consumer Churn, Revenue Churn, Premium Users. All the content presented in this PPT design is completely editable. Download it and make adjustments in color, background, font etc. as per your unique business setting.
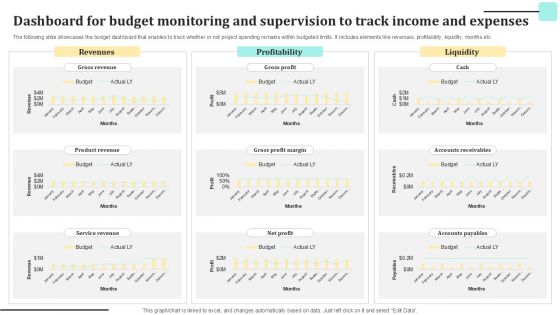
Dashboard For Budget Monitoring And Supervision To Track Income And Expenses Guidelines PDF
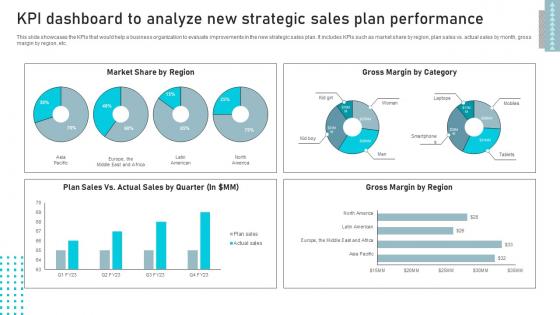
KPI Dashboard To Analyze New Business Sales Enhancement Campaign Portrait Pdf
This slide showcases the KPIs that would help a business organization to evaluate improvements in the new strategic sales plan. It includes KPIs such as market share by region, plan sales vs. actual sales by month, gross margin by region, etc. The best PPT templates are a great way to save time, energy, and resources. Slidegeeks have 100 percent editable powerpoint slides making them incredibly versatile. With these quality presentation templates, you can create a captivating and memorable presentation by combining visually appealing slides and effectively communicating your message. Download KPI Dashboard To Analyze New Business Sales Enhancement Campaign Portrait Pdf from Slidegeeks and deliver a wonderful presentation. This slide showcases the KPIs that would help a business organization to evaluate improvements in the new strategic sales plan. It includes KPIs such as market share by region, plan sales vs. actual sales by month, gross margin by region, etc.
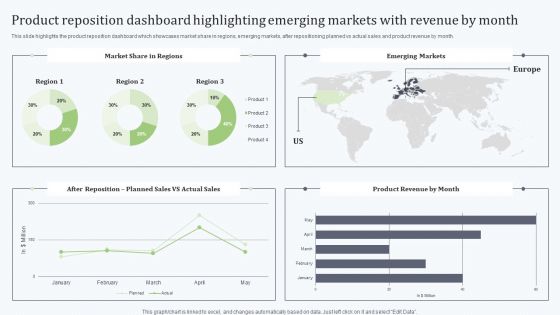
Deploying Revitalization Strategy Enhance Product And Service Sales Product Reposition Dashboard Highlighting Brochure PDF
This slide highlights the product reposition dashboard which showcases market share in regions, emerging markets, after repositioning planned vs actual sales and product revenue by month. Do you have an important presentation coming up Are you looking for something that will make your presentation stand out from the rest Look no further than Deploying Revitalization Strategy Enhance Product And Service Sales Product Reposition Dashboard Highlighting Brochure PDF. With our professional designs, you can trust that your presentation will pop and make delivering it a smooth process. And with Slidegeeks, you can trust that your presentation will be unique and memorable. So why wait Grab Deploying Revitalization Strategy Enhance Product And Service Sales Product Reposition Dashboard Highlighting Brochure PDF today and make your presentation stand out from the rest.
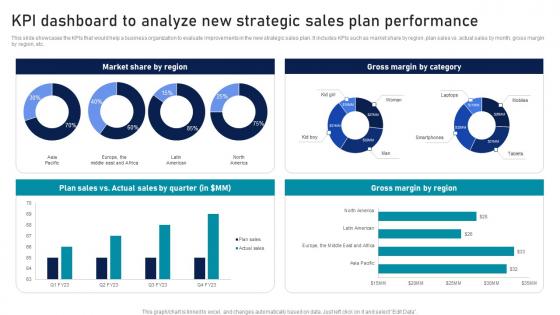
KPI Dashboard To Analyze New Strategic Sales Plan Strategic Sales Plan To Enhance Ideas Pdf
This slide showcases the KPIs that would help a business organization to evaluate improvements in the new strategic sales plan. It includes KPIs such as market share by region, plan sales vs. actual sales by month, gross margin by region, etc. Explore a selection of the finest KPI Dashboard To Analyze New Strategic Sales Plan Strategic Sales Plan To Enhance Ideas Pdf here. With a plethora of professionally designed and pre-made slide templates, you can quickly and easily find the right one for your upcoming presentation. You can use our KPI Dashboard To Analyze New Strategic Sales Plan Strategic Sales Plan To Enhance Ideas Pdf to effectively convey your message to a wider audience. Slidegeeks has done a lot of research before preparing these presentation templates. The content can be personalized and the slides are highly editable. Grab templates today from Slidegeeks. This slide showcases the KPIs that would help a business organization to evaluate improvements in the new strategic sales plan. It includes KPIs such as market share by region, plan sales vs. actual sales by month, gross margin by region, etc.
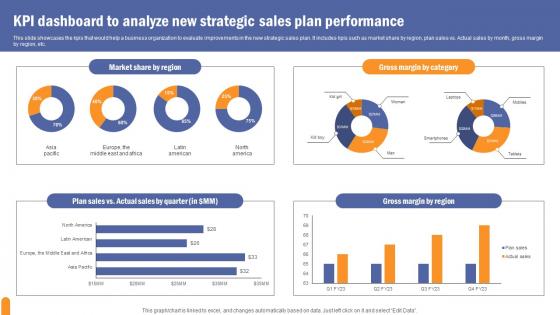
KPI Dashboard To Analyze Developing Extensive Sales And Operations Strategy Slides Pdf
This slide showcases the kpis that would help a business organization to evaluate improvements in the new strategic sales plan. It includes kpis such as market share by region, plan sales vs. Actual sales by month, gross margin by region, etc. Explore a selection of the finest KPI Dashboard To Analyze Developing Extensive Sales And Operations Strategy Slides Pdf here. With a plethora of professionally designed and pre made slide templates, you can quickly and easily find the right one for your upcoming presentation. You can use our KPI Dashboard To Analyze Developing Extensive Sales And Operations Strategy Slides Pdf to effectively convey your message to a wider audience. Slidegeeks has done a lot of research before preparing these presentation templates. The content can be personalized and the slides are highly editable. Grab templates today from Slidegeeks. This slide showcases the kpis that would help a business organization to evaluate improvements in the new strategic sales plan. It includes kpis such as market share by region, plan sales vs. Actual sales by month, gross margin by region, etc.
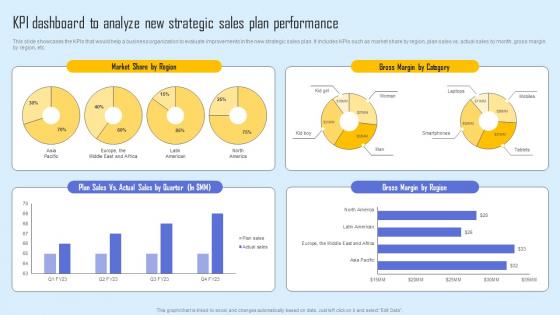
KPI Dashboard Analyze New Effective Sales Strategy To Enhance Customer Retention Background Pdf
This slide showcases the KPIs that would help a business organization to evaluate improvements in the new strategic sales plan. It includes KPIs such as market share by region, plan sales vs. actual sales by month, gross margin by region, etc. Explore a selection of the finest KPI Dashboard Analyze New Effective Sales Strategy To Enhance Customer Retention Background Pdf here. With a plethora of professionally designed and pre made slide templates, you can quickly and easily find the right one for your upcoming presentation. You can use our KPI Dashboard Analyze New Effective Sales Strategy To Enhance Customer Retention Background Pdf to effectively convey your message to a wider audience. Slidegeeks has done a lot of research before preparing these presentation templates. The content can be personalized and the slides are highly editable. Grab templates today from Slidegeeks. This slide showcases the KPIs that would help a business organization to evaluate improvements in the new strategic sales plan. It includes KPIs such as market share by region, plan sales vs. actual sales by month, gross margin by region, etc.
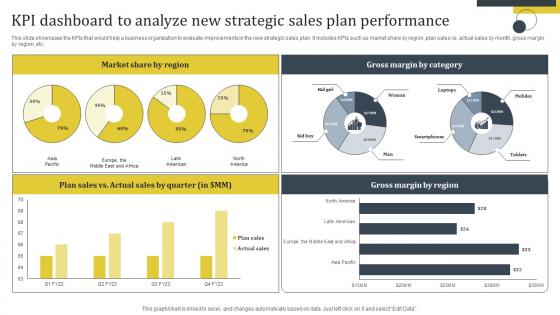
Enhance Customer Retention Kpi Dashboard To Analyze New Strategic Sales Plan Elements Pdf
This slide showcases the KPIs that would help a business organization to evaluate improvements in the new strategic sales plan. It includes KPIs such as market share by region, plan sales vs. actual sales by month, gross margin by region, etc. Welcome to our selection of the Enhance Customer Retention Kpi Dashboard To Analyze New Strategic Sales Plan Elements Pdf. These are designed to help you showcase your creativity and bring your sphere to life. Planning and Innovation are essential for any business that is just starting out. This collection contains the designs that you need for your everyday presentations. All of our PowerPoints are 100 percent editable, so you can customize them to suit your needs. This multi-purpose template can be used in various situations. Grab these presentation templates today. This slide showcases the KPIs that would help a business organization to evaluate improvements in the new strategic sales plan. It includes KPIs such as market share by region, plan sales vs. actual sales by month, gross margin by region, etc.
Storage Logistics Warehouse Management Dashboard Icons PDF
The slide demonstrates information regarding the warehouse management dashboard in order to track key activities. Deliver an awe inspiring pitch with this creative storage logistics warehouse management dashboard icons pdf bundle. Topics like orders, kpls monthly, global financial performances can be discussed with this completely editable template. It is available for immediate download depending on the needs and requirements of the user.
New Hires Data Tracker Dashboard Employee Attraction And Competency Ppt Slide
This slide shows dashboard including date related to new hires for recruitment. It include data related to new hires per month, new hires for various departments and by sources, etc. Coming up with a presentation necessitates that the majority of the effort goes into the content and the message you intend to convey. The visuals of a PowerPoint presentation can only be effective if it supplements and supports the story that is being told. Keeping this in mind our experts created New Hires Data Tracker Dashboard Employee Attraction And Competency Ppt Slide to reduce the time that goes into designing the presentation. This way, you can concentrate on the message while our designers take care of providing you with the right template for the situation. This slide shows dashboard including date related to new hires for recruitment. It include data related to new hires per month, new hires for various departments and by sources, etc.
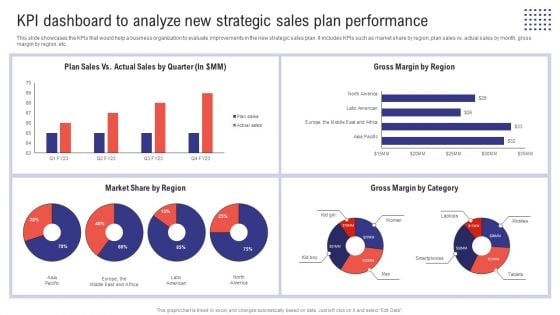
Planning Sales Campaign To Improve KPI Dashboard To Analyze New Strategic Sales Plan Information PDF
This slide showcases the KPIs that would help a business organization to evaluate improvements in the new strategic sales plan. It includes KPIs such as market share by region, plan sales vs. actual sales by month, gross margin by region, etc. Welcome to our selection of the Planning Sales Campaign To Improve KPI Dashboard To Analyze New Strategic Sales Plan Information PDF. These are designed to help you showcase your creativity and bring your sphere to life. Planning and Innovation are essential for any business that is just starting out. This collection contains the designs that you need for your everyday presentations. All of our PowerPoints are 100 percent editable, so you can customize them to suit your needs. This multi-purpose template can be used in various situations. Grab these presentation templates today.
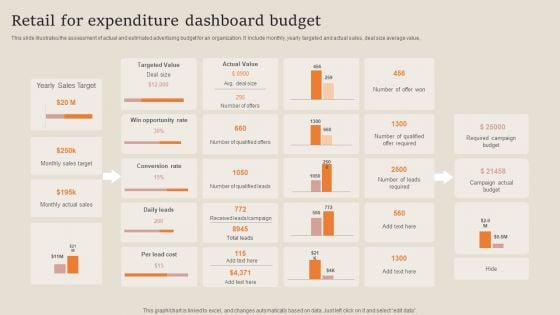
Retail For Expenditure Dashboard Budget Designs PDF
This slide illustrates the assessment of actual and estimated advertising budget for an organization. It include monthly, yearly targeted and actual sales, deal size average value, Showcasing this set of slides titled Retail For Expenditure Dashboard Budget Designs PDF. The topics addressed in these templates are Sales Target, Opportunity Rate, Required Campaign Budget. All the content presented in this PPT design is completely editable. Download it and make adjustments in color, background, font etc. as per your unique business setting.
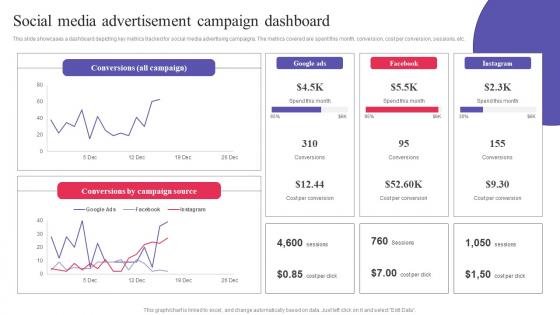
Social Media Advertisement Campaign Dashboard Digital Promotional Campaign Slides Pdf
This slide showcases a dashboard depicting key metrics tracked for social media advertising campaigns. The metrics covered are spent this month, conversion, cost per conversion, sessions, etc. Boost your pitch with our creative Social Media Advertisement Campaign Dashboard Digital Promotional Campaign Slides Pdf. Deliver an awe-inspiring pitch that will mesmerize everyone. Using these presentation templates you will surely catch everyones attention. You can browse the ppts collection on our website. We have researchers who are experts at creating the right content for the templates. So you do not have to invest time in any additional work. Just grab the template now and use them. This slide showcases a dashboard depicting key metrics tracked for social media advertising campaigns. The metrics covered are spent this month, conversion, cost per conversion, sessions, etc.
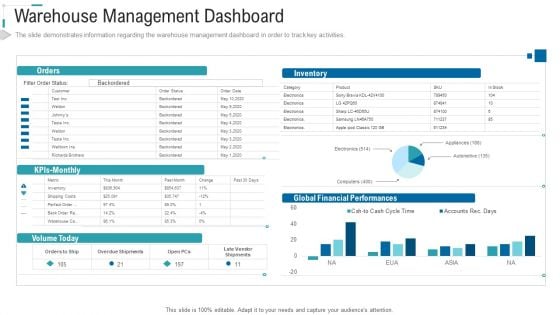
Inventory Stock Control Warehouse Management Dashboard Ppt Styles Images PDF
The slide demonstrates information regarding the warehouse management dashboard in order to track key activities. Deliver and pitch your topic in the best possible manner with this inventory stock control warehouse management dashboard ppt styles images pdf. Use them to share invaluable insights on kpls monthly, orders, inventory, global financial performances, volume today and impress your audience. This template can be altered and modified as per your expectations. So, grab it now.
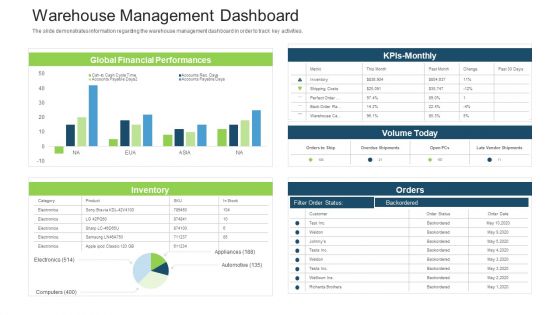
Stock Control System Warehouse Management Dashboard Ppt Visual Aids Outline PDF
The slide demonstrates information regarding the warehouse management dashboard in order to track key activities. Deliver and pitch your topic in the best possible manner with this stock control system warehouse management dashboard ppt visual aids outline pdf. Use them to share invaluable insights on kpls monthly, orders, inventory, global financial performances, volume today and impress your audience. This template can be altered and modified as per your expectations. So, grab it now.
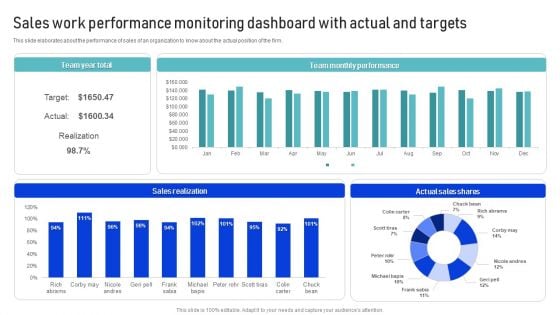
Sales Work Performance Monitoring Dashboard With Actual And Targets Introduction PDF
This slide elaborates about the performance of sales of an organization to know about the actual position of the firm. Showcasing this set of slides titled Sales Work Performance Monitoring Dashboard With Actual And Targets Introduction PDF. The topics addressed in these templates are Sales Realization, Team Monthly, Performance. All the content presented in this PPT design is completely editable. Download it and make adjustments in color, background, font etc. as per your unique business setting.
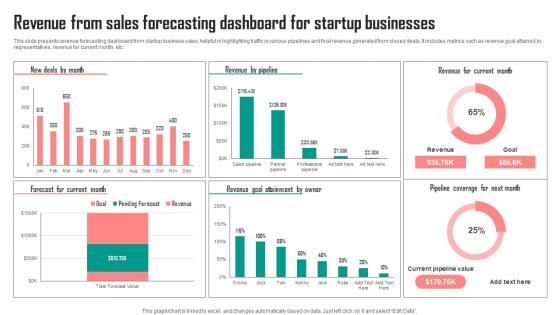
Revenue From Sales Forecasting Dashboard For Startup Businesses Graphics Pdf
This slide presents revenue forecasting dashboard from startup business sales, helpful in highlighting traffic in various pipelines and final revenue generated from closed deals. It includes metrics such as revenue goal attained by representatives, revenue for current month, etc. Showcasing this set of slides titled Revenue From Sales Forecasting Dashboard For Startup Businesses Graphics Pdf. The topics addressed in these templates are Owner, Current Month, Businesses. All the content presented in this PPT design is completely editable. Download it and make adjustments in color, background, font etc. as per your unique business setting. This slide presents revenue forecasting dashboard from startup business sales, helpful in highlighting traffic in various pipelines and final revenue generated from closed deals. It includes metrics such as revenue goal attained by representatives, revenue for current month, etc.
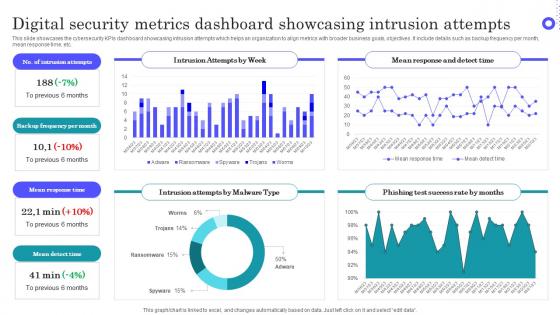
Digital Security Metrics Dashboard Showcasing Intrusion Attempts Topics Pdf
Pitch your topic with ease and precision using this Digital Security Metrics Dashboard Showcasing Intrusion Attempts Topics Pdf This layout presents information on Intrusion Attempts, Frequency Per Month, Mean Response Time It is also available for immediate download and adjustment. So, changes can be made in the color, design, graphics or any other component to create a unique layout. This slide showcases the cybersecurity KPIs dashboard showcasing intrusion attempts which helps an organization to align metrics with broader business goals, objectives. It include details such as backup frequency per month, mean response time, etc.
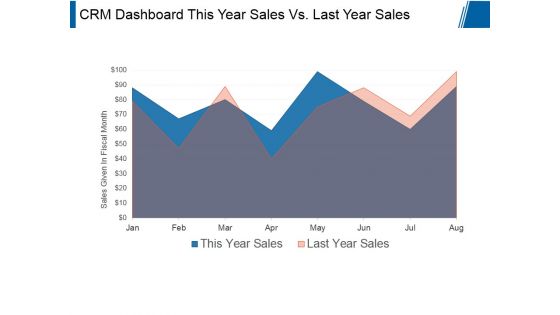
Crm Dashboard This Year Sales Vs Last Year Sales Ppt PowerPoint Presentation Styles
This is a crm dashboard this year sales vs last year sales ppt powerpoint presentation styles. This is a two stage process. The stages in this process are sales given in fiscal month, business, marketing, presentation, growth.
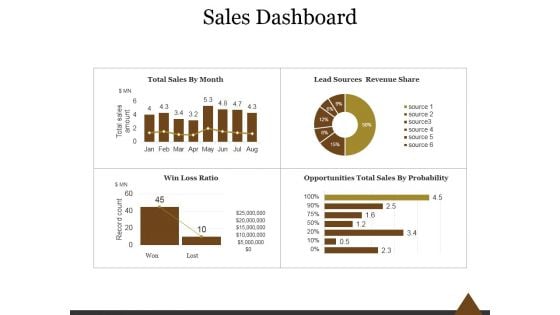
Sales Dashboard Template 2 Ppt PowerPoint Presentation Introduction
This is a sales dashboard template 2 ppt powerpoint presentation introduction. This is a four stage process. The stages in this process are total sales by month, lead sources revenue share, win loss ratio, opportunities total sales by probability.
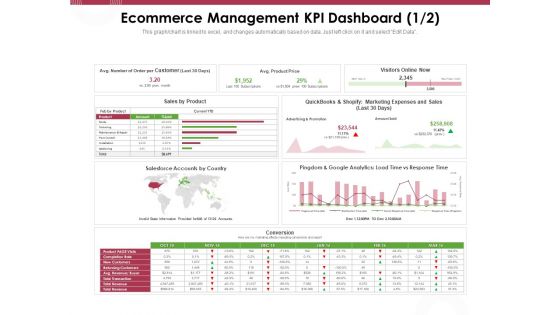
Online Product Planning Ecommerce Management KPI Dashboard Ppt Layouts Background Image PDF
Presenting this set of slides with name online product planning ecommerce management kpi dashboard ppt layouts background image pdf. The topics discussed in these slides are total volume sold this month, average purchase value, growth in average purchase value, growth in volume sold this month, growth in sales this month, total sales this month. This is a completely editable PowerPoint presentation and is available for immediate download. Download now and impress your audience.
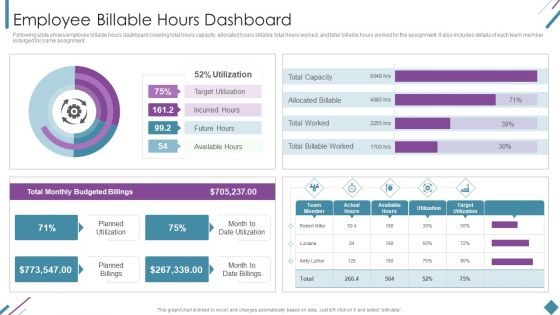
Metrics To Measure Business Performance Employee Billable Hours Dashboard Diagrams PDF
Following slide shows employee billable hours dashboard covering total hours capacity, allocated hours billable, total hours worked, and total billable hours worked for the assignment. It also includes details of each team member indulged for same assignment. Deliver an awe inspiring pitch with this creative Metrics To Measure Business Performance Employee Billable Hours Dashboard Diagrams PDF bundle. Topics like Total Monthly, Budgeted Billings, Planned Utilization can be discussed with this completely editable template. It is available for immediate download depending on the needs and requirements of the user.
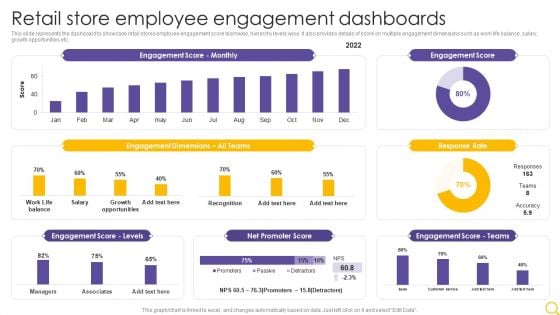
Retail Outlet Operational Efficiency Analytics Retail Store Employee Engagement Dashboards Sample PDF
This slide represents the dashboard to showcase retail stores employee engagement score teamwise, hierarchy levels wise. It also provides details of score on multiple engagement dimensions such as work life balance, salary, growth opportunities etc. Deliver an awe inspiring pitch with this creative Retail Outlet Operational Efficiency Analytics Retail Store Employee Engagement Dashboards Sample PDF bundle. Topics like Engagement Score Monthly, Engagement Dimensions, Engagement Score Levels can be discussed with this completely editable template. It is available for immediate download depending on the needs and requirements of the user.
New Hires Data Tracker Dashboard Workforce Procurement And Aptitude Evaluation Ppt Presentation
This slide shows dashboard including date related to new hires for recruitment. It include data related to new hires per month, new hires for various departments and by sources, etc. Are you searching for a New Hires Data Tracker Dashboard Workforce Procurement And Aptitude Evaluation Ppt Presentation that is uncluttered, straightforward, and original Its easy to edit, and you can change the colors to suit your personal or business branding. For a presentation that expresses how much effort you have put in, this template is ideal With all of its features, including tables, diagrams, statistics, and lists, its perfect for a business plan presentation. Make your ideas more appealing with these professional slides. Download New Hires Data Tracker Dashboard Workforce Procurement And Aptitude Evaluation Ppt Presentation from Slidegeeks today. This slide shows dashboard including date related to new hires for recruitment. It include data related to new hires per month, new hires for various departments and by sources, etc.
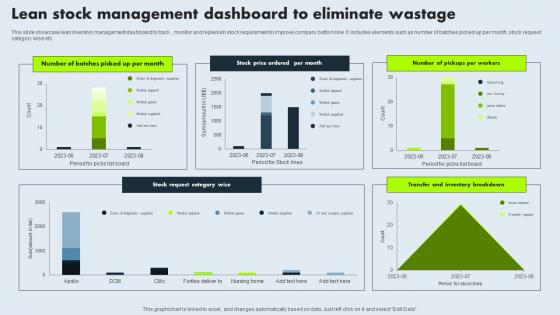
Lean Stock Management Dashboard To Eliminate Wastage Mockup Pdf
This slide showcase lean inventory management dashboard to track , monitor and replenish stock requirement to improve company bottom line. It includes elements such as number of batches picked up per month, stock request category wise etc. Pitch your topic with ease and precision using this Lean Stock Management Dashboard To Eliminate Wastage Mockup Pdf. This layout presents information on Lean Stock, Management Dashboard, Eliminate Wastage, Stock Request Category. It is also available for immediate download and adjustment. So, changes can be made in the color, design, graphics or any other component to create a unique layout. This slide showcase lean inventory management dashboard to track , monitor and replenish stock requirement to improve company bottom line. It includes elements such as number of batches picked up per month, stock request category wise etc.
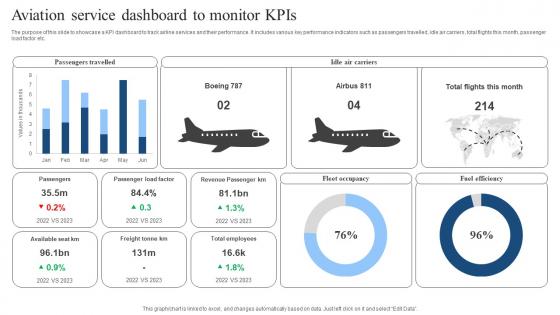
Aviation Service Dashboard To Monitor KPIs Download Pdf
The purpose of this slide to showcase a KPI dashboard to track airline services and their performance. It includes various key performance indicators such as passengers travelled, idle air carriers, total flights this month, passenger load factor etc. Pitch your topic with ease and precision using this Aviation Service Dashboard To Monitor KPIs Download Pdf. This layout presents information on Fleet Occupancy, Fuel Efficiency, Passengers Travelled. It is also available for immediate download and adjustment. So, changes can be made in the color, design, graphics or any other component to create a unique layout. The purpose of this slide to showcase a KPI dashboard to track airline services and their performance. It includes various key performance indicators such as passengers travelled, idle air carriers, total flights this month, passenger load factor etc.
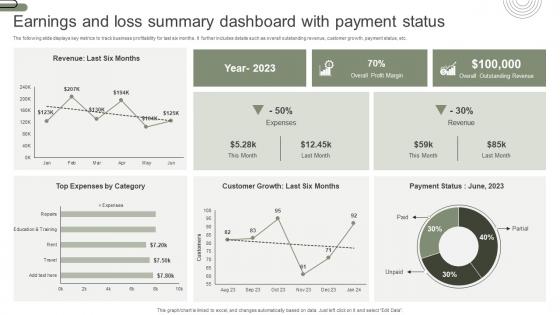
Earnings And Loss Summary Dashboard With Payment Status Elements Pdf
The following slide displays key metrics to track business profitability for last six months. It further includes details such as overall outstanding revenue, customer growth, payment status, etc. Pitch your topic with ease and precision using this Earnings And Loss Summary Dashboard With Payment Status Elements Pdf. This layout presents information on Earnings And Loss, Summary Dashboard, Payment Status. It is also available for immediate download and adjustment. So, changes can be made in the color, design, graphics or any other component to create a unique layout. The following slide displays key metrics to track business profitability for last six months. It further includes details such as overall outstanding revenue, customer growth, payment status, etc.
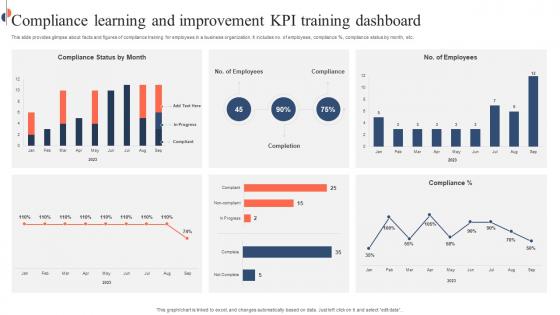
Compliance Learning And Improvement KPI Training Dashboard Sample Pdf
This slide provides glimpse about facts and figures of compliance training for employees in a business organization. It includes no. of employees, compliance percent, compliance status by month, etc. Pitch your topic with ease and precision using this Compliance Learning And Improvement KPI Training Dashboard Sample Pdf. This layout presents information on Compliance Learning, Improvement KPI, Training Dashboard, Compliance Training. It is also available for immediate download and adjustment. So, changes can be made in the color, design, graphics or any other component to create a unique layout. This slide provides glimpse about facts and figures of compliance training for employees in a business organization. It includes no. of employees, compliance percent, compliance status by month, etc.
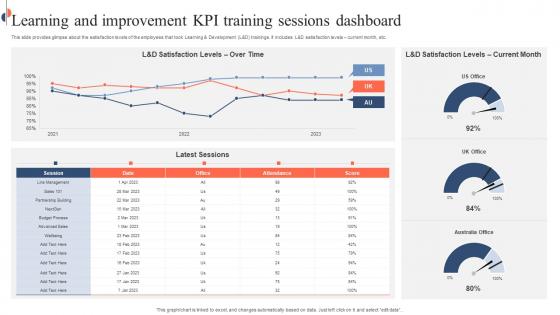
Learning And Improvement KPI Training Sessions Dashboard Mockup Pdf
This slide provides glimpse about the satisfaction levels of the employees that took Learning and Development L and D trainings. It includes L and D satisfaction levels current month, etc. Showcasing this set of slides titled Learning And Improvement KPI Training Sessions Dashboard Mockup Pdf. The topics addressed in these templates are Learning And Improvement KPI, Training Sessions Dashboard, Learning And Development. All the content presented in this PPT design is completely editable. Download it and make adjustments in color, background, font etc. as per your unique business setting. This slide provides glimpse about the satisfaction levels of the employees that took Learning and Development L and D trainings. It includes L and D satisfaction levels current month, etc.
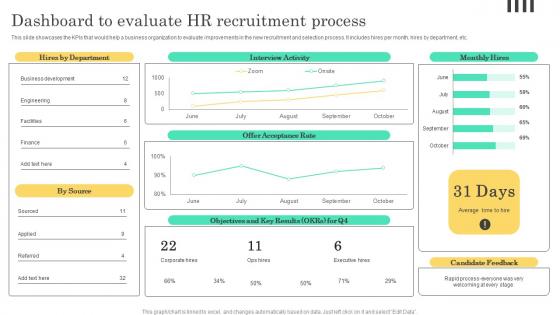
Dashboard To Evaluate HR Recruitment Implementable Hiring And Selection Themes Pdf
This slide showcases the KPIs that would help a business organization to evaluate improvements in the new recruitment and selection process. It includes hires per month, hires by department, etc. Get a simple yet stunning designed Dashboard To Evaluate HR Recruitment Implementable Hiring And Selection Themes Pdf. It is the best one to establish the tone in your meetings. It is an excellent way to make your presentations highly effective. So, download this PPT today from Slidegeeks and see the positive impacts. Our easy to edit Dashboard To Evaluate HR Recruitment Implementable Hiring And Selection Themes Pdf can be your go to option for all upcoming conferences and meetings. So, what are you waiting for Grab this template today. This slide showcases the KPIs that would help a business organization to evaluate improvements in the new recruitment and selection process. It includes hires per month, hires by department, etc.
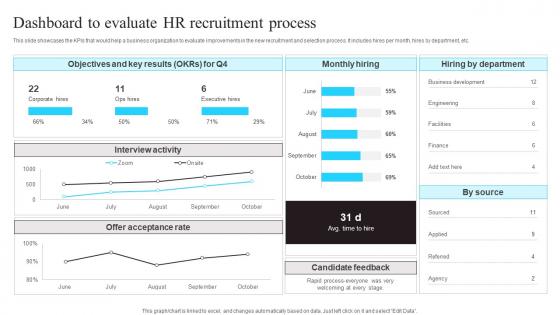
Dashboard To Evaluate HR Recruitment Process Enhancing Workforce Productivity Using Brochure Pdf
This slide showcases the KPIs that would help a business organization to evaluate improvements in the new recruitment and selection process. It includes hires per month,hires by department,etc.Do you have to make sure that everyone on your team knows about any specific topic I yes,then you should give Dashboard To Evaluate HR Recruitment Process Enhancing Workforce Productivity Using Brochure Pdf a try. Our experts have put a lot of knowledge and effort into creating this impeccable Dashboard To Evaluate HR Recruitment Process Enhancing Workforce Productivity Using Brochure Pdf You can use this template for your upcoming presentations,as the slides are perfect to represent even the tiniest detail. You can download these templates from the Slidegeeks website and these are easy to edit. So grab these today. This slide showcases the KPIs that would help a business organization to evaluate improvements in the new recruitment and selection process. It includes hires per month, hires by department, etc.
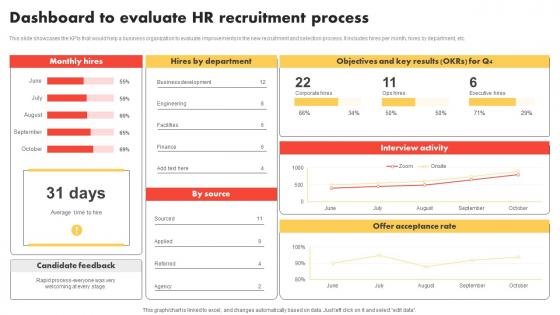
Dashboard To Evaluate HR Modern And Advanced HR Recruitment Template Pdf
This slide showcases the KPIs that would help a business organization to evaluate improvements in the new recruitment and selection process. It includes hires per month, hires by department, etc. Get a simple yet stunning designed Dashboard To Evaluate HR Modern And Advanced HR Recruitment Template Pdf. It is the best one to establish the tone in your meetings. It is an excellent way to make your presentations highly effective. So, download this PPT today from Slidegeeks and see the positive impacts. Our easy to edit Dashboard To Evaluate HR Modern And Advanced HR Recruitment Template Pdf can be your go to option for all upcoming conferences and meetings. So, what are you waiting for Grab this template today. This slide showcases the KPIs that would help a business organization to evaluate improvements in the new recruitment and selection process. It includes hires per month, hires by department, etc.
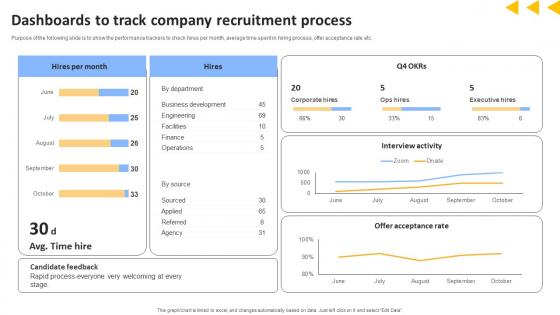
Workforce Productivity Improvement Dashboards To Track Company Recruitment Process Themes Pdf
Purpose of the following slide is to show the performance trackers to check hires per month, average time spent in hiring process, offer acceptance rate etc. Formulating a presentation can take up a lot of effort and time, so the content and message should always be the primary focus. The visuals of the PowerPoint can enhance the presenters message, so our Workforce Productivity Improvement Dashboards To Track Company Recruitment Process Themes Pdf was created to help save time. Instead of worrying about the design, the presenter can concentrate on the message while our designers work on creating the ideal templates for whatever situation is needed. Slidegeeks has experts for everything from amazing designs to valuable content, we have put everything into Workforce Productivity Improvement Dashboards To Track Company Recruitment Process Themes Pdf Purpose of the following slide is to show the performance trackers to check hires per month, average time spent in hiring process, offer acceptance rate etc.
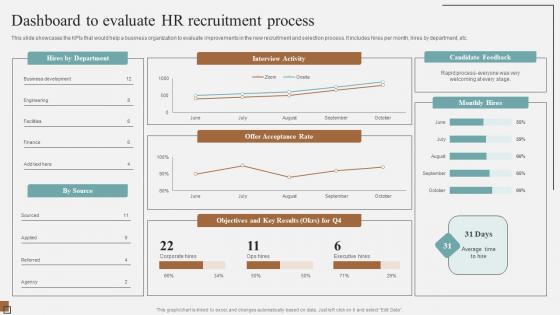
Dashboard To Evaluate HR Recruitment Process Complete Guidelines For Streamlined Sample Pdf
This slide showcases the KPIs that would help a business organization to evaluate improvements in the new recruitment and selection process. It includes hires per month, hires by department, etc.From laying roadmaps to briefing everything in detail, our templates are perfect for you. You can set the stage with your presentation slides. All you have to do is download these easy-to-edit and customizable templates. Dashboard To Evaluate HR Recruitment Process Complete Guidelines For Streamlined Sample Pdf will help you deliver an outstanding performance that everyone would remember and praise you for. Do download this presentation today. This slide showcases the KPIs that would help a business organization to evaluate improvements in the new recruitment and selection process. It includes hires per month, hires by department, etc.


 Continue with Email

 Home
Home


