Monthly Project Plan
Data Analytics IT Timeline For Data Science Implementation In The Organization Ppt Portfolio Icons PDF
This slide represents the timeline for the data science projects and a list of tasks performed each month, from training to work on projects. This is a data analytics it timeline for data science implementation in the organization ppt portfolio icons pdf template with various stages. Focus and dispense information on four stages using this creative set, that comes with editable features. It contains large content boxes to add your information on topics like exploratory analysis, final analysis, data cleaning, conditioning and transformation, data gathering from different resources. You can also showcase facts, figures, and other relevant content using this PPT layout. Grab it now.
Data Mining Implementation Timeline For Data Mining Implementation In The Organization Icons PDF
This slide represents the timeline for the data science projects and a list of tasks performed each month, from training to work on projects.This is a data mining implementation timeline for data mining implementation in the organization icons pdf template with various stages. Focus and dispense information on six stages using this creative set, that comes with editable features. It contains large content boxes to add your information on topics like conditioning and transformation, exploratory analysis, final analysis You can also showcase facts, figures, and other relevant content using this PPT layout. Grab it now.
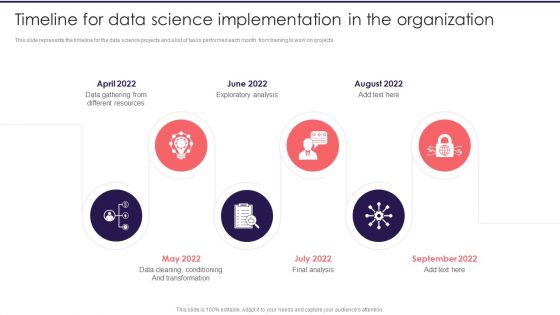
Information Studies Timeline For Data Science Implementation In The Organization Infographics PDF
This slide represents the timeline for the data science projects and a list of tasks performed each month, from training to work on projects. Presenting Information Studies Timeline For Data Science Implementation In The Organization Infographics PDF to provide visual cues and insights. Share and navigate important information on six stages that need your due attention. This template can be used to pitch topics like Different Resources, Exploratory Analysis, Final Analysis. In addtion, this PPT design contains high resolution images, graphics, etc, that are easily editable and available for immediate download.
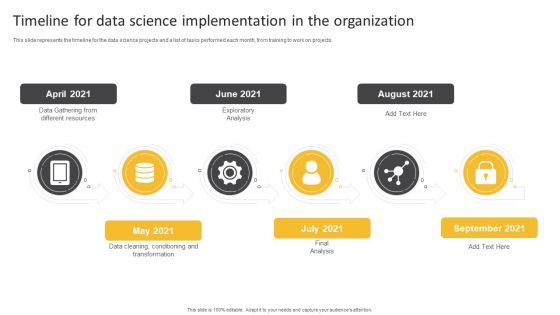
Information Science Timeline For Data Science Implementation In The Organization Ppt PowerPoint Presentation Infographic Template Slideshow PDF
This slide represents the timeline for the data science projects and a list of tasks performed each month, from training to work on projects.This is a Information Science Timeline For Data Science Implementation In The Organization Ppt PowerPoint Presentation Infographic Template Slideshow PDF template with various stages. Focus and dispense information on six stages using this creative set, that comes with editable features. It contains large content boxes to add your information on topics like Data Gathering, Exploratory Analysis, Final Analysis. You can also showcase facts, figures, and other relevant content using this PPT layout. Grab it now.
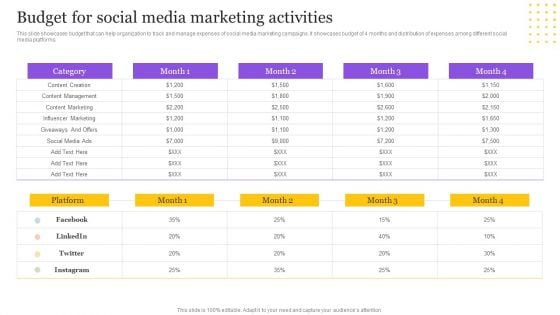
Digital Marketing Strategy Budget For Social Media Marketing Activities Pictures PDF
This slide showcases budget that can help organization to track and manage expenses of social media marketing campaigns. It showcases budget of 4 months and distribution of expenses among different social media platforms. Slidegeeks has constructed Digital Marketing Strategy Budget For Social Media Marketing Activities Pictures PDF after conducting extensive research and examination. These presentation templates are constantly being generated and modified based on user preferences and critiques from editors. Here, you will find the most attractive templates for a range of purposes while taking into account ratings and remarks from users regarding the content. This is an excellent jumping-off point to explore our content and will give new users an insight into our top-notch PowerPoint Templates.
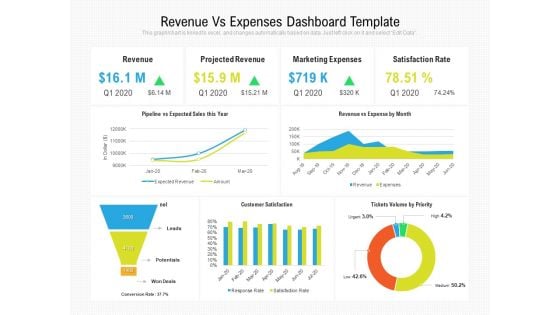
Revenue Vs Expenses Dashboard Template Ppt PowerPoint Presentation Slides Tips PDF
Presenting this set of slides with name revenue vs expenses dashboard template ppt powerpoint presentation slides tips pdf. The topics discussed in these slides are revenue, projected revenue, marketing expenses, satisfaction rate, pipeline vs expected sales this year, revenue vs expense by month, customer satisfaction, tickets volume by priority. This is a completely editable PowerPoint presentation and is available for immediate download. Download now and impress your audience.
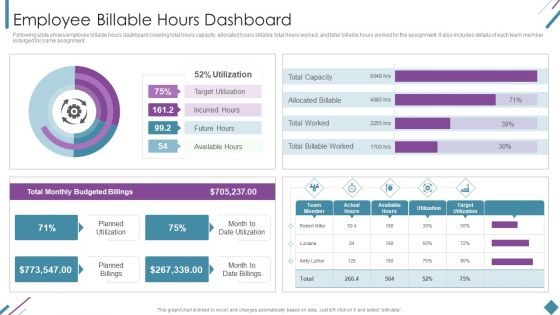
Metrics To Measure Business Performance Employee Billable Hours Dashboard Diagrams PDF
Following slide shows employee billable hours dashboard covering total hours capacity, allocated hours billable, total hours worked, and total billable hours worked for the assignment. It also includes details of each team member indulged for same assignment. Deliver an awe inspiring pitch with this creative Metrics To Measure Business Performance Employee Billable Hours Dashboard Diagrams PDF bundle. Topics like Total Monthly, Budgeted Billings, Planned Utilization can be discussed with this completely editable template. It is available for immediate download depending on the needs and requirements of the user.

Customizing The Salon Experience Examining Impact Of Clients Frequency Of Visit On Business Strategy SS V
This slide analyzes the relationship between frequency of client visits and business revenue. It includes two tables showcasing current projections and what if analysis covering metrics such as average weekly service sales, average number of visits per year, number of new clients per month, etc. This Customizing The Salon Experience Examining Impact Of Clients Frequency Of Visit On Business Strategy SS V is perfect for any presentation, be it in front of clients or colleagues. It is a versatile and stylish solution for organizing your meetings. The Customizing The Salon Experience Examining Impact Of Clients Frequency Of Visit On Business Strategy SS V features a modern design for your presentation meetings. The adjustable and customizable slides provide unlimited possibilities for acing up your presentation. Slidegeeks has done all the homework before launching the product for you. So, do not wait, grab the presentation templates today This slide analyzes the relationship between frequency of client visits and business revenue. It includes two tables showcasing current projections and what if analysis covering metrics such as average weekly service sales, average number of visits per year, number of new clients per month, etc.
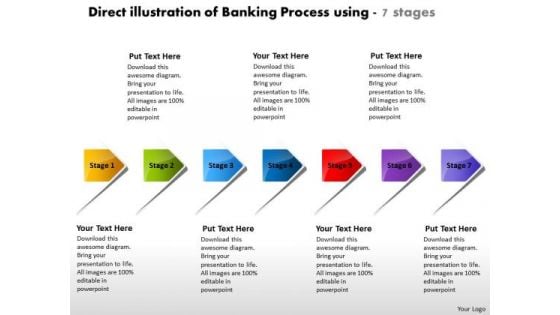
Direct Illustration Of Banking Process Using 7 Stages Electrical Design PowerPoint Slides
We present our direct illustration of banking process using 7 stages electrical design PowerPoint Slides.Use our Business PowerPoint Templates because,The fruits of your labour are beginning to show.Enlighten them on the great plans you have for their enjoyment Use our Shapes PowerPoint Templates because, You have a great plan to put the pieces together, getting all the various contributors to gel for a successful completion. Use our Signs PowerPoint Templates because,our creative template will lay down your views. Use our Arrows PowerPoint Templates because,You can Trigger audience minds with your interesting ideas. Use our Process and Flows PowerPoint Templates because,This diagram helps to reaffirm to your team your faith in maintaining the highest ethical standards.Use these PowerPoint slides for presentations relating to account, arrow, arrows, away, box, business, chart, choice, concept, concepts, consultation, corporate, design, diagram, direction, elements, flow, follow, follows, future, group, grow, increase, lines, many, month, move, past, period, phase, project, report, rise, row, step, success, text, time, timeline, work, year. The prominent colors used in the PowerPoint template are Yellow, Green, Blue. People tell us our direct illustration of banking process using 7 stages electrical design PowerPoint Slides will generate and maintain the level of interest you desire. They will create the impression you want to imprint on your audience. The feedback we get is that our away PowerPoint templates and PPT Slides are Perfect. People tell us our direct illustration of banking process using 7 stages electrical design PowerPoint Slides are Multicolored. Presenters tell us our concept PowerPoint templates and PPT Slides are effectively colour coded to prioritise your plans They automatically highlight the sequence of events you desire. The feedback we get is that our direct illustration of banking process using 7 stages electrical design PowerPoint Slides are Vintage. Professionals tell us our away PowerPoint templates and PPT Slides will make the presenter look like a pro even if they are not computer savvy. If you have doubts about the effort required? Be assured our Direct Illustration Of Banking Process Using 7 Stages Electrical Design PowerPoint Slides will make it fairly easy.
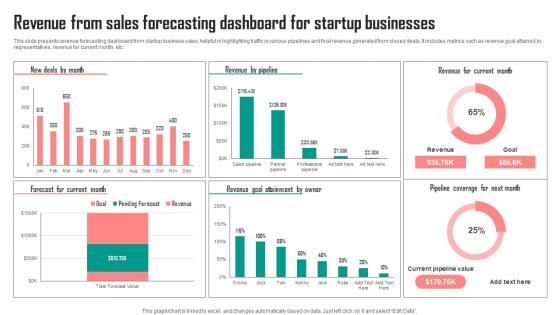
Revenue From Sales Forecasting Dashboard For Startup Businesses Graphics Pdf
This slide presents revenue forecasting dashboard from startup business sales, helpful in highlighting traffic in various pipelines and final revenue generated from closed deals. It includes metrics such as revenue goal attained by representatives, revenue for current month, etc. Showcasing this set of slides titled Revenue From Sales Forecasting Dashboard For Startup Businesses Graphics Pdf. The topics addressed in these templates are Owner, Current Month, Businesses. All the content presented in this PPT design is completely editable. Download it and make adjustments in color, background, font etc. as per your unique business setting. This slide presents revenue forecasting dashboard from startup business sales, helpful in highlighting traffic in various pipelines and final revenue generated from closed deals. It includes metrics such as revenue goal attained by representatives, revenue for current month, etc.
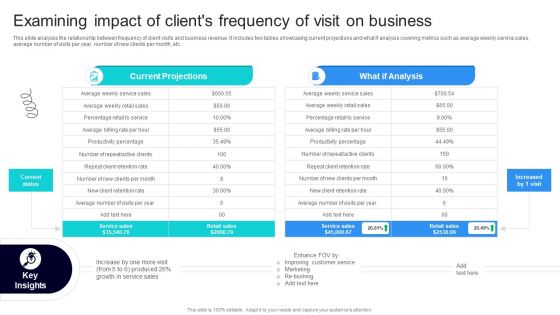
Strategic Marketing For Hair And Beauty Salon To Increase Examining Impact Of Clients Formats PDF
This slide analyzes the relationship between frequency of client visits and business revenue. It includes two tables showcasing current projections and what if analysis covering metrics such as average weekly service sales, average number of visits per year, number of new clients per month, etc. Boost your pitch with our creative Strategic Marketing For Hair And Beauty Salon To Increase Examining Impact Of Clients Formats PDF. Deliver an awe-inspiring pitch that will mesmerize everyone. Using these presentation templates you will surely catch everyones attention. You can browse the ppts collection on our website. We have researchers who are experts at creating the right content for the templates. So you do not have to invest time in any additional work. Just grab the template now and use them.
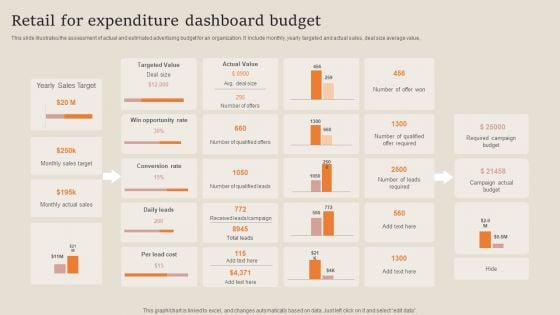
Retail For Expenditure Dashboard Budget Designs PDF
This slide illustrates the assessment of actual and estimated advertising budget for an organization. It include monthly, yearly targeted and actual sales, deal size average value, Showcasing this set of slides titled Retail For Expenditure Dashboard Budget Designs PDF. The topics addressed in these templates are Sales Target, Opportunity Rate, Required Campaign Budget. All the content presented in this PPT design is completely editable. Download it and make adjustments in color, background, font etc. as per your unique business setting.
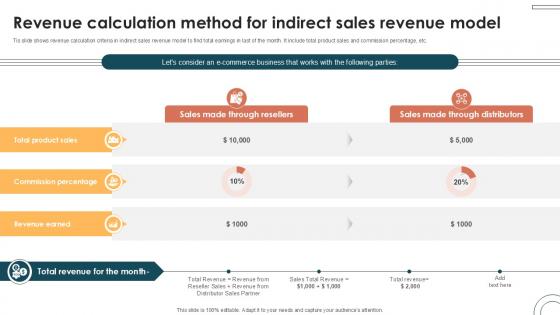
Revenue Calculation Method For Indirect Internet Based Trade Structure Ppt Powerpoint
Tis slide shows revenue calculation criteria in indirect sales revenue model to find total earnings in last of the month. It include total product sales and commission percentage, etc. Are you in need of a template that can accommodate all of your creative concepts This one is crafted professionally and can be altered to fit any style. Use it with Google Slides or PowerPoint. Include striking photographs, symbols, depictions, and other visuals. Fill, move around, or remove text boxes as desired. Test out color palettes and font mixtures. Edit and save your work, or work with colleagues. Download Revenue Calculation Method For Indirect Internet Based Trade Structure Ppt Powerpoint and observe how to make your presentation outstanding. Give an impeccable presentation to your group and make your presentation unforgettable. Tis slide shows revenue calculation criteria in indirect sales revenue model to find total earnings in last of the month. It include total product sales and commission percentage, etc.
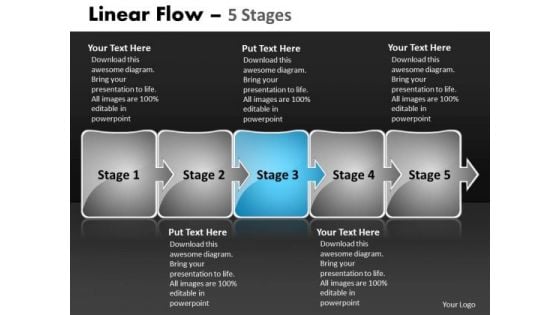
Ppt Theme Company Pre Procedure In Five Horizontal And Vertical Rulers Stages 4 Design
We present our PPT Theme Company pre procedure in five horizontal and vertical ruler's stages 4 design. Use our Arrows PowerPoint Templates because, the ideas and plans are on your finger tips. Use our Boxes PowerPoint Templates because, Targets: - You have a handle on all the targets, a master of the game, the experienced and consummate juggler. Use our Symbol PowerPoint Templates because; illustrate your plans on using the many social media modes available to inform society at large of the benefits of your product. Use our Process and Flows PowerPoint Templates because, All elements of the venture are equally critical. Use our Marketing PowerPoint Templates because; Take your team along by explaining your plans. Use these PowerPoint slides for presentations relating to Account, Arrow, Arrows, Away, Box, Business, Chart, Choice, Choose, Concept, Concepts, Consultation, Corporate, Design, Diagram, Direction, Elements, Flow, Follow, Follows, Future, Group, Grow, Increase, Lines, Many, Month, Move, Past, Period, Phase, Project, Report, Rise, Row, Step, Success, Text, Time, Timeline, Today, Up, Way, Ways, Work, Year. The prominent colors used in the PowerPoint template are Blue, Gray, and Black Offer solutions with our Ppt Theme Company Pre Procedure In Five Horizontal And Vertical Rulers Stages 4 Design. Download without worries with our money back guaranteee.
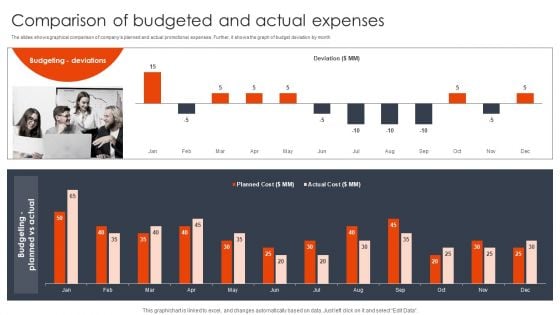
Comparison Of Budgeted And Actual Expenses Client Acquisition Techniques To Boost Sales Designs PDF
The slides shows graphical comparison of companys planned and actual promotional expenses. Further, it shows the graph of budget deviation by month. Create an editable Comparison Of Budgeted And Actual Expenses Client Acquisition Techniques To Boost Sales Designs PDF that communicates your idea and engages your audience. Whether you are presenting a business or an educational presentation, pre-designed presentation templates help save time. Comparison Of Budgeted And Actual Expenses Client Acquisition Techniques To Boost Sales Designs PDF is highly customizable and very easy to edit, covering many different styles from creative to business presentations. Slidegeeks has creative team members who have crafted amazing templates. So, go and get them without any delay.
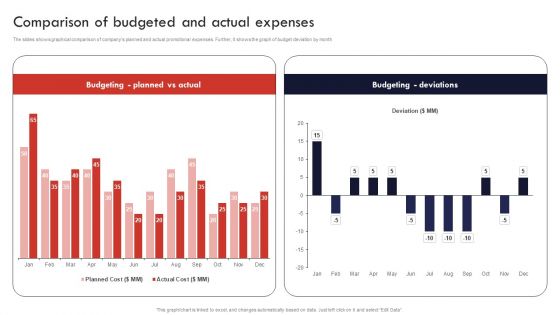
Product And Services Promotion Comparison Of Budgeted And Actual Expenses Template PDF
The slides shows graphical comparison of companys planned and actual promotional expenses. Further, it shows the graph of budget deviation by month. Make sure to capture your audiences attention in your business displays with our gratis customizable Product And Services Promotion Comparison Of Budgeted And Actual Expenses Template PDF. These are great for business strategies, office conferences, capital raising or task suggestions. If you desire to acquire more customers for your tech business and ensure they stay satisfied, create your own sales presentation with these plain slides.
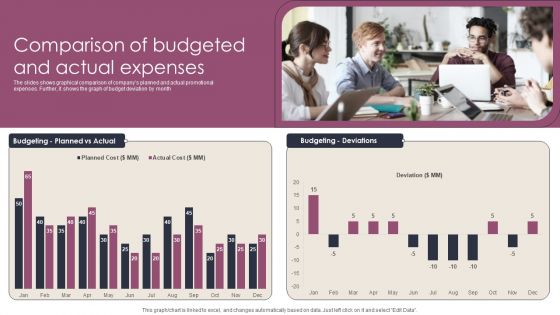
Comparison Of Budgeted And Actual Expenses Stages To Develop Demand Generation Tactics Information PDF
The slides shows graphical comparison of companys planned and actual promotional expenses. Further, it shows the graph of budget deviation by month. Want to ace your presentation in front of a live audience Our Comparison Of Budgeted And Actual Expenses Stages To Develop Demand Generation Tactics Information PDF can help you do that by engaging all the users towards you. Slidegeeks experts have put their efforts and expertise into creating these impeccable powerpoint presentations so that you can communicate your ideas clearly. Moreover, all the templates are customizable, and easy-to-edit and downloadable. Use these for both personal and commercial use.
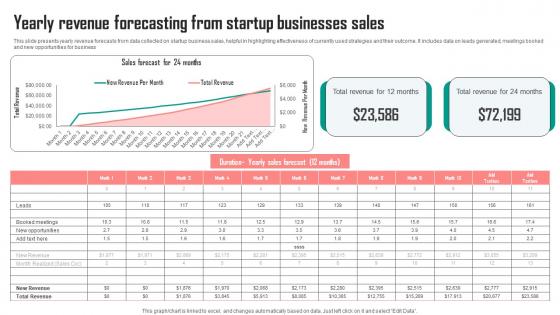
Yearly Revenue Forecasting From Startup Businesses Sales Graphics Pdf
This slide presents yearly revenue forecasts from data collected on startup business sales, helpful in highlighting effectiveness of currently used strategies and their outcome. It includes data on leads generated, meetings booked and new opportunities for business Pitch your topic with ease and precision using this Yearly Revenue Forecasting From Startup Businesses Sales Graphics Pdf. This layout presents information on Sales, Total Revenue, Months. It is also available for immediate download and adjustment. So, changes can be made in the color, design, graphics or any other component to create a unique layout. This slide presents yearly revenue forecasts from data collected on startup business sales, helpful in highlighting effectiveness of currently used strategies and their outcome. It includes data on leads generated, meetings booked and new opportunities for business
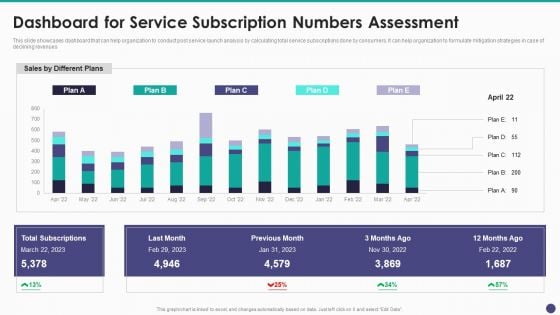
New Service Launch And Development Strategy To Gain Market Share Dashboard For Service Subscription Summary PDF
This slide showcases dashboard that can help organization to conduct post service launch analysis by calculating total service subscriptions done by consumers. It can help organization to formulate mitigation strategies in case of declining revenues.Deliver and pitch your topic in the best possible manner with this New Service Launch And Development Strategy To Gain Market Share Dashboard For Service Subscription Summary PDF Use them to share invaluable insights on Total Subscriptions, Previous Month, Different Plans and impress your audience. This template can be altered and modified as per your expectations. So, grab it now.
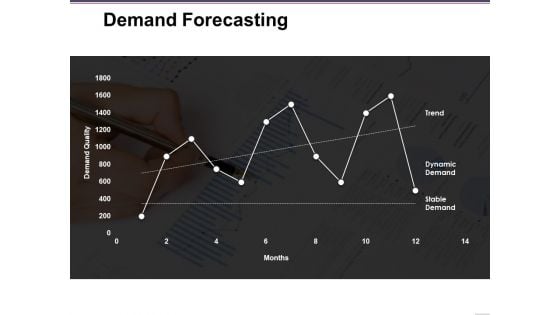
Demand Forecasting Ppt PowerPoint Presentation Portfolio Smartart
This is a demand forecasting ppt powerpoint presentation portfolio smartart. This is a one stage process. The stages in this process are stable demand, months, dynamic demand, trend, demand quality.
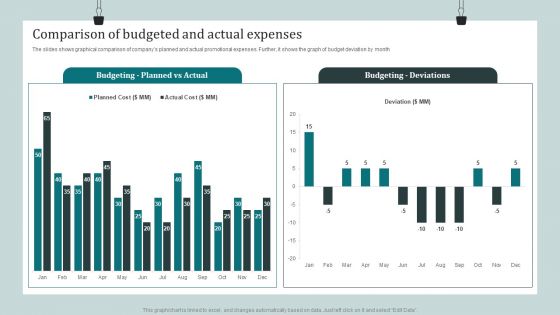
Product Awareness Strategies To Raise Demand Comparison Of Budgeted And Actual Expenses Slides PDF
The slides shows graphical comparison of companys planned and actual promotional expenses. Further, it shows the graph of budget deviation by month. This Product Awareness Strategies To Raise Demand Comparison Of Budgeted And Actual Expenses Slides PDF from Slidegeeks makes it easy to present information on your topic with precision. It provides customization options, so you can make changes to the colors, design, graphics, or any other component to create a unique layout. It is also available for immediate download, so you can begin using it right away. Slidegeeks has done good research to ensure that you have everything you need to make your presentation stand out. Make a name out there for a brilliant performance.
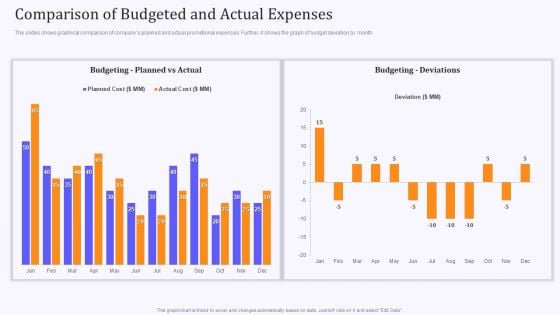
Product Marketing And Awareness Programs Comparison Of Budgeted And Actual Expenses Designs PDF
The slides shows graphical comparison of companys planned and actual promotional expenses. Further, it shows the graph of budget deviation by month. Find highly impressive Product Marketing And Awareness Programs Comparison Of Budgeted And Actual Expenses Designs PDF on Slidegeeks to deliver a meaningful presentation. You can save an ample amount of time using these presentation templates. No need to worry to prepare everything from scratch because Slidegeeks experts have already done a huge research and work for you. You need to download Product Marketing And Awareness Programs Comparison Of Budgeted And Actual Expenses Designs PDF for your upcoming presentation. All the presentation templates are 100 percent editable and you can change the color and personalize the content accordingly. Download now.
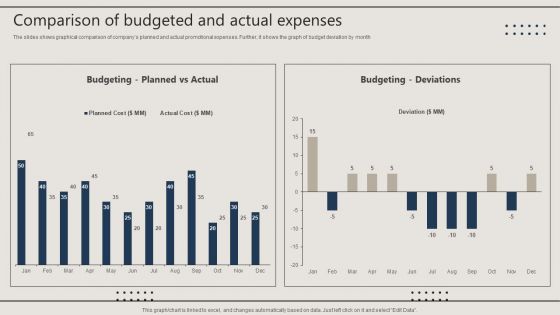
Promotion Techniques Used By B2B Firms Comparison Of Budgeted And Actual Expenses Infographics PDF
The slides shows graphical comparison of companys planned and actual promotional expenses. Further, it shows the graph of budget deviation by month. Do you know about Slidesgeeks Promotion Techniques Used By B2B Firms Comparison Of Budgeted And Actual Expenses Infographics PDF These are perfect for delivering any kind od presentation. Using it, create PowerPoint presentations that communicate your ideas and engage audiences. Save time and effort by using our pre designed presentation templates that are perfect for a wide range of topic. Our vast selection of designs covers a range of styles, from creative to business, and are all highly customizable and easy to edit. Download as a PowerPoint template or use them as Google Slides themes.
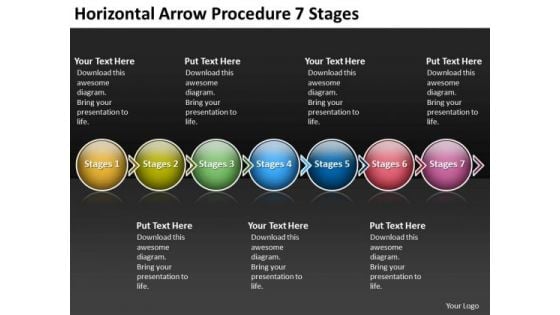
Horizontal Arrow Procedure 7 Stages Process Flow Chart For Manufacturing PowerPoint Slides
We present our horizontal arrow procedure 7 stages process flow chart for manufacturing PowerPoint Slides. Use our Spheres PowerPoint Templates because, you have the product you are very confident of and are very sure it will prove immensely popular with clients all over your target areas. Use our Arrows PowerPoint Templates because, the plans are in your head, stage by stage, year by year. Use our Symbol PowerPoint Templates because; Refine them all as you take them through the numerous filtering stages of the funnel of your quality control process. Use our Marketing PowerPoint Templates because, you have churned your mind and come up with effective ways and means to further refine it. Use our Process and Flows PowerPoint Templates because, You have it all down to a Tousle these PowerPoint slides for presentations relating to Account, Arrow, Arrows, Away, Box, Business, Chart, Choice, Choose, Concept, Concepts, Consultation, Corporate, Design, Diagram, Direction, Elements, Flow, Follow, Follows, Future, Group, Grow, Increase, Lines, Many, Month, Move, Past, Period, Phase, Project, Report, Rise, Row, Step, Success, Spheres, Text, Time, Timeline, Today, Up, Way, Ways, Work, Year. The prominent colors used in the PowerPoint template are Yellow, Green, and Red Our Horizontal Arrow Procedure 7 Stages Process Flow Chart For Manufacturing PowerPoint Slides will catch their fancy. They are made to please the eye.
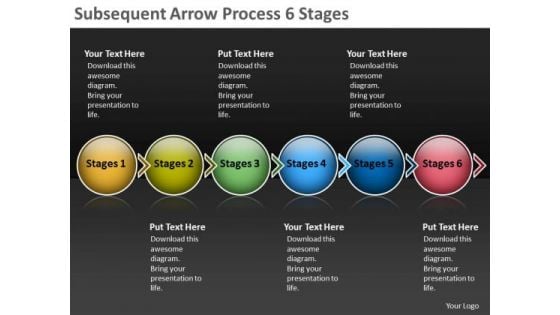
Subsequent Arrow Process 6 Stages Production Flow Charts PowerPoint Templates
We present our subsequent arrow process 6 stages production flow charts PowerPoint templates. Use our Spheres PowerPoint Templates because; Brilliant ideas are your forte. Use our Arrows PowerPoint Templates because, are the stepping stones of our journey till date. Use our Symbol PowerPoint Templates because, Brilliant ideas popping up all over the place. Use our Marketing PowerPoint Templates because, Our PowerPoint templates designed for your ideas to sell. Use our Process and Flows PowerPoint Templates because, you have some exciting plans to spread goodwill among the underprivileged, Expound on your ideas and show to your colleagues how they can help others and in the process increase your Brand value. Use these PowerPoint slides for presentations relating to Account, Arrow, Arrows, Away, Box, Business, Chart, Choice, Choose, Concept, Concepts, Consultation, Corporate, Design, Diagram, Direction, Elements, Flow, Follow, Follows, Future, Group, Grow, Increase, Lines, Many, Month, Move, Past, Period, Phase, Project, Report, Rise, Row, Step, Success, Spheres, Text, Time, Timeline, Today, Up, Way, Ways, Work, Year. The prominent colors used in the PowerPoint template are Yellow, Green, and Blue Close deals with our Subsequent Arrow Process 6 Stages Production Flow Charts PowerPoint Templates. Download without worries with our money back guaranteee.
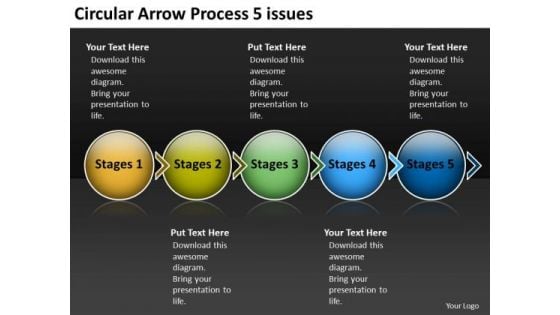
Circular Arrow Process 5 Issues Best Flow Chart PowerPoint Slides
We present our circular arrow process 5 issues best flow chart PowerPoint Slides. Use our Spheres PowerPoint Templates because, it is in your DNA to analyses possible causes to the minutest detail. Use our Arrows PowerPoint Templates because; demonstrate how you think out of the box. Use our Symbol PowerPoint Templates because; Give them an overview of your capability and insight into the minute details of the overall picture highlighting the interdependence at every operational level. Use our Marketing PowerPoint Templates because, you are going along well but your foresight shows that it may need a slight change in plans or direction. Use our Process and Flows PowerPoint Templates because, Stable ideas are the building blocks of a successful structure. Use these PowerPoint slides for presentations relating to Account, Arrow, Arrows, Away, Box, Business, Chart, Choice, Choose, Concept, Concepts, Consultation, Corporate, Design, Diagram, Direction, Elements, Flow, Follow, Follows, Future, Group, Grow, Increase, Lines, Many, Month, Move, Past, Period, Phase, Project, Report, Rise, Row, Step, Success, Spheres, Text, Time, Timeline, Today, Up, Way, Ways, Work, Year. The prominent colors used in the PowerPoint template are Yellow, Green, and Blue Exhort your team with our Circular Arrow Process 5 Issues Best Flow Chart PowerPoint Slides. Urge them on to go one better.
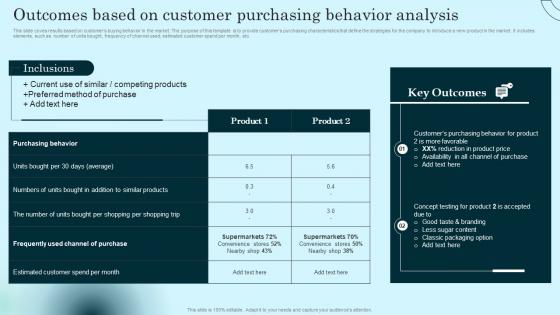
Outcomes Based On Customer Purchasing Comprehensive Guide To Product Lifecycle Information Pdf
This slide coves results based on customers buying behavior in the market. The purpose of this template is to provide customers purchasing characteristics that define the strategies for the company to introduce a new product in the market. It includes elements, such as number of units bought, frequency of channel used, estimated customer spend per month, etc. Welcome to our selection of the Outcomes Based On Customer Purchasing Comprehensive Guide To Product Lifecycle Information Pdf. These are designed to help you showcase your creativity and bring your sphere to life. Planning and Innovation are essential for any business that is just starting out. This collection contains the designs that you need for your everyday presentations. All of our PowerPoints are 100 percent editable, so you can customize them to suit your needs. This multi purpose template can be used in various situations. Grab these presentation templates today This slide coves results based on customers buying behavior in the market. The purpose of this template is to provide customers purchasing characteristics that define the strategies for the company to introduce a new product in the market. It includes elements, such as number of units bought, frequency of channel used, estimated customer spend per month, etc.
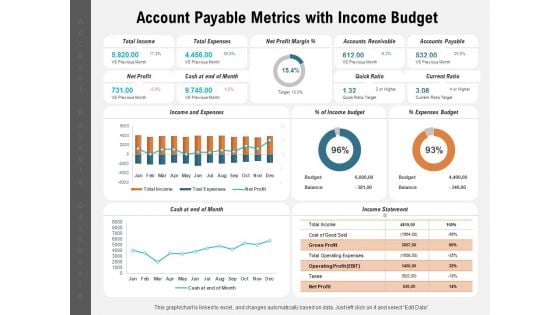
Account Payable Metrics With Income Budget Ppt PowerPoint Presentation Layouts Master Slide PDF
Presenting this set of slides with name account payable metrics with income budget ppt powerpoint presentation layouts master slide pdf. The topics discussed in these slides are total income, total expenses, net profit margin, accounts receivable, accounts payable, net profit, cash at end of month, quick ratio, current ratio, expenses budget, income budget, cash at end of month. This is a completely editable PowerPoint presentation and is available for immediate download. Download now and impress your audience.
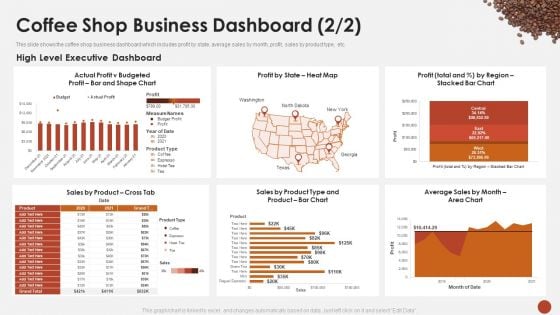
Coffee Shop Business Dashboard Executive Blueprint For Opening A Coffee Shop Ppt Pictures Example PDF
This slide shows the coffee shop business dashboard which includes profit by state, average sales by month, profit, sales by product type, etc. Deliver an awe inspiring pitch with this creative coffee shop business dashboard executive blueprint for opening a coffee shop ppt pictures example pdf bundle. Topics like executive, dashboard, sales, budgeted can be discussed with this completely editable template. It is available for immediate download depending on the needs and requirements of the user.
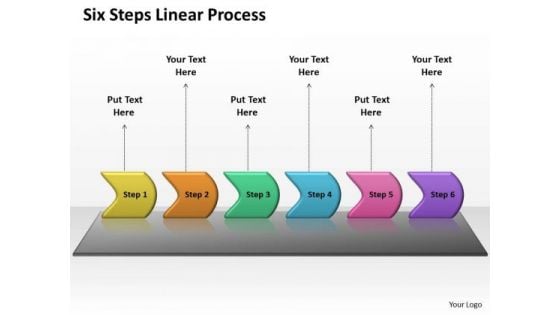
Usa Ppt Background Six Practice The PowerPoint Macro Steps Linear Process 1 Graphic
USA PPT Background six practice the powerpoint macro steps linear process 1 Graphic-This PowerPoint diagram shows six steps of a process. Demonstrate to your audience how the best and most refined ideas pass through. Use this slide to highlight your thought process.-USA PPT Background six practice the powerpoint macro steps linear process 1 Graphic-Account, Arrow, Arrows, Away, Box, Business, Chart, Choice, Choose, Concept, Concepts, Consultation, Corporate, Design, Diagram, Direction, Elements, Flow, Follow, Follows, Future, Group, Grow, Increase, Lines, Many, Month, Move, Past, Period, Phase, Project, Report, Rise, Row, Step, Success Overcome resistance with our Usa Ppt Background Six Practice The PowerPoint Macro Steps Linear Process 1 Graphic. You will come out on top.
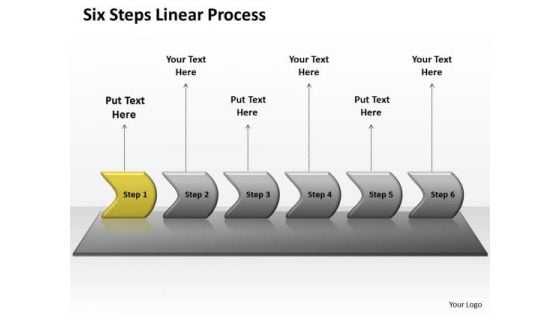
Usa Ppt Background Six Practice The PowerPoint Macro Steps Linear Process 2 Graphic
USA PPT Background six practice the powerpoint macro steps linear process 2 Graphic-By using this diagram you can visualize events and the analysis of risks and uncertainties. Educate your listeners on the relevance and importance of each one as per your plan.-USA PPT Background six practice the powerpoint macro steps linear process 2 Graphic-Account, Arrow, Arrows, Away, Box, Business, Chart, Choice, Choose, Concept, Concepts, Consultation, Corporate, Design, Diagram, Direction, Elements, Flow, Follow, Follows, Future, Group, Grow, Increase, Lines, Many, Month, Move, Past, Period, Phase, Project, Report, Rise, Row, Step, Success Display world class organization with our Usa Ppt Background Six Practice The PowerPoint Macro Steps Linear Process 2 Graphic. They will make you look good.
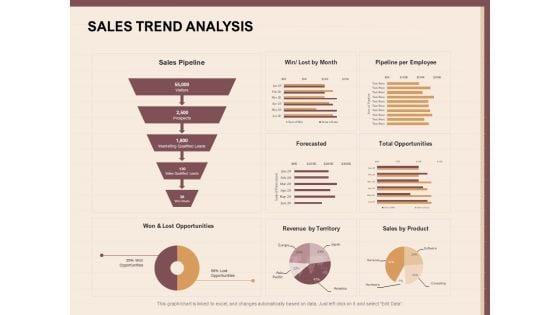
Best Practices For Increasing Lead Conversion Rates Sales Trend Analysis Ideas PDF
Presenting this set of slides with name best practices for increasing lead conversion rates sales trend analysis ideas pdf. The topics discussed in these slides are sales pipeline, won and lost opportunities, revenue territory, sales product, forecasted, total opportunities, win lost month, pipeline per employee. This is a completely editable PowerPoint presentation and is available for immediate download. Download now and impress your audience.
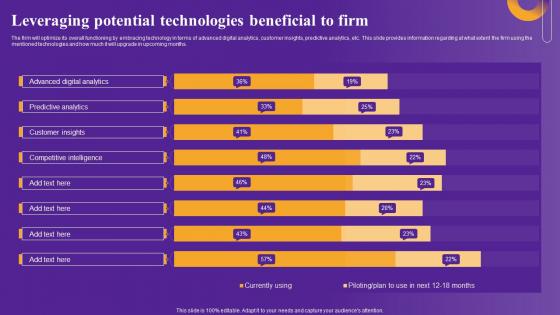
Leveraging Potential Technologies Strategic Framework To Improve Digital Transformation Brochure Pdf
The firm will optimize its overall functioning by embracing technology in terms of advanced digital analytics, customer insights, predictive analytics, etc. This slide provides information regarding at what extent the firm using the mentioned technologies and how much it will upgrade in upcoming months. Make sure to capture your audiences attention in your business displays with our gratis customizable Leveraging Potential Technologies Strategic Framework To Improve Digital Transformation Brochure Pdf. These are great for business strategies, office conferences, capital raising or task suggestions. If you desire to acquire more customers for your tech business and ensure they stay satisfied, create your own sales presentation with these plain slides. The firm will optimize its overall functioning by embracing technology in terms of advanced digital analytics, customer insights, predictive analytics, etc. This slide provides information regarding at what extent the firm using the mentioned technologies and how much it will upgrade in upcoming months.
Usa Ppt Template Five Scientific Method Steps Representation Video Linear Process 6 Graphic
USA PPT template five scientific method steps representation video Linear Process 6 Graphic-This diagram can help you see whether the steps of a process are logical, define the boundaries of a process, and develop a common base of knowledge about a process.-USA PPT template five scientific method steps representation video Linear Process 6 Graphic-Account, Arrow, Arrows, Away, Box, Business, Chart, Choice, Choose, Concept, Concepts, Consultation, Corporate, Design, Diagram, Direction, Elements, Flow, Follow, Follows, Future, Group, Grow, Increase, Lines, Many, Month, Move, Past, Period, Phase, Project, Report, Rise, Row, Step, Success Flood your audience with great slides with our Usa Ppt Template Five Scientific Method Steps Representation Video Linear Process 6 Graphic. Try us out and see what a difference our templates make.
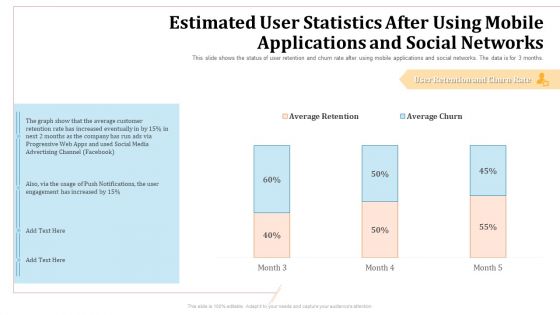
Estimated User Statistics After Using Mobile Applications And Social Networks Average Retention Portrait PDF
This slide shows the status of user retention and churn rate after using mobile applications and social networks. The data is for 3 months. Deliver an awe inspiring pitch with this creative estimated user statistics after using mobile applications and social networks average retention portrait pdf bundle. Topics like estimated user statistics after using mobile applications and social networks can be discussed with this completely editable template. It is available for immediate download depending on the needs and requirements of the user.
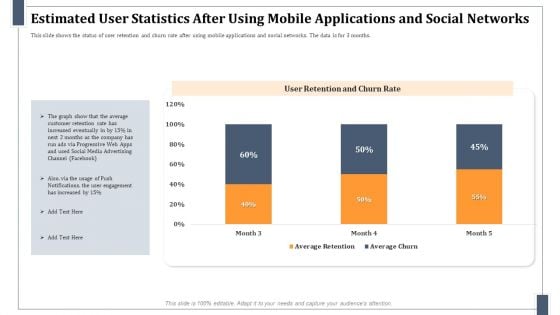
Estimated User Statistics After Using Mobile Applications And Social Networks Sample PDF
This slide shows the status of user retention and churn rate after using mobile applications and social networks. The data is for 3 months. Deliver an awe inspiring pitch with this creative estimated user statistics after using mobile applications and social networks sample pdf bundle. Topics like retention, customer, advertising, engagement can be discussed with this completely editable template. It is available for immediate download depending on the needs and requirements of the user.
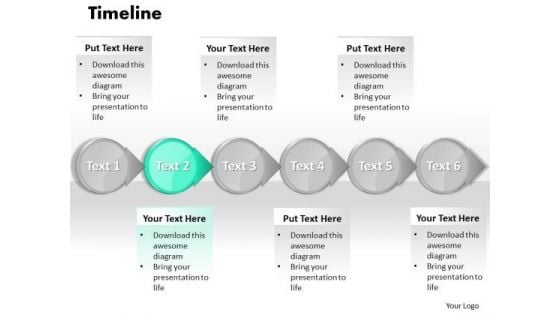
Ppt PowerPoint Slide Numbers A Procedure Or Timeline 2007 Templates
PPT powerpoint slide numbers a procedure or timeline 2007 Templates-This image represents the concept of structured analysis technique that employs a set of visual representations of the data that moves through the organization. This template is specifically designed to highlight you points. Organize your thoughts and illuminate your ideas accordingly-PPT powerpoint slide numbers a procedure or timeline 2007 Templates-Account, Arrow, Arrows, Away, Box, Business, Chart, Choice, Choose, Concept, Concepts, Consultation, Corporate, Design, Diagram, Direction, Elements, Flow, Follow, Follows, Future, Group, Grow, Increase, Lines, Many, Month, Move, Past, Period, Phase, Project, Report, Rise, Row, Step, Success, Text, Time, Timeline, Today, Up, Way, Ways, Work, Year Close deals with our Ppt PowerPoint Slide Numbers A Procedure Or Timeline 2007 Templates. Download without worries with our money back guaranteee.
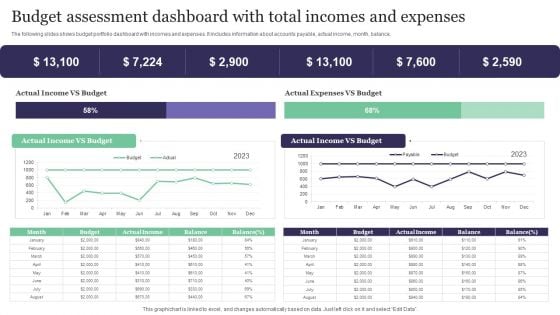
Budget Assessment Dashboard With Total Incomes And Expenses Information PDF
The following slides shows budget portfolio dashboard with incomes and expenses. It includes information about accounts payable, actual income, month, balance, Pitch your topic with ease and precision using this Budget Assessment Dashboard With Total Incomes And Expenses Information PDF. This layout presents information on Actual Income, Actual Expenses. It is also available for immediate download and adjustment. So, changes can be made in the color, design, graphics or any other component to create a unique layout.
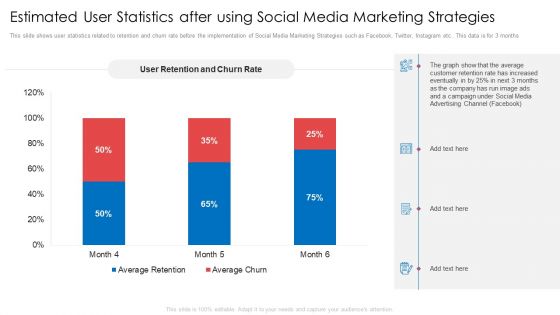
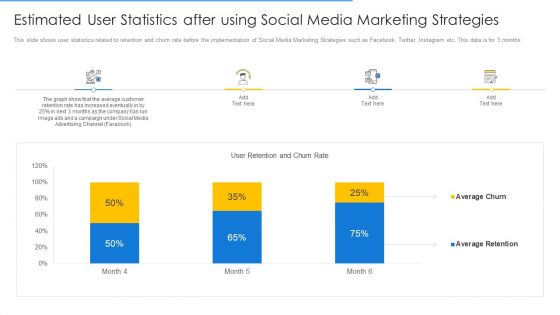
Estimated User Statistics After Using Social Media Marketing Strategies Ppt Portfolio Visuals PDF
This slide shows user statistics related to retention and churn rate before the implementation of Social Media Marketing Strategies such as Facebook, Twitter, Instagram etc.. This data is for 3 months. Deliver and pitch your topic in the best possible manner with this estimated user statistics after using social media marketing strategies ppt portfolio visuals pdf. Use them to share invaluable insights on social media, advertising, customer, average and impress your audience. This template can be altered and modified as per your expectations. So, grab it now.
Online Merchandising Techniques Enhance Conversion Rate Estimated User Statistics After Using Social Media Marketing Strategies Professional PDF
This slide shows user statistics related to retention and churn rate before the implementation of Social Media Marketing Strategies such as Facebook, Twitter, Instagram etc. This data is for 3 months. Deliver and pitch your topic in the best possible manner with this online merchandising techniques enhance conversion rate estimated user statistics after using social media marketing strategies professional pdf. Use them to share invaluable insights on social media, campaign, retention and impress your audience. This template can be altered and modified as per your expectations. So, grab it now.
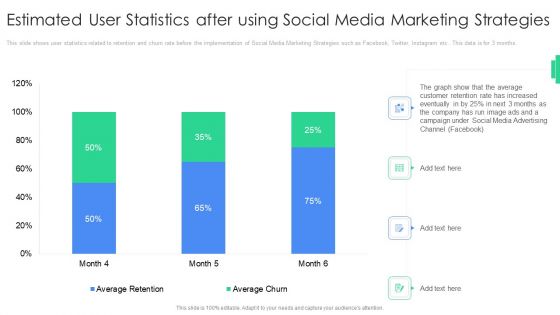
Estimated User Statistics After Using Social Media Marketing Strategies Inspiration PDF
This slide shows user statistics related to retention and churn rate before the implementation of Social Media Marketing Strategies such as Facebook, Twitter, Instagram etc. This data is for 3 months. Deliver an awe inspiring pitch with this creative estimated user statistics after using social media marketing strategies inspiration pdf bundle. Topics like estimated user statistics after using social media marketing strategies can be discussed with this completely editable template. It is available for immediate download depending on the needs and requirements of the user.
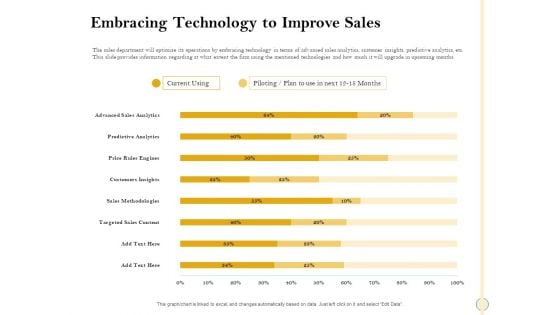
Sales Optimization Best Practices To Close More Deals Embracing Technology To Improve Sales Guidelines PDF
The sales department will optimize its operations by embracing technology in terms of advanced sales analytics, customer insights, predictive analytics, etc. This slide provides information regarding at what extent the firm using the mentioned technologies and how much it will upgrade in upcoming months. Deliver an awe inspiring pitch with this creative sales optimization best practices to close more deals embracing technology to improve sales guidelines pdf bundle. Topics like plan, analytics, sales, targeted, price can be discussed with this completely editable template. It is available for immediate download depending on the needs and requirements of the user.
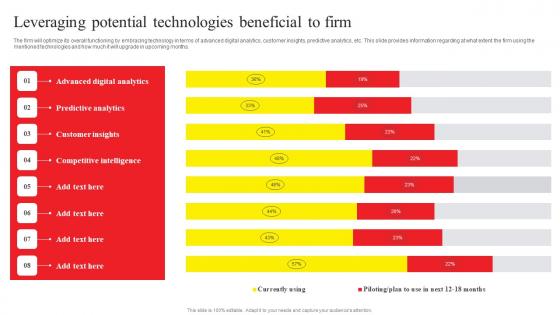
Online Advertising And Technology Task Leveraging Potential Technologies Beneficial Microsoft Pdf
The firm will optimize its overall functioning by embracing technology in terms of advanced digital analytics, customer insights, predictive analytics, etc. This slide provides information regarding at what extent the firm using the mentioned technologies and how much it will upgrade in upcoming months. Formulating a presentation can take up a lot of effort and time, so the content and message should always be the primary focus. The visuals of the PowerPoint can enhance the presenters message, so our Online Advertising And Technology Task Leveraging Potential Technologies Beneficial Microsoft Pdf was created to help save time. Instead of worrying about the design, the presenter can concentrate on the message while our designers work on creating the ideal templates for whatever situation is needed. Slidegeeks has experts for everything from amazing designs to valuable content, we have put everything into Online Advertising And Technology Task Leveraging Potential Technologies Beneficial Microsoft Pdf. The firm will optimize its overall functioning by embracing technology in terms of advanced digital analytics, customer insights, predictive analytics, etc. This slide provides information regarding at what extent the firm using the mentioned technologies and how much it will upgrade in upcoming months.
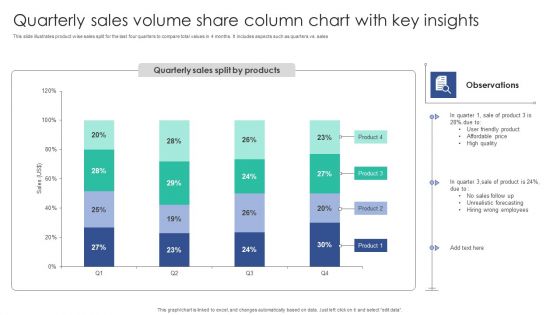
Quarterly Sales Volume Share Column Chart With Key Insights Structure PDF
This slide illustrates product wise sales split for the last four quarters to compare total values in 4 months. It includes aspects such as quarters vs. salesShowcasing this set of slides titled Quarterly Sales Volume Share Column Chart With Key Insights Structure PDF. The topics addressed in these templates are Unrealistic Forecasting, Wrong Employees, Friendly Product. All the content presented in this PPT design is completely editable. Download it and make adjustments in color, background, font etc. as per your unique business setting.
Top Business People 3d Man With Pie Chart New PowerPoint Presentation Templates
We present our top business people 3d man with pie chart new powerpoint presentation templates.Present our Circle Charts PowerPoint Templates because You can Be the star of the show with our PowerPoint Templates and Slides. Rock the stage with your ideas. Present our Business PowerPoint Templates because Our PowerPoint Templates and Slides will Activate the energies of your audience. Get their creative juices flowing with your words. Download our People PowerPoint Templates because our PowerPoint Templates and Slides will give your ideas the shape. Use our Shapes PowerPoint Templates because It will mark the footprints of your journey. Illustrate how they will lead you to your desired destination. Download our Success PowerPoint Templates because You can Channelise the thoughts of your team with our PowerPoint Templates and Slides. Urge them to focus on the goals you have set.Use these PowerPoint slides for presentations relating to 3d,active, analysis, business, cartoon, character, chart, commerce, company, data,diagram, earning, economy, figures, financial, forecast, gain, goal, graph, growth,guy, income, investment, male, man, market, money, monthly, number, person,pie, planning, positive, profit, profitable, progress, pushing, report, research,results, revenue, sale, sheet, spreadsheet, statement, statistics, stock, table. The prominent colors used in the PowerPoint template are Blue , Gray, Black. We assure you our top business people 3d man with pie chart new powerpoint presentation templates provide you with a vast range of viable options. Select the appropriate ones and just fill in your text. You can be sure our character PowerPoint templates and PPT Slides will make the presenter successul in his career/life. Use our top business people 3d man with pie chart new powerpoint presentation templates will make the presenter successul in his career/life. We assure you our chart PowerPoint templates and PPT Slides will get their audience's attention. Use our top business people 3d man with pie chart new powerpoint presentation templates will make you look like a winner. Professionals tell us our chart PowerPoint templates and PPT Slides will generate and maintain the level of interest you desire. They will create the impression you want to imprint on your audience. Convincing an audience can be demanding. Assert your credibilitywith our Top Business People 3d Man With Pie Chart New PowerPoint Presentation Templates.
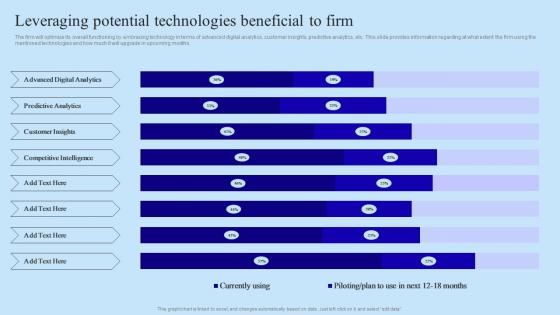
Leveraging Potential Technologies Beneficial Organisational Digital Innovation Demonstration PDF
The firm will optimize its overall functioning by embracing technology in terms of advanced digital analytics, customer insights, predictive analytics, etc. This slide provides information regarding at what extent the firm using the mentioned technologies and how much it will upgrade in upcoming months. Make sure to capture your audiences attention in your business displays with our gratis customizable Leveraging Potential Technologies Beneficial Organisational Digital Innovation Demonstration PDF. These are great for business strategies, office conferences, capital raising or task suggestions. If you desire to acquire more customers for your tech business and ensure they stay satisfied, create your own sales presentation with these plain slides. The firm will optimize its overall functioning by embracing technology in terms of advanced digital analytics, customer insights, predictive analytics, etc. This slide provides information regarding at what extent the firm using the mentioned technologies and how much it will upgrade in upcoming months.
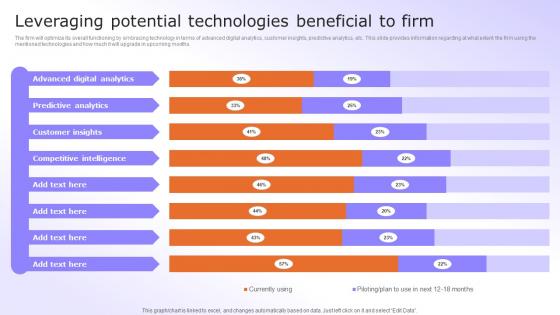
Digital Advancement Checklist Leveraging Potential Technologies Beneficial To Firm Introduction Pdf
The firm will optimize its overall functioning by embracing technology in terms of advanced digital analytics, customer insights, predictive analytics, etc. This slide provides information regarding at what extent the firm using the mentioned technologies and how much it will upgrade in upcoming months. Make sure to capture your audiences attention in your business displays with our gratis customizable Digital Advancement Checklist Leveraging Potential Technologies Beneficial To Firm Introduction Pdf. These are great for business strategies, office conferences, capital raising or task suggestions. If you desire to acquire more customers for your tech business and ensure they stay satisfied, create your own sales presentation with these plain slides. The firm will optimize its overall functioning by embracing technology in terms of advanced digital analytics, customer insights, predictive analytics, etc. This slide provides information regarding at what extent the firm using the mentioned technologies and how much it will upgrade in upcoming months.
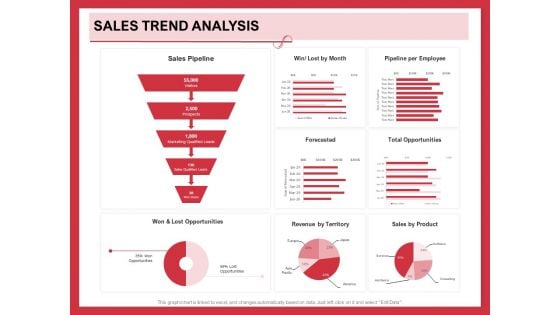
Implementing Compelling Marketing Channel Sales Trend Analysis Ppt PowerPoint Presentation Model Guidelines PDF
Presenting this set of slides with name implementing compelling marketing channel sales trend analysis ppt powerpoint presentation model guidelines pdf. The topics discussed in these slides are sales pipeline, won and lost opportunities, revenue territory, sales product, forecasted, total opportunities, win lost month, pipeline per employee. This is a completely editable PowerPoint presentation and is available for immediate download. Download now and impress your audience.
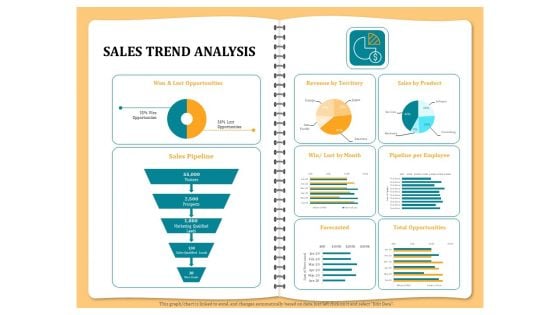
Optimizing Marketing Channel For Profit Increment Sales Trend Analysis Ppt PowerPoint Presentation Professional Show PDF
Presenting this set of slides with name optimizing marketing channel for profit increment sales trend analysis ppt powerpoint presentation professional show pdf. The topics discussed in these slides are sales pipeline, won and lost opportunities, revenue territory, sales product, forecasted, total opportunities, win lost month, pipeline per employee. This is a completely editable PowerPoint presentation and is available for immediate download. Download now and impress your audience.
Ways To Design Impactful Trading Solution Sales Trend Analysis Ppt PowerPoint Presentation Icon Ideas PDF
Presenting this set of slides with name ways to design impactful trading solution sales trend analysis ppt powerpoint presentation icon ideas pdf. The topics discussed in these slides are sales pipeline, won and lost opportunities, revenue territory, sales product, forecasted, total opportunities, win lost month, pipeline per employee. This is a completely editable PowerPoint presentation and is available for immediate download. Download now and impress your audience.
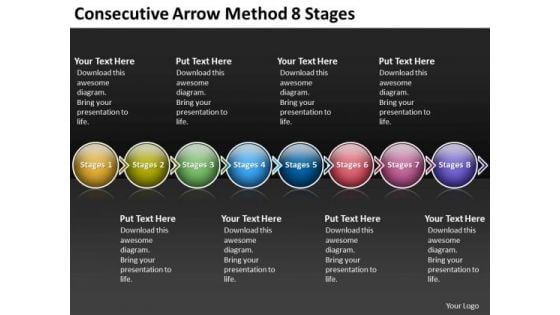
Consecutive Arrow Method 8 Stages Flowchart Creator PowerPoint Templates
We present our consecutive arrow method 8 stages flowchart creator PowerPoint templates. Use our Spheres PowerPoint Templates because, to take it along a sure fire road to good profit. Use our Arrows PowerPoint Templates because, the vision of being the market leader is clear to you. Use our Symbol PowerPoint Templates because; Blaze a brilliant trail from point to point. Use our Marketing PowerPoint Templates because; educate your listeners on the means to keep it ticking over. Use our Process and Flows PowerPoint Templates because; Lead the way to spread good cheer to one and all. Use these PowerPoint slides for presentations relating to Account, Arrow, Arrows, Away, Box, Business, Chart, Choice, Choose, Concept, Concepts, Consultation, Corporate, Design, Diagram, Direction, Elements, Flow, Follow, Follows, Future, Group, Grow, Increase, Lines, Many, Month, Move, Past, Period, Phase, Project, Report, Rise, Row, Step, Success, Spheres, Text, Time, Timeline, Today, Up, Way, Ways, Work, Year. The prominent colors used in the PowerPoint template are Blue, Red, and Purple Our Consecutive Arrow Method 8 Stages Flowchart Creator PowerPoint Templates will advocate your thoughts. The audience will become your ardent fans.
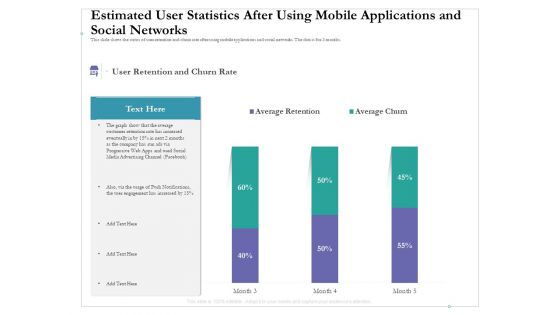
Estimated User Statistics After Using Mobile Applications And Social Networks Elements PDF
This slide shows the status of user retention and churn rate after using mobile applications and social networks. The data is for 3 months. Deliver and pitch your topic in the best possible manner with this estimated user statistics after using mobile applications and social networks elements pdf. Use them to share invaluable insights on user retention churn rate, estimated user statistics after using mobile applications and social networks and impress your audience. This template can be altered and modified as per your expectations. So, grab it now.
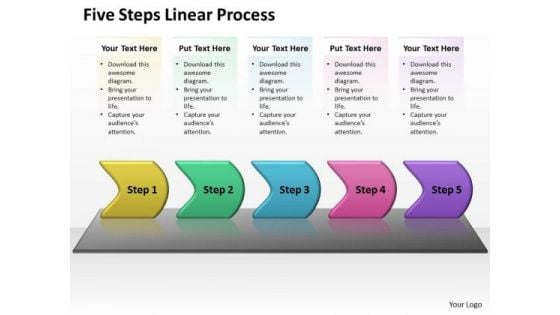
Usa Ppt Theme Five Steps Working With Slide Numbers Linear Process 1 Design
USA PPT Theme five steps working with slide numbers linear process 1 design-This image has been professionally designed to emphasize the paths through which the data moves, and the processes that produce, use, and transform data. Deliver amazing presentations to mesmerize your audience.-USA PPT Theme five steps working with slide numbers linear process 1 design-Account, Arrow, Arrows, Away, Box, Business, Chart, Choice, Choose, Concept, Concepts, Consultation, Corporate, Design, Diagram, Direction, Elements, Flow, Follow, Follows, Future, Group, Grow, Increase, Lines, Many, Month, Move, Past, Period, Phase, Project, Report, Rise, Row, Step, Success Create an alliance that will endure for ages. Our Usa Ppt Theme Five Steps Working With Slide Numbers Linear Process 1 Design will abide with you.
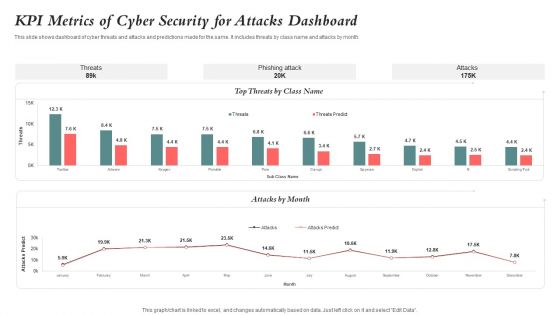
KPI Metrics Of Cyber Security For Attacks Dashboard Guidelines PDF
This slide shows dashboard of cyber threats and attacks and predictions made for the same. It includes threats by class name and attacks by month. Showcasing this set of slides titled KPI Metrics Of Cyber Security For Attacks Dashboard Guidelines PDF. The topics addressed in these templates are Kpi Metrics, Cyber Security, Attacks Dashboard. All the content presented in this PPT design is completely editable. Download it and make adjustments in color, background, font etc. as per your unique business setting.
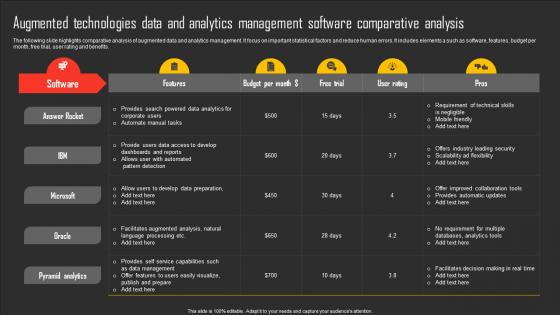
Augmented Technologies Data And Analytics Management Software Comparative Analysis Formats Pdf
The following slide highlights comparative analysis of augmented data and analytics management. It focus on important statistical factors and reduce human errors. It includes elements a such as software, features, budget per month, free trial, user rating and benefits. Showcasing this set of slides titled Augmented Technologies Data And Analytics Management Software Comparative Analysis Formats Pdf. The topics addressed in these templates are Answer Rocket, Microsoft, Pyramid Analytics . All the content presented in this PPT design is completely editable. Download it and make adjustments in color, background, font etc. as per your unique business setting. The following slide highlights comparative analysis of augmented data and analytics management. It focus on important statistical factors and reduce human errors. It includes elements a such as software, features, budget per month, free trial, user rating and benefits.
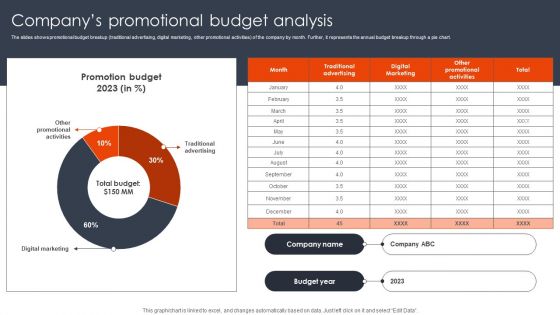
Companys Promotional Budget Analysis Client Acquisition Techniques To Boost Sales Guidelines PDF
The slides shows promotional budget breakup traditional advertising, digital marketing, other promotional activities of the company by month. Further, it represents the annual budget breakup through a pie chart. Boost your pitch with our creative Companys Promotional Budget Analysis Client Acquisition Techniques To Boost Sales Guidelines PDF. Deliver an awe-inspiring pitch that will mesmerize everyone. Using these presentation templates you will surely catch everyones attention. You can browse the ppts collection on our website. We have researchers who are experts at creating the right content for the templates. So you do not have to invest time in any additional work. Just grab the template now and use them.
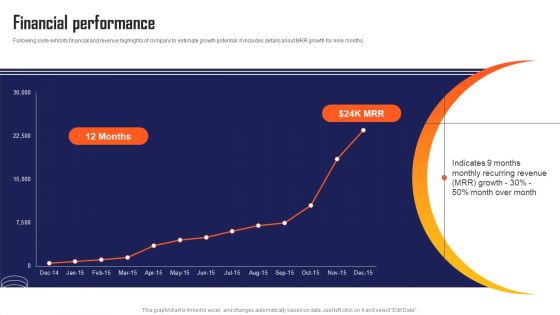
Marketing Automation App Fundraising Pitch Deck Financial Performance Download PDF
Following slide exhibits financial and revenue highlights of company to estimate growth potential. It includes details about MRR growth for nine months. There are so many reasons you need a Marketing Automation App Fundraising Pitch Deck Financial Performance Download PDF. The first reason is you cannot spend time making everything from scratch, Thus, Slidegeeks has made presentation templates for you too. You can easily download these templates from our website easily.
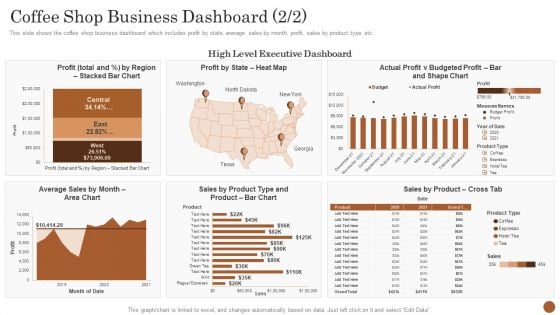
Business Model Opening Restaurant Coffee Shop Business Dashboard Inspiration PDF
This slide shows the coffee shop business dashboard which includes profit by state, average sales by month, profit, sales by product type, etc. Deliver and pitch your topic in the best possible manner with this business model opening restaurant coffee shop business dashboard inspiration pdf. Use them to share invaluable insights on profit v budgeted, average sales, sales by product and impress your audience. This template can be altered and modified as per your expectations. So, grab it now.
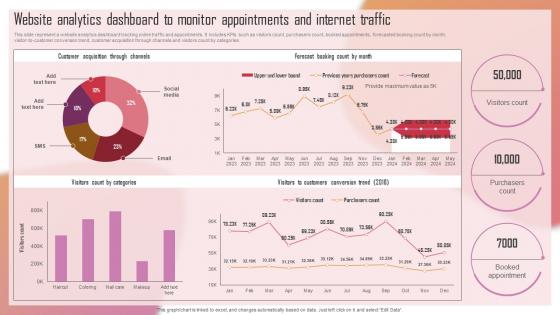
Customizing The Salon Experience Website Analytics Dashboard To Monitor Appointments Strategy SS V
This slide represent a website analytics dashboard tracking online traffic and appointments. It includes KPIs such as visitors count, purchasers count, booked appointments, forecasted booking count by month, visitor-to-customer conversion trend, customer acquisition through channels and visitors count by categories. Retrieve professionally designed Customizing The Salon Experience Website Analytics Dashboard To Monitor Appointments Strategy SS V to effectively convey your message and captivate your listeners. Save time by selecting pre-made slideshows that are appropriate for various topics, from business to educational purposes. These themes come in many different styles, from creative to corporate, and all of them are easily adjustable and can be edited quickly. Access them as PowerPoint templates or as Google Slides themes. You do not have to go on a hunt for the perfect presentation because Slidegeeks got you covered from everywhere. This slide represent a website analytics dashboard tracking online traffic and appointments. It includes KPIs such as visitors count, purchasers count, booked appointments, forecasted booking count by month, visitor-to-customer conversion trend, customer acquisition through channels and visitors count by categories.

Sales Department Strategies Increase Revenues Embracing Technology To Improve Sales Pictures PDF
The sales department will optimize its operations by embracing technology in terms of advanced sales analytics, customer insights, predictive analytics, etc. This slide provides information regarding at what extent the firm using the mentioned technologies and how much it will upgrade in upcoming months. Deliver an awe-inspiring pitch with this creative sales department strategies increase revenues embracing technology to improve sales pictures pdf bundle. Topics like embracing technology to improve sales can be discussed with this completely editable template. It is available for immediate download depending on the needs and requirements of the user.


 Continue with Email

 Home
Home


