Monthly Schedule
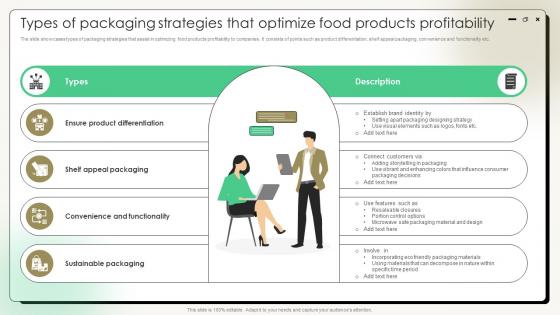
Comprehensive Guide On Current Strategies Types Of Packaging Strategies That Optimize Food Products
The slide showcases types of packaging strategies that assist in optimizing food products profitability to companies. It consists of points such as product differentiation, shelf appeal packaging, convenience and functionality etc. Whether you have daily or monthly meetings, a brilliant presentation is necessary. Comprehensive Guide On Current Strategies Types Of Packaging Strategies That Optimize Food Products can be your best option for delivering a presentation. Represent everything in detail using Comprehensive Guide On Current Strategies Types Of Packaging Strategies That Optimize Food Products and make yourself stand out in meetings. The template is versatile and follows a structure that will cater to your requirements. All the templates prepared by Slidegeeks are easy to download and edit. Our research experts have taken care of the corporate themes as well. So, give it a try and see the results. The slide showcases types of packaging strategies that assist in optimizing food products profitability to companies. It consists of points such as product differentiation, shelf appeal packaging, convenience and functionality etc.
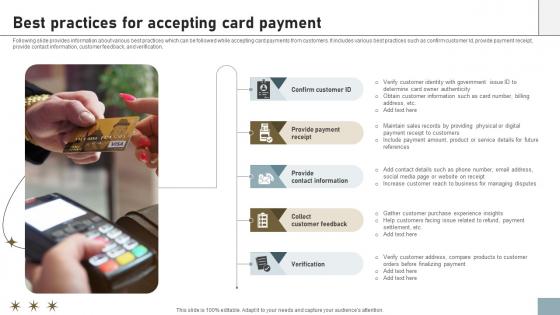
Online Payment Techniques Best Practices For Accepting Card Payment
Following slide provides information about various best practices which can be followed while accepting card payments from customers. It includes various best practices such as confirm customer Id, provide payment receipt, provide contact information, customer feedback, and verification. Whether you have daily or monthly meetings, a brilliant presentation is necessary. Online Payment Techniques Best Practices For Accepting Card Payment can be your best option for delivering a presentation. Represent everything in detail using Online Payment Techniques Best Practices For Accepting Card Payment and make yourself stand out in meetings. The template is versatile and follows a structure that will cater to your requirements. All the templates prepared by Slidegeeks are easy to download and edit. Our research experts have taken care of the corporate themes as well. So, give it a try and see the results. Following slide provides information about various best practices which can be followed while accepting card payments from customers. It includes various best practices such as confirm customer Id, provide payment receipt, provide contact information, customer feedback, and verification.
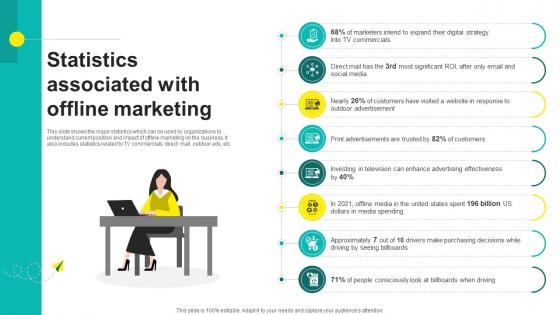
One On One Advertising Statistics Associated With Offline Marketing Strategy SS V
This slide shows the major statistics which can be used by organizations to understand current position and impact of offline marketing on the business. It also includes statistics related to TV commercials, direct mail, outdoor ads, etc. Whether you have daily or monthly meetings, a brilliant presentation is necessary. One On One Advertising Statistics Associated With Offline Marketing Strategy SS V can be your best option for delivering a presentation. Represent everything in detail using One On One Advertising Statistics Associated With Offline Marketing Strategy SS V and make yourself stand out in meetings. The template is versatile and follows a structure that will cater to your requirements. All the templates prepared by Slidegeeks are easy to download and edit. Our research experts have taken care of the corporate themes as well. So, give it a try and see the results. This slide shows the major statistics which can be used by organizations to understand current position and impact of offline marketing on the business. It also includes statistics related to TV commercials, direct mail, outdoor ads, etc.
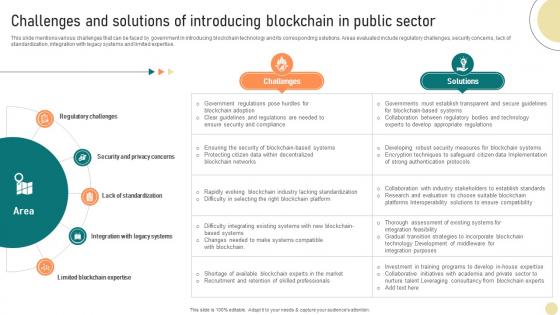
Visionary Guide To Blockchain Challenges And Solutions Of Introducing Blockchain BCT SS V
This slide mentions various challenges that can be faced by government in introducing blockchain technology and its corresponding solutions. Areas evaluated include regulatory challenges, security concerns, lack of standardization, integration with legacy systems and limited expertise. Whether you have daily or monthly meetings, a brilliant presentation is necessary. Visionary Guide To Blockchain Challenges And Solutions Of Introducing Blockchain BCT SS V can be your best option for delivering a presentation. Represent everything in detail using Visionary Guide To Blockchain Challenges And Solutions Of Introducing Blockchain BCT SS V and make yourself stand out in meetings. The template is versatile and follows a structure that will cater to your requirements. All the templates prepared by Slidegeeks are easy to download and edit. Our research experts have taken care of the corporate themes as well. So, give it a try and see the results. This slide mentions various challenges that can be faced by government in introducing blockchain technology and its corresponding solutions. Areas evaluated include regulatory challenges, security concerns, lack of standardization, integration with legacy systems and limited expertise.
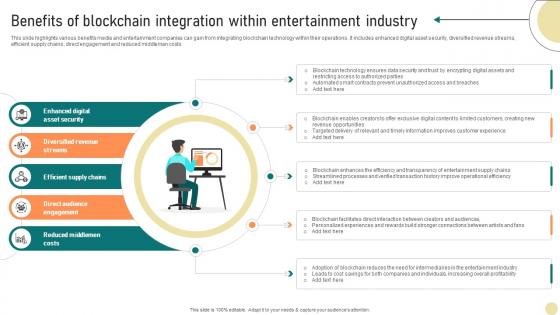
Visionary Guide To Blockchain Technologys Benefits Of Blockchain Integration BCT SS V
This slide highlights various benefits media and entertainment companies can gain from integrating blockchain technology within their operations. It includes enhanced digital asset security, diversified revenue streams, efficient supply chains, direct engagement and reduced middleman costs. Whether you have daily or monthly meetings, a brilliant presentation is necessary. Visionary Guide To Blockchain Technologys Benefits Of Blockchain Integration BCT SS V can be your best option for delivering a presentation. Represent everything in detail using Visionary Guide To Blockchain Technologys Benefits Of Blockchain Integration BCT SS V and make yourself stand out in meetings. The template is versatile and follows a structure that will cater to your requirements. All the templates prepared by Slidegeeks are easy to download and edit. Our research experts have taken care of the corporate themes as well. So, give it a try and see the results. This slide highlights various benefits media and entertainment companies can gain from integrating blockchain technology within their operations. It includes enhanced digital asset security, diversified revenue streams, efficient supply chains, direct engagement and reduced middleman costs.
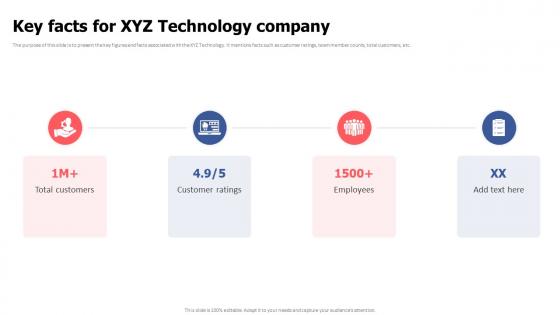
Key Facts For XYZ Technology Company Video Game Financing Pitch Deck
The purpose of this slide is to present the key figures and facts associated with the XYZ Technology. It mentions facts such as customer ratings, team member counts, total customers, etc. Whether you have daily or monthly meetings, a brilliant presentation is necessary. Key Facts For XYZ Technology Company Video Game Financing Pitch Deck can be your best option for delivering a presentation. Represent everything in detail using Key Facts For XYZ Technology Company Video Game Financing Pitch Deck and make yourself stand out in meetings. The template is versatile and follows a structure that will cater to your requirements. All the templates prepared by Slidegeeks are easy to download and edit. Our research experts have taken care of the corporate themes as well. So, give it a try and see the results. The purpose of this slide is to present the key figures and facts associated with the XYZ Technology. It mentions facts such as customer ratings, team member counts, total customers, etc.
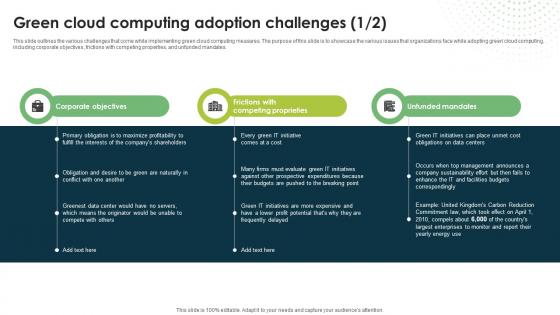
Green Cloud Computing Adoption Challenges Eco Friendly Computing IT
This slide outlines the various challenges that come while implementing green cloud computing measures. The purpose of this slide is to showcase the various issues that organizations face while adopting green cloud computing, including corporate objectives, frictions with competing properties, and unfunded mandates.Whether you have daily or monthly meetings, a brilliant presentation is necessary. Green Cloud Computing Adoption Challenges Eco Friendly Computing IT can be your best option for delivering a presentation. Represent everything in detail using Green Cloud Computing Adoption Challenges Eco Friendly Computing IT and make yourself stand out in meetings. The template is versatile and follows a structure that will cater to your requirements. All the templates prepared by Slidegeeks are easy to download and edit. Our research experts have taken care of the corporate themes as well. So, give it a try and see the results. This slide outlines the various challenges that come while implementing green cloud computing measures. The purpose of this slide is to showcase the various issues that organizations face while adopting green cloud computing, including corporate objectives, frictions with competing properties, and unfunded mandates.
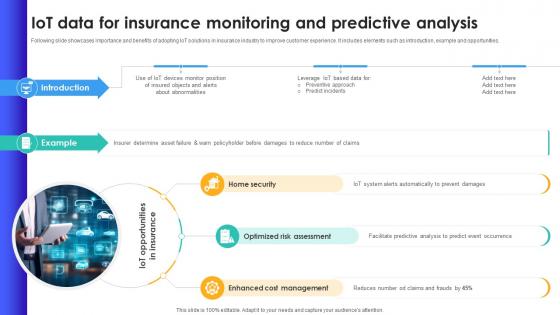
IoT Data For Insurance Monitoring And Predictive Analysis IoT In Banking For Digital Future IoT SS V
Following slide showcases importance and benefits of adopting IoT solutions in insurance industry to improve customer experience. It includes elements such as introduction, example and opportunities. Whether you have daily or monthly meetings, a brilliant presentation is necessary. IoT Data For Insurance Monitoring And Predictive Analysis IoT In Banking For Digital Future IoT SS V can be your best option for delivering a presentation. Represent everything in detail using IoT Data For Insurance Monitoring And Predictive Analysis IoT In Banking For Digital Future IoT SS V and make yourself stand out in meetings. The template is versatile and follows a structure that will cater to your requirements. All the templates prepared by Slidegeeks are easy to download and edit. Our research experts have taken care of the corporate themes as well. So, give it a try and see the results. Following slide showcases importance and benefits of adopting IoT solutions in insurance industry to improve customer experience. It includes elements such as introduction, example and opportunities.
Dust Prompt Engineering IDE Platform Crafting Interactions A Guide AI SS V
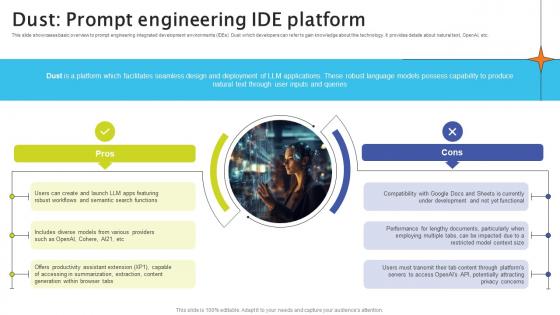
This slide showcases basic overview to prompt engineering integrated development environments IDEs Dust which developers can refer to gain knowledge about this technology. It provides details about natural text, OpenAI, etc. Whether you have daily or monthly meetings, a brilliant presentation is necessary. Dust Prompt Engineering IDE Platform Crafting Interactions A Guide AI SS V can be your best option for delivering a presentation. Represent everything in detail using Dust Prompt Engineering IDE Platform Crafting Interactions A Guide AI SS V and make yourself stand out in meetings. The template is versatile and follows a structure that will cater to your requirements. All the templates prepared by Slidegeeks are easy to download and edit. Our research experts have taken care of the corporate themes as well. So, give it a try and see the results. This slide showcases basic overview to prompt engineering integrated development environments IDEs Dust which developers can refer to gain knowledge about this technology. It provides details about natural text, OpenAI, etc.

Various Components Of Anti Money Laundering Mapping Out The Anti Money Fin SS V
The following slide illustrates the key components of the AML system that form the basics of its working. The various factors are KYC policies, transaction monitoring, risk assessment, compliance and auditing, etc. Whether you have daily or monthly meetings, a brilliant presentation is necessary. Various Components Of Anti Money Laundering Mapping Out The Anti Money Fin SS V can be your best option for delivering a presentation. Represent everything in detail using Various Components Of Anti Money Laundering Mapping Out The Anti Money Fin SS V and make yourself stand out in meetings. The template is versatile and follows a structure that will cater to your requirements. All the templates prepared by Slidegeeks are easy to download and edit. Our research experts have taken care of the corporate themes as well. So, give it a try and see the results. The following slide illustrates the key components of the AML system that form the basics of its working. The various factors are KYC policies, transaction monitoring, risk assessment, compliance and auditing, etc.
Brand Authority Case Study What Makes Coco Cola A Market Leader Strategy SS V
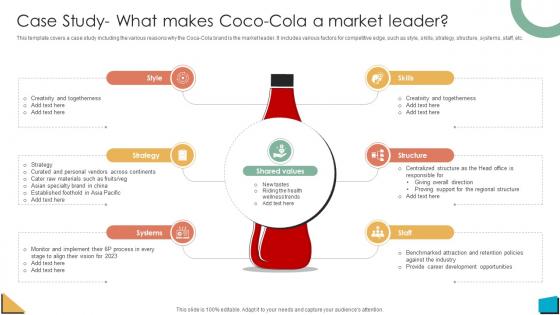
This template covers a case study including the various reasons why the Coca-Cola brand is the market leader. It includes various factors for competitive edge, such as style, skills, strategy, structure, systems, staff, etc. Whether you have daily or monthly meetings, a brilliant presentation is necessary. Brand Authority Case Study What Makes Coco Cola A Market Leader Strategy SS V can be your best option for delivering a presentation. Represent everything in detail using Brand Authority Case Study What Makes Coco Cola A Market Leader Strategy SS V and make yourself stand out in meetings. The template is versatile and follows a structure that will cater to your requirements. All the templates prepared by Slidegeeks are easy to download and edit. Our research experts have taken care of the corporate themes as well. So, give it a try and see the results. This template covers a case study including the various reasons why the Coca-Cola brand is the market leader. It includes various factors for competitive edge, such as style, skills, strategy, structure, systems, staff, etc.
Student Credit Cards For Young Individuals Swipe Smartly A Practical Guide Fin SS V
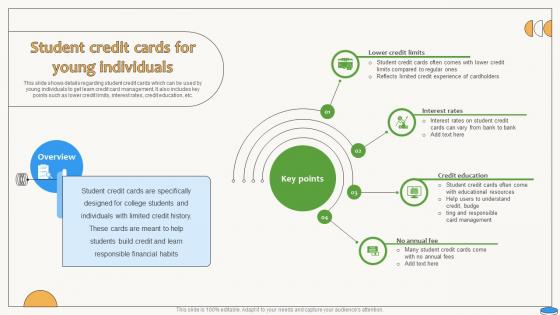
This slide shows details regarding student credit cards which can be used by young individuals to get learn credit card management. It also includes key points such as lower credit limits, interest rates, credit education, etc. Whether you have daily or monthly meetings, a brilliant presentation is necessary. Student Credit Cards For Young Individuals Swipe Smartly A Practical Guide Fin SS V can be your best option for delivering a presentation. Represent everything in detail using Student Credit Cards For Young Individuals Swipe Smartly A Practical Guide Fin SS V and make yourself stand out in meetings. The template is versatile and follows a structure that will cater to your requirements. All the templates prepared by Slidegeeks are easy to download and edit. Our research experts have taken care of the corporate themes as well. So, give it a try and see the results. This slide shows details regarding student credit cards which can be used by young individuals to get learn credit card management. It also includes key points such as lower credit limits, interest rates, credit education, etc.
Global Finance Industry Growth Drivers Strategy For Launching A Financial Strategy SS V
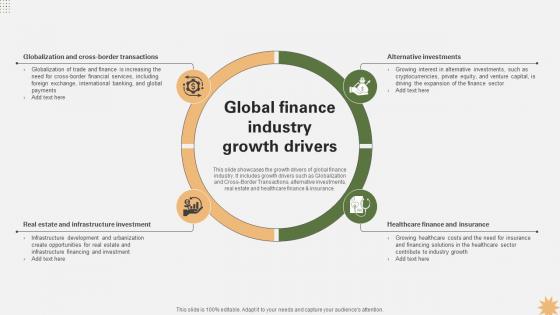
This slide showcases the growth drivers of global finance industry. It includes growth drivers such as Globalization and Cross-Border Transactions, alternative investments, real estate and healthcare finance and insurance. Whether you have daily or monthly meetings, a brilliant presentation is necessary. Global Finance Industry Growth Drivers Strategy For Launching A Financial Strategy SS V can be your best option for delivering a presentation. Represent everything in detail using Global Finance Industry Growth Drivers Strategy For Launching A Financial Strategy SS V and make yourself stand out in meetings. The template is versatile and follows a structure that will cater to your requirements. All the templates prepared by Slidegeeks are easy to download and edit. Our research experts have taken care of the corporate themes as well. So, give it a try and see the results. This slide showcases the growth drivers of global finance industry. It includes growth drivers such as Globalization and Cross-Border Transactions, alternative investments, real estate and healthcare finance and insurance.
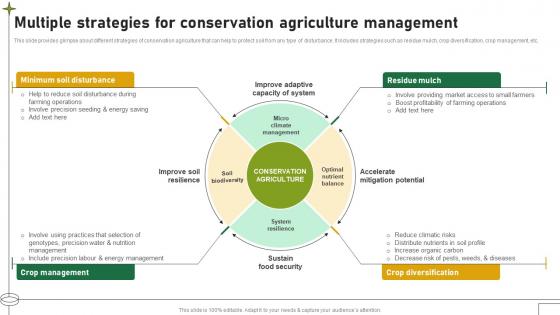
Multiple Strategies For Conservation Agriculture Management Adopting Sustainable Farming Techniques
This slide provides glimpse about different strategies of conservation agriculture that can help to protect soil from any type of disturbance. It includes strategies such as residue mulch, crop diversification, crop management, etc. Whether you have daily or monthly meetings, a brilliant presentation is necessary. Multiple Strategies For Conservation Agriculture Management Adopting Sustainable Farming Techniques can be your best option for delivering a presentation. Represent everything in detail using Multiple Strategies For Conservation Agriculture Management Adopting Sustainable Farming Techniques and make yourself stand out in meetings. The template is versatile and follows a structure that will cater to your requirements. All the templates prepared by Slidegeeks are easy to download and edit. Our research experts have taken care of the corporate themes as well. So, give it a try and see the results. This slide provides glimpse about different strategies of conservation agriculture that can help to protect soil from any type of disturbance. It includes strategies such as residue mulch, crop diversification, crop management, etc.
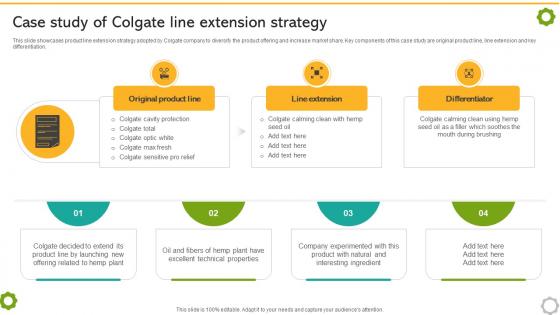
Related And Unrelated Business Case Study Of Colgate Line Extension Strategy SS V
This slide showcases product line extension strategy adopted by Colgate company to diversify the product offering and increase market share. Key components of this case study are original product line, line extension and key differentiation. Whether you have daily or monthly meetings, a brilliant presentation is necessary. Related And Unrelated Business Case Study Of Colgate Line Extension Strategy SS V can be your best option for delivering a presentation. Represent everything in detail using Related And Unrelated Business Case Study Of Colgate Line Extension Strategy SS V and make yourself stand out in meetings. The template is versatile and follows a structure that will cater to your requirements. All the templates prepared by Slidegeeks are easy to download and edit. Our research experts have taken care of the corporate themes as well. So, give it a try and see the results. This slide showcases product line extension strategy adopted by Colgate company to diversify the product offering and increase market share. Key components of this case study are original product line, line extension and key differentiation.
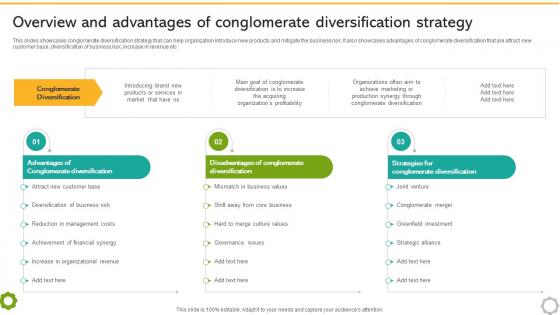
Related And Unrelated Overview And Advantages Of Conglomerate Diversification Strategy SS V
This slides showcases conglomerate diversification strategy that can help organization introduce new products and mitigate the business risk. It also showcases advantages of conglomerate diversification that are attract new customer base, diversification of business risk, increase in revenue etc. Whether you have daily or monthly meetings, a brilliant presentation is necessary. Related And Unrelated Overview And Advantages Of Conglomerate Diversification Strategy SS V can be your best option for delivering a presentation. Represent everything in detail using Related And Unrelated Overview And Advantages Of Conglomerate Diversification Strategy SS V and make yourself stand out in meetings. The template is versatile and follows a structure that will cater to your requirements. All the templates prepared by Slidegeeks are easy to download and edit. Our research experts have taken care of the corporate themes as well. So, give it a try and see the results. This slides showcases conglomerate diversification strategy that can help organization introduce new products and mitigate the business risk. It also showcases advantages of conglomerate diversification that are attract new customer base, diversification of business risk, increase in revenue etc.
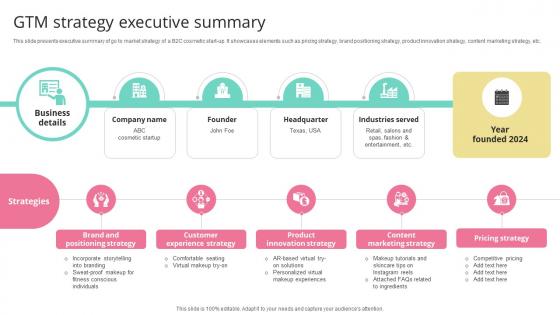
GTM Strategy Executive Summary Skincare Startup GTM Strategy GTM SS V
This slide presents executive summary of go to market strategy of a B2C cosmetic start-up. It showcases elements such as pricing strategy, brand positioning strategy, product innovation strategy, content marketing strategy, etc.Whether you have daily or monthly meetings, a brilliant presentation is necessary. GTM Strategy Executive Summary Skincare Startup GTM Strategy GTM SS V can be your best option for delivering a presentation. Represent everything in detail using GTM Strategy Executive Summary Skincare Startup GTM Strategy GTM SS V and make yourself stand out in meetings. The template is versatile and follows a structure that will cater to your requirements. All the templates prepared by Slidegeeks are easy to download and edit. Our research experts have taken care of the corporate themes as well. So, give it a try and see the results. This slide presents executive summary of go to market strategy of a B2C cosmetic start-up. It showcases elements such as pricing strategy, brand positioning strategy, product innovation strategy, content marketing strategy, etc.

Complete Beginners Guide Comparison Matrix Of Top Cryptocurrency Exchanges Fin SS V
This slide shows details about popular cryptocurrency exchanges available in market which can be used to select the most suitable platform for trading Bitcoin. It includes features and cons of exchanges Whether you have daily or monthly meetings, a brilliant presentation is necessary. Complete Beginners Guide Comparison Matrix Of Top Cryptocurrency Exchanges Fin SS V can be your best option for delivering a presentation. Represent everything in detail using Complete Beginners Guide Comparison Matrix Of Top Cryptocurrency Exchanges Fin SS V and make yourself stand out in meetings. The template is versatile and follows a structure that will cater to your requirements. All the templates prepared by Slidegeeks are easy to download and edit. Our research experts have taken care of the corporate themes as well. So, give it a try and see the results. This slide shows details about popular cryptocurrency exchanges available in market which can be used to select the most suitable platform for trading Bitcoin. It includes features and cons of exchanges
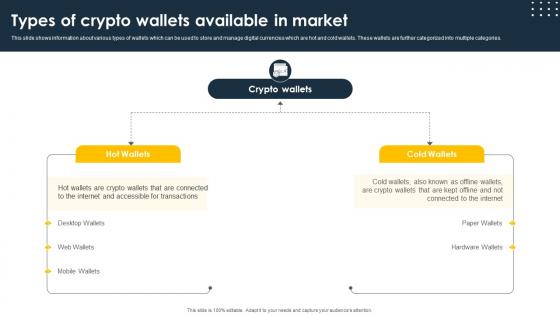
Complete Beginners Guide Types Of Crypto Wallets Available In Market Fin SS V
This slide shows information about various types of wallets which can be used to store and manage digital currencies which are hot and cold wallets. These wallets are further categorized into multiple categories. Whether you have daily or monthly meetings, a brilliant presentation is necessary. Complete Beginners Guide Types Of Crypto Wallets Available In Market Fin SS V can be your best option for delivering a presentation. Represent everything in detail using Complete Beginners Guide Types Of Crypto Wallets Available In Market Fin SS V and make yourself stand out in meetings. The template is versatile and follows a structure that will cater to your requirements. All the templates prepared by Slidegeeks are easy to download and edit. Our research experts have taken care of the corporate themes as well. So, give it a try and see the results. This slide shows information about various types of wallets which can be used to store and manage digital currencies which are hot and cold wallets. These wallets are further categorized into multiple categories.

Global Telemedicine Market Share By Geography Remote Healthcare Services IR SS V
This slide represents the geographical segmentation of Telemedicine industry which includes North America, Europe, Asia-Pacific, Latin America and Middle East and Africa, where the fastest growing region is North America. Whether you have daily or monthly meetings, a brilliant presentation is necessary. Global Telemedicine Market Share By Geography Remote Healthcare Services IR SS V can be your best option for delivering a presentation. Represent everything in detail using Global Telemedicine Market Share By Geography Remote Healthcare Services IR SS V and make yourself stand out in meetings. The template is versatile and follows a structure that will cater to your requirements. All the templates prepared by Slidegeeks are easy to download and edit. Our research experts have taken care of the corporate themes as well. So, give it a try and see the results. This slide represents the geographical segmentation of Telemedicine industry which includes North America, Europe, Asia-Pacific, Latin America and Middle East and Africa, where the fastest growing region is North America.
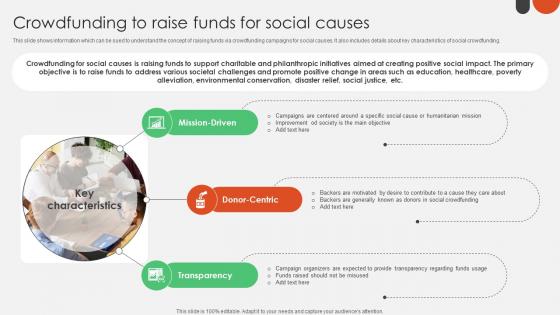
Crowdfunding To Raise Funds For Crowdfunding For Nonprofits To Support Fin SS V
This slide shows information which can be sued to understand the concept of raising funds via crowdfunding campaigns for social causes. It also includes details about key characteristics of social crowdfunding. Whether you have daily or monthly meetings, a brilliant presentation is necessary. Crowdfunding To Raise Funds For Crowdfunding For Nonprofits To Support Fin SS V can be your best option for delivering a presentation. Represent everything in detail using Crowdfunding To Raise Funds For Crowdfunding For Nonprofits To Support Fin SS V and make yourself stand out in meetings. The template is versatile and follows a structure that will cater to your requirements. All the templates prepared by Slidegeeks are easy to download and edit. Our research experts have taken care of the corporate themes as well. So, give it a try and see the results. This slide shows information which can be sued to understand the concept of raising funds via crowdfunding campaigns for social causes. It also includes details about key characteristics of social crowdfunding.

Strategies To Raise Funds For Startup Crowdfunding For Nonprofits To Support Fin SS V
This slide shows various strategies which can be used by startups to raise funds by conducting a crowdfunding campaign. These strategies includes pre campaign preparations, developing engaging story, organising launch event, etc. Whether you have daily or monthly meetings, a brilliant presentation is necessary. Strategies To Raise Funds For Startup Crowdfunding For Nonprofits To Support Fin SS V can be your best option for delivering a presentation. Represent everything in detail using Strategies To Raise Funds For Startup Crowdfunding For Nonprofits To Support Fin SS V and make yourself stand out in meetings. The template is versatile and follows a structure that will cater to your requirements. All the templates prepared by Slidegeeks are easy to download and edit. Our research experts have taken care of the corporate themes as well. So, give it a try and see the results. This slide shows various strategies which can be used by startups to raise funds by conducting a crowdfunding campaign. These strategies includes pre campaign preparations, developing engaging story, organising launch event, etc.
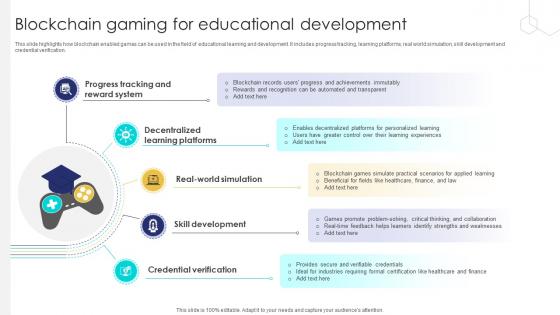
Unlocking The Potential Of Blockchain Gaming For Educational Development BCT SS V
This slide highlights how blockchain enabled games can be used in the field of educational learning and development. It includes progress tracking, learning platforms, real world simulation, skill development and credential verification. Whether you have daily or monthly meetings, a brilliant presentation is necessary. Unlocking The Potential Of Blockchain Gaming For Educational Development BCT SS V can be your best option for delivering a presentation. Represent everything in detail using Unlocking The Potential Of Blockchain Gaming For Educational Development BCT SS V and make yourself stand out in meetings. The template is versatile and follows a structure that will cater to your requirements. All the templates prepared by Slidegeeks are easy to download and edit. Our research experts have taken care of the corporate themes as well. So, give it a try and see the results. This slide highlights how blockchain enabled games can be used in the field of educational learning and development. It includes progress tracking, learning platforms, real world simulation, skill development and credential verification.
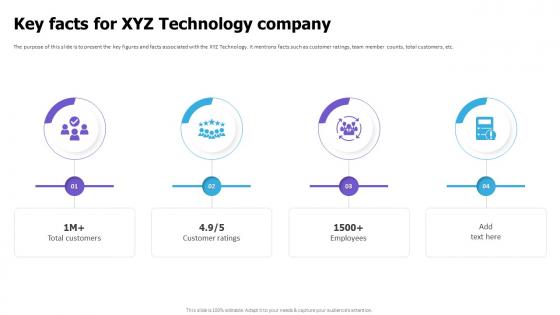
Key Facts For XYZ Technology Company Cloud Game Development Fundraising Pitch Deck
The purpose of this slide is to present the key figures and facts associated with the XYZ Technology. It mentions facts such as customer ratings, team member counts, total customers, etc. Whether you have daily or monthly meetings, a brilliant presentation is necessary. Key Facts For XYZ Technology Company Cloud Game Development Fundraising Pitch Deck can be your best option for delivering a presentation. Represent everything in detail using Key Facts For XYZ Technology Company Cloud Game Development Fundraising Pitch Deck and make yourself stand out in meetings. The template is versatile and follows a structure that will cater to your requirements. All the templates prepared by Slidegeeks are easy to download and edit. Our research experts have taken care of the corporate themes as well. So, give it a try and see the results. The purpose of this slide is to present the key figures and facts associated with the XYZ Technology. It mentions facts such as customer ratings, team member counts, total customers, etc.
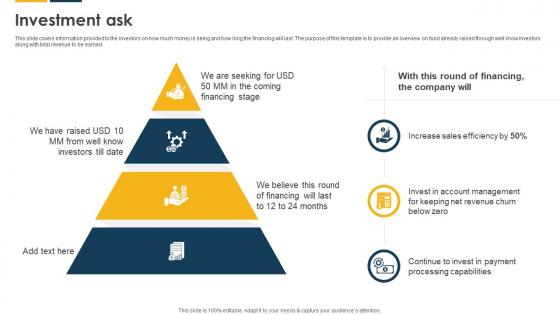
Investment Ask Payroll Solutions Provider Investor Funding Elevator Pitch Deck
This slide covers information provided to the investors on how much money is being and how long the financing will last. The purpose of this template is to provide an overview on fund already raised through well know investors along with total revenue to be earned. Whether you have daily or monthly meetings, a brilliant presentation is necessary. Investment Ask Payroll Solutions Provider Investor Funding Elevator Pitch Deck can be your best option for delivering a presentation. Represent everything in detail using Investment Ask Payroll Solutions Provider Investor Funding Elevator Pitch Deck and make yourself stand out in meetings. The template is versatile and follows a structure that will cater to your requirements. All the templates prepared by Slidegeeks are easy to download and edit. Our research experts have taken care of the corporate themes as well. So, give it a try and see the results. This slide covers information provided to the investors on how much money is being and how long the financing will last. The purpose of this template is to provide an overview on fund already raised through well know investors along with total revenue to be earned.
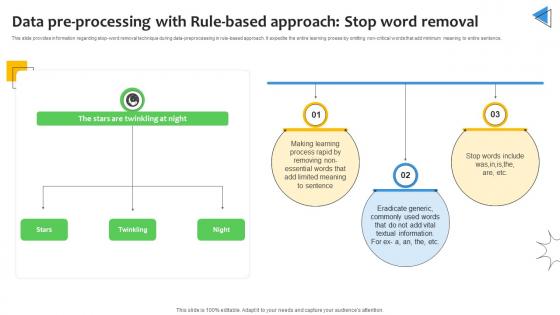
Data Pre Processing With Rule Based Approach Sentiment Analysis Demystified Understanding AI SS V
This slide provides information regarding stop-word removal technique during data-preprocessing in rule-based approach. It expedite the entire learning proess by omitting non-critical words that add minimum meaning to entire sentence. Whether you have daily or monthly meetings, a brilliant presentation is necessary. Data Pre Processing With Rule Based Approach Sentiment Analysis Demystified Understanding AI SS V can be your best option for delivering a presentation. Represent everything in detail using Data Pre Processing With Rule Based Approach Sentiment Analysis Demystified Understanding AI SS V and make yourself stand out in meetings. The template is versatile and follows a structure that will cater to your requirements. All the templates prepared by Slidegeeks are easy to download and edit. Our research experts have taken care of the corporate themes as well. So, give it a try and see the results. This slide provides information regarding stop-word removal technique during data-preprocessing in rule-based approach. It expedite the entire learning proess by omitting non-critical words that add minimum meaning to entire sentence.

Challenges Of Implementing MLOPs In Business And Their Solution Introduction To MLOPs IT
This slide discusses the common challenges businesses face when implementing MLOps practices and their potential solutions, such as Lack of standardization in ML workflows, Difficulty in managing data versioning, etc. Whether you have daily or monthly meetings, a brilliant presentation is necessary. Challenges Of Implementing MLOPs In Business And Their Solution Introduction To MLOPs IT can be your best option for delivering a presentation. Represent everything in detail using Challenges Of Implementing MLOPs In Business And Their Solution Introduction To MLOPs IT and make yourself stand out in meetings. The template is versatile and follows a structure that will cater to your requirements. All the templates prepared by Slidegeeks are easy to download and edit. Our research experts have taken care of the corporate themes as well. So, give it a try and see the results. This slide discusses the common challenges businesses face when implementing MLOps practices and their potential solutions, such as Lack of standardization in ML workflows, Difficulty in managing data versioning, etc.
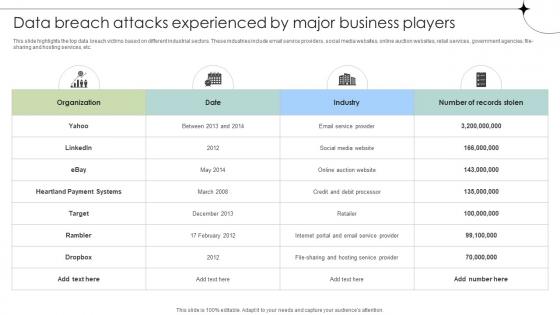
Data Breach Attacks Experienced By Major Business Players Data Fortification Strengthening Defenses
This slide highlights the top data breach victims based on different industrial sectors. These industries include email service providers, social media websites, online auction websites, retail services, government agencies, file-sharing and hosting services, etc. Whether you have daily or monthly meetings, a brilliant presentation is necessary. Data Breach Attacks Experienced By Major Business Players Data Fortification Strengthening Defenses can be your best option for delivering a presentation. Represent everything in detail using Data Breach Attacks Experienced By Major Business Players Data Fortification Strengthening Defenses and make yourself stand out in meetings. The template is versatile and follows a structure that will cater to your requirements. All the templates prepared by Slidegeeks are easy to download and edit. Our research experts have taken care of the corporate themes as well. So, give it a try and see the results. This slide highlights the top data breach victims based on different industrial sectors. These industries include email service providers, social media websites, online auction websites, retail services, government agencies, file-sharing and hosting services, etc.
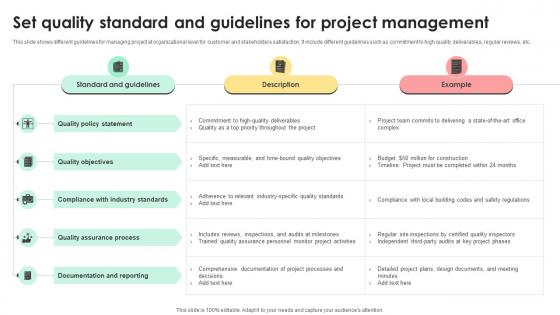
Administering Quality Assurance Set Quality Standard And Guidelines For Project Management PM SS V
This slide shows different guidelines for managing project at organizational level for customer and stakeholders satisfaction. It include different guidelines such as commitment to high quality deliverables, regular reviews, etc. Whether you have daily or monthly meetings, a brilliant presentation is necessary. Administering Quality Assurance Set Quality Standard And Guidelines For Project Management PM SS V can be your best option for delivering a presentation. Represent everything in detail using Administering Quality Assurance Set Quality Standard And Guidelines For Project Management PM SS V and make yourself stand out in meetings. The template is versatile and follows a structure that will cater to your requirements. All the templates prepared by Slidegeeks are easy to download and edit. Our research experts have taken care of the corporate themes as well. So, give it a try and see the results. This slide shows different guidelines for managing project at organizational level for customer and stakeholders satisfaction. It include different guidelines such as commitment to high quality deliverables, regular reviews, etc.

Global Data Security Industry Report Exploring Recent Developments In Cybersecurity Industry IR SS V
The slide highlights recent news and developments of major key players in the cybersecurity industry, enabling stakeholders to stay informed and make informed decisions. It covers developments related to acquisitions, collaborations, new product launches, and investments. Whether you have daily or monthly meetings, a brilliant presentation is necessary. Global Data Security Industry Report Exploring Recent Developments In Cybersecurity Industry IR SS V can be your best option for delivering a presentation. Represent everything in detail using Global Data Security Industry Report Exploring Recent Developments In Cybersecurity Industry IR SS V and make yourself stand out in meetings. The template is versatile and follows a structure that will cater to your requirements. All the templates prepared by Slidegeeks are easy to download and edit. Our research experts have taken care of the corporate themes as well. So, give it a try and see the results. The slide highlights recent news and developments of major key players in the cybersecurity industry, enabling stakeholders to stay informed and make informed decisions. It covers developments related to acquisitions, collaborations, new product launches, and investments.
Factors To Consider Before Designing Store Encouraging Repetitive Customer Purchase Ppt Example
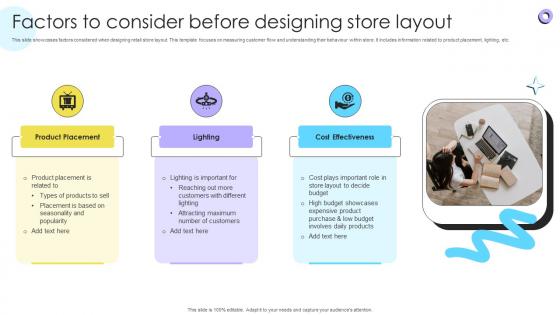
This slide showcases factors considered when designing retail store layout. This template focuses on measuring customer flow and understanding their behaviour within store. It includes information related to product placement, lighting, etc. Whether you have daily or monthly meetings, a brilliant presentation is necessary. Factors To Consider Before Designing Store Encouraging Repetitive Customer Purchase Ppt Example can be your best option for delivering a presentation. Represent everything in detail using Factors To Consider Before Designing Store Encouraging Repetitive Customer Purchase Ppt Example and make yourself stand out in meetings. The template is versatile and follows a structure that will cater to your requirements. All the templates prepared by Slidegeeks are easy to download and edit. Our research experts have taken care of the corporate themes as well. So, give it a try and see the results. This slide showcases factors considered when designing retail store layout. This template focuses on measuring customer flow and understanding their behaviour within store. It includes information related to product placement, lighting, etc.
ChatGpt Comprehensive Guide ChatGpt Overview For Sales And Marketing Ppt Presentation ChatGpt SS V
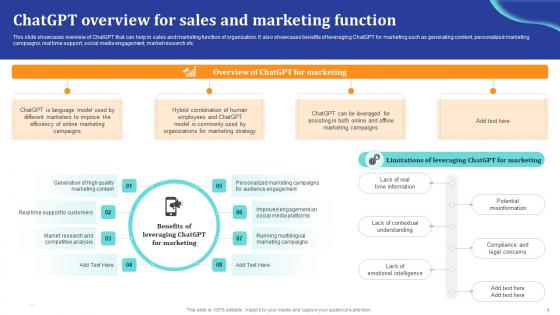
This slide showcases overview of ChatGPT that can help in sales and marketing function of organization. It also showcases benefits of leveraging ChatGPT for marketing such as generating content, personalized marketing campaigns, real time support, social media engagement, market research etc. Whether you have daily or monthly meetings, a brilliant presentation is necessary. ChatGpt Comprehensive Guide ChatGpt Overview For Sales And Marketing Ppt Presentation ChatGpt SS V can be your best option for delivering a presentation. Represent everything in detail using ChatGpt Comprehensive Guide ChatGpt Overview For Sales And Marketing Ppt Presentation ChatGpt SS V and make yourself stand out in meetings. The template is versatile and follows a structure that will cater to your requirements. All the templates prepared by Slidegeeks are easy to download and edit. Our research experts have taken care of the corporate themes as well. So, give it a try and see the results. This slide showcases overview of ChatGPT that can help in sales and marketing function of organization. It also showcases benefits of leveraging ChatGPT for marketing such as generating content, personalized marketing campaigns, real time support, social media engagement, market research etc.
Investment Ask Web Based Automated Tool Platform Pitch Deck Ppt Slides
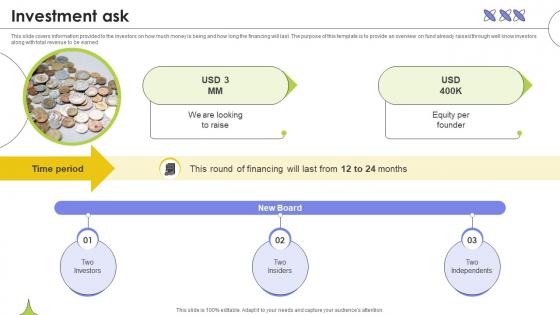
This slide covers information provided to the investors on how much money is being and how long the financing will last. The purpose of this template is to provide an overview on fund already raised through well know investors along with total revenue to be earned. Whether you have daily or monthly meetings, a brilliant presentation is necessary. Investment Ask Web Based Automated Tool Platform Pitch Deck Ppt Slides can be your best option for delivering a presentation. Represent everything in detail using Investment Ask Web Based Automated Tool Platform Pitch Deck Ppt Slides and make yourself stand out in meetings. The template is versatile and follows a structure that will cater to your requirements. All the templates prepared by Slidegeeks are easy to download and edit. Our research experts have taken care of the corporate themes as well. So, give it a try and see the results. This slide covers information provided to the investors on how much money is being and how long the financing will last. The purpose of this template is to provide an overview on fund already raised through well know investors along with total revenue to be earned.
Checklist To Start With Natura Automated Content Generation PPT PowerPoint
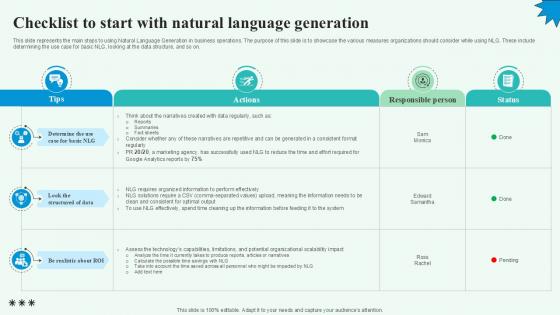
This slide represents the main steps to using Natural Language Generation in business operations. The purpose of this slide is to showcase the various measures organizations should consider while using NLG. These include determining the use case for basic NLG, looking at the data structure, and so on. Whether you have daily or monthly meetings, a brilliant presentation is necessary. Checklist To Start With Natura Automated Content Generation PPT PowerPoint can be your best option for delivering a presentation. Represent everything in detail using Checklist To Start With Natura Automated Content Generation PPT PowerPoint and make yourself stand out in meetings. The template is versatile and follows a structure that will cater to your requirements. All the templates prepared by Slidegeeks are easy to download and edit. Our research experts have taken care of the corporate themes as well. So, give it a try and see the results. This slide represents the main steps to using Natural Language Generation in business operations. The purpose of this slide is to showcase the various measures organizations should consider while using NLG. These include determining the use case for basic NLG, looking at the data structure, and so on.
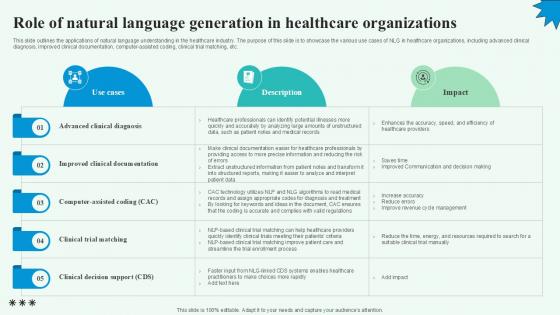
Role Of Natural Language Generation Automated Content Generation PPT Example
This slide outlines the applications of natural language understanding in the healthcare industry. The purpose of this slide is to showcase the various use cases of NLG in healthcare organizations, including advanced clinical diagnosis, improved clinical documentation, computer-assisted coding, clinical trial matching, etc. Whether you have daily or monthly meetings, a brilliant presentation is necessary. Role Of Natural Language Generation Automated Content Generation PPT Example can be your best option for delivering a presentation. Represent everything in detail using Role Of Natural Language Generation Automated Content Generation PPT Example and make yourself stand out in meetings. The template is versatile and follows a structure that will cater to your requirements. All the templates prepared by Slidegeeks are easy to download and edit. Our research experts have taken care of the corporate themes as well. So, give it a try and see the results. This slide outlines the applications of natural language understanding in the healthcare industry. The purpose of this slide is to showcase the various use cases of NLG in healthcare organizations, including advanced clinical diagnosis, improved clinical documentation, computer-assisted coding, clinical trial matching, etc.

Three Main Categories Of Cash Strategies To Develop Effective Ppt Example Fin SS V
This slide shows information which can be used to understand various types of cashflows. It includes operating, investing and financing cashflows. It also includes details about inflows and outflows. Whether you have daily or monthly meetings, a brilliant presentation is necessary. Three Main Categories Of Cash Strategies To Develop Effective Ppt Example Fin SS V can be your best option for delivering a presentation. Represent everything in detail using Three Main Categories Of Cash Strategies To Develop Effective Ppt Example Fin SS V and make yourself stand out in meetings. The template is versatile and follows a structure that will cater to your requirements. All the templates prepared by Slidegeeks are easy to download and edit. Our research experts have taken care of the corporate themes as well. So, give it a try and see the results. This slide shows information which can be used to understand various types of cashflows. It includes operating, investing and financing cashflows. It also includes details about inflows and outflows.
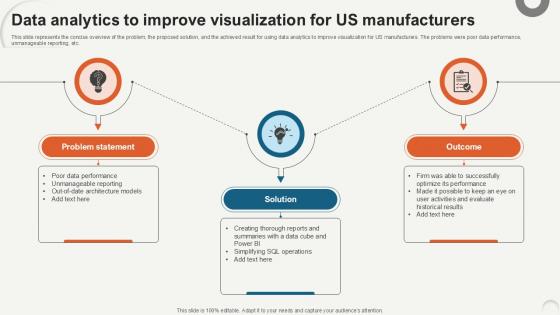
Data Analytics To Improve Visualization Data Analytics For Informed Decision Ppt PowerPoint
This slide represents the concise overview of the problem, the proposed solution, and the achieved result for using data analytics to improve visualization for US manufacturers. The problems were poor data performance, unmanageable reporting, etc. Whether you have daily or monthly meetings, a brilliant presentation is necessary. Data Analytics To Improve Visualization Data Analytics For Informed Decision Ppt PowerPoint can be your best option for delivering a presentation. Represent everything in detail using Data Analytics To Improve Visualization Data Analytics For Informed Decision Ppt PowerPoint and make yourself stand out in meetings. The template is versatile and follows a structure that will cater to your requirements. All the templates prepared by Slidegeeks are easy to download and edit. Our research experts have taken care of the corporate themes as well. So, give it a try and see the results. This slide represents the concise overview of the problem, the proposed solution, and the achieved result for using data analytics to improve visualization for US manufacturers. The problems were poor data performance, unmanageable reporting, etc.
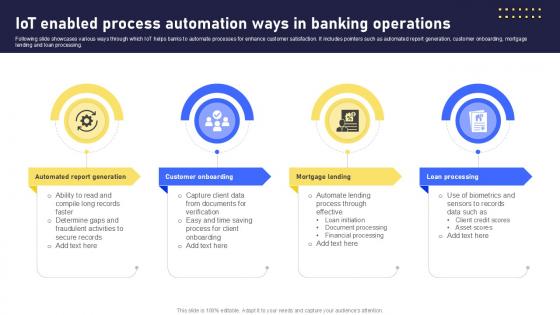
IoT Enabled Process Automation Banking Future With IoT Ppt Sample IoT SS V
Following slide showcases various ways through which IoT helps banks to automate processes for enhance customer satisfaction. It includes pointers such as automated report generation, customer onboarding, mortgage lending and loan processing. Whether you have daily or monthly meetings, a brilliant presentation is necessary. IoT Enabled Process Automation Banking Future With IoT Ppt Sample IoT SS V can be your best option for delivering a presentation. Represent everything in detail using IoT Enabled Process Automation Banking Future With IoT Ppt Sample IoT SS V and make yourself stand out in meetings. The template is versatile and follows a structure that will cater to your requirements. All the templates prepared by Slidegeeks are easy to download and edit. Our research experts have taken care of the corporate themes as well. So, give it a try and see the results. Following slide showcases various ways through which IoT helps banks to automate processes for enhance customer satisfaction. It includes pointers such as automated report generation, customer onboarding, mortgage lending and loan processing.
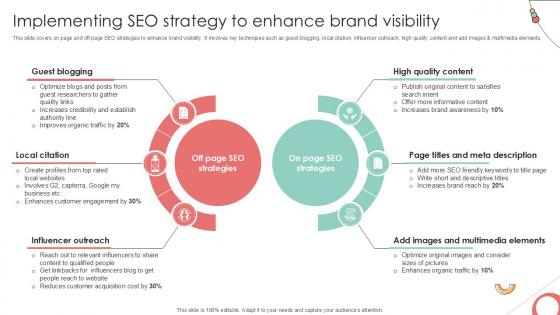
Implementing SEO Strategy To Implementing Product Diversification PPT Powerpoint Strategy SS V
This slide covers on page and off page SEO strategies to enhance brand visibility. It involves key techniques such as guest blogging, local citation, influencer outreach, high quality content and add images and multimedia elements. Whether you have daily or monthly meetings, a brilliant presentation is necessary. Implementing SEO Strategy To Implementing Product Diversification PPT Powerpoint Strategy SS V can be your best option for delivering a presentation. Represent everything in detail using Implementing SEO Strategy To Implementing Product Diversification PPT Powerpoint Strategy SS V and make yourself stand out in meetings. The template is versatile and follows a structure that will cater to your requirements. All the templates prepared by Slidegeeks are easy to download and edit. Our research experts have taken care of the corporate themes as well. So, give it a try and see the results. This slide covers on page and off page SEO strategies to enhance brand visibility. It involves key techniques such as guest blogging, local citation, influencer outreach, high quality content and add images and multimedia elements.
Evaluating Types Of Risk In Defense Industry Global Security Industry PPT Example IR SS V
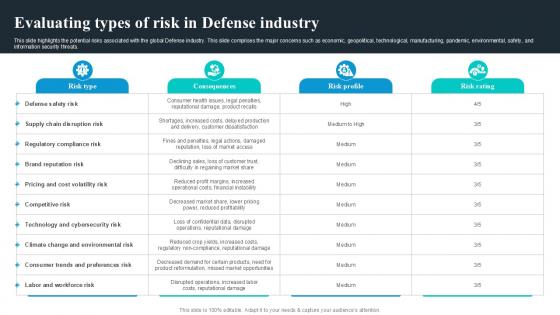
This slide highlights the potential risks associated with the global Defense industry. This slide comprises the major concerns such as economic, geopolitical, technological, manufacturing, pandemic, environmental, safety, and information security threats. Whether you have daily or monthly meetings, a brilliant presentation is necessary. Evaluating Types Of Risk In Defense Industry Global Security Industry PPT Example IR SS V can be your best option for delivering a presentation. Represent everything in detail using Evaluating Types Of Risk In Defense Industry Global Security Industry PPT Example IR SS V and make yourself stand out in meetings. The template is versatile and follows a structure that will cater to your requirements. All the templates prepared by Slidegeeks are easy to download and edit. Our research experts have taken care of the corporate themes as well. So, give it a try and see the results. This slide highlights the potential risks associated with the global Defense industry. This slide comprises the major concerns such as economic, geopolitical, technological, manufacturing, pandemic, environmental, safety, and information security threats.
Future Of Online And Mobile Initiating Globalization Of Banking Ppt Example
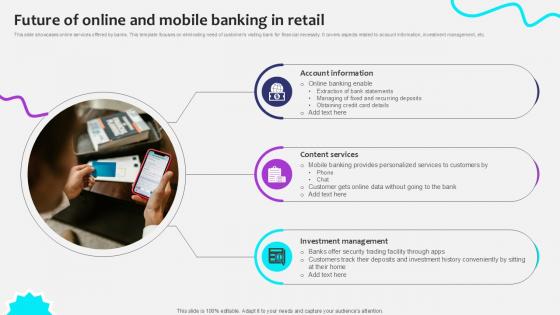
This slide showcases online services offered by banks. This template focuses on eliminating need of customers visiting bank for financial necessity. It covers aspects related to account information, investment management, etc. Whether you have daily or monthly meetings, a brilliant presentation is necessary. Future Of Online And Mobile Initiating Globalization Of Banking Ppt Example can be your best option for delivering a presentation. Represent everything in detail using Future Of Online And Mobile Initiating Globalization Of Banking Ppt Example and make yourself stand out in meetings. The template is versatile and follows a structure that will cater to your requirements. All the templates prepared by Slidegeeks are easy to download and edit. Our research experts have taken care of the corporate themes as well. So, give it a try and see the results. This slide showcases online services offered by banks. This template focuses on eliminating need of customers visiting bank for financial necessity. It covers aspects related to account information, investment management, etc.
Challenges And Solutions Of Content Automation With NLG AI Content Creation It Ppt Example
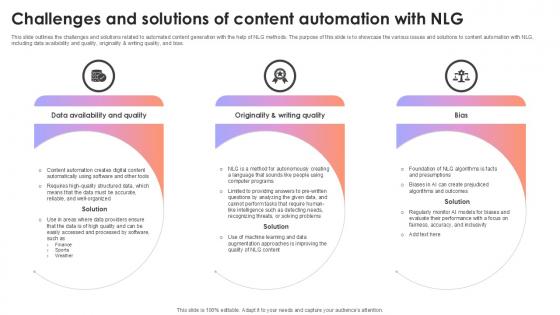
This slide outlines the challenges and solutions related to automated content generation with the help of NLG methods. The purpose of this slide is to showcase the various issues and solutions to content automation with NLG, including data availability and quality, originality and writing quality, and bias. Whether you have daily or monthly meetings, a brilliant presentation is necessary. Challenges And Solutions Of Content Automation With NLG AI Content Creation It Ppt Example can be your best option for delivering a presentation. Represent everything in detail using Challenges And Solutions Of Content Automation With NLG AI Content Creation It Ppt Example and make yourself stand out in meetings. The template is versatile and follows a structure that will cater to your requirements. All the templates prepared by Slidegeeks are easy to download and edit. Our research experts have taken care of the corporate themes as well. So, give it a try and see the results. This slide outlines the challenges and solutions related to automated content generation with the help of NLG methods. The purpose of this slide is to showcase the various issues and solutions to content automation with NLG, including data availability and quality, originality and writing quality, and bias.

Problem Statement Online Marketplace Investor Funding Elevator Pitch Deck Ppt Example
This slide showcases identified problems that are commonly faced by parents in finding and comparing childcare service provider that best suits them. It consist of challenges such as limited access to service provider details, lack of transparency and difficulty in finding suitable matches. Whether you have daily or monthly meetings, a brilliant presentation is necessary. Problem Statement Online Marketplace Investor Funding Elevator Pitch Deck Ppt Example can be your best option for delivering a presentation. Represent everything in detail using Problem Statement Online Marketplace Investor Funding Elevator Pitch Deck Ppt Example and make yourself stand out in meetings. The template is versatile and follows a structure that will cater to your requirements. All the templates prepared by Slidegeeks are easy to download and edit. Our research experts have taken care of the corporate themes as well. So, give it a try and see the results. This slide showcases identified problems that are commonly faced by parents in finding and comparing childcare service provider that best suits them. It consist of challenges such as limited access to service provider details, lack of transparency and difficulty in finding suitable matches.
Comparative Analysis Of Security And Utility Token Securing Your Data Ppt Template
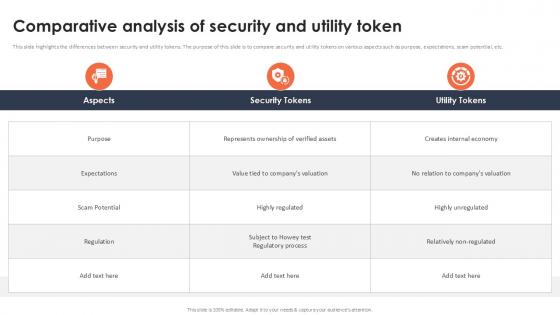
This slide highlights the differences between security and utility tokens. The purpose of this slide is to compare security and utility tokens on various aspects such as purpose, expectations, scam potential, etc. Whether you have daily or monthly meetings, a brilliant presentation is necessary. Comparative Analysis Of Security And Utility Token Securing Your Data Ppt Template can be your best option for delivering a presentation. Represent everything in detail using Comparative Analysis Of Security And Utility Token Securing Your Data Ppt Template and make yourself stand out in meetings. The template is versatile and follows a structure that will cater to your requirements. All the templates prepared by Slidegeeks are easy to download and edit. Our research experts have taken care of the corporate themes as well. So, give it a try and see the results. This slide highlights the differences between security and utility tokens. The purpose of this slide is to compare security and utility tokens on various aspects such as purpose, expectations, scam potential, etc.
Checklist To Implement Cloud Data Security In Cloud Computing Ppt Powerpoint
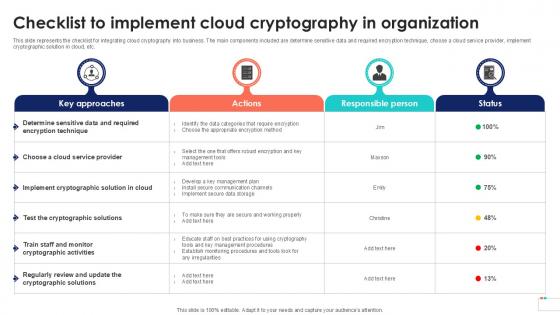
This slide represents the checklist for integrating cloud cryptography into business. The main components included are determine sensitive data and required encryption technique, choose a cloud service provider, implement cryptographic solution in cloud, etc. Whether you have daily or monthly meetings, a brilliant presentation is necessary. Checklist To Implement Cloud Data Security In Cloud Computing Ppt Powerpoint can be your best option for delivering a presentation. Represent everything in detail using Checklist To Implement Cloud Data Security In Cloud Computing Ppt Powerpoint and make yourself stand out in meetings. The template is versatile and follows a structure that will cater to your requirements. All the templates prepared by Slidegeeks are easy to download and edit. Our research experts have taken care of the corporate themes as well. So, give it a try and see the results. This slide represents the checklist for integrating cloud cryptography into business. The main components included are determine sensitive data and required encryption technique, choose a cloud service provider, implement cryptographic solution in cloud, etc.
Key Challenges And Solutions In Retail Marketing PPT Example SS
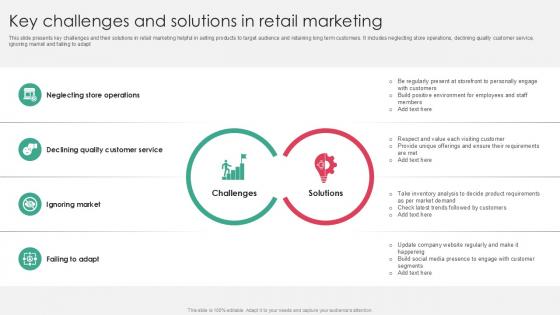
This slide presents key challenges and their solutions in retail marketing helpful in selling products to target audience and retaining long term customers. It includes neglecting store operations, declining quality customer service, ignoring market and failing to adapt. Whether you have daily or monthly meetings, a brilliant presentation is necessary. Key Challenges And Solutions In Retail Marketing PPT Example SS can be your best option for delivering a presentation. Represent everything in detail using Key Challenges And Solutions In Retail Marketing PPT Example SS and make yourself stand out in meetings. The template is versatile and follows a structure that will cater to your requirements. All the templates prepared by Slidegeeks are easy to download and edit. Our research experts have taken care of the corporate themes as well. So, give it a try and see the results. This slide presents key challenges and their solutions in retail marketing helpful in selling products to target audience and retaining long term customers. It includes neglecting store operations, declining quality customer service, ignoring market and failing to adapt

Effective KPIs For Recruitment Employee Attraction And Competency Ppt Presentation
This slide shows main key performance indicators that are used to measure various aspects related to hiring. It include KPIs such as time to hire, cost per hire and attrition rate, etc. Whether you have daily or monthly meetings, a brilliant presentation is necessary. Effective KPIs For Recruitment Employee Attraction And Competency Ppt Presentation can be your best option for delivering a presentation. Represent everything in detail using Effective KPIs For Recruitment Employee Attraction And Competency Ppt Presentation and make yourself stand out in meetings. The template is versatile and follows a structure that will cater to your requirements. All the templates prepared by Slidegeeks are easy to download and edit. Our research experts have taken care of the corporate themes as well. So, give it a try and see the results. This slide shows main key performance indicators that are used to measure various aspects related to hiring. It include KPIs such as time to hire, cost per hire and attrition rate, etc.
Comparative Analysis Of Bitcoin Everything About Bitcoin PPT Slide Fin SS V
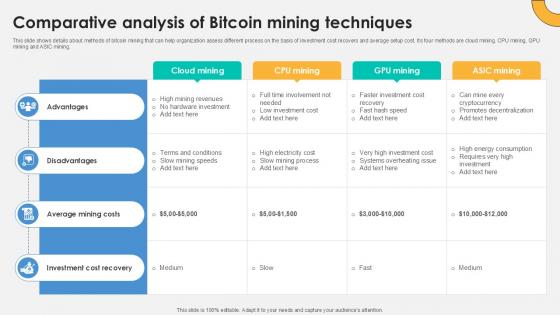
This slide shows details about methods of bitcoin mining that can help organization assess different process on the basis of investment cost recovers and average setup cost. Its four methods are cloud mining, CPU mining, GPU mining and ASIC mining. Whether you have daily or monthly meetings, a brilliant presentation is necessary. Comparative Analysis Of Bitcoin Everything About Bitcoin PPT Slide Fin SS V can be your best option for delivering a presentation. Represent everything in detail using Comparative Analysis Of Bitcoin Everything About Bitcoin PPT Slide Fin SS V and make yourself stand out in meetings. The template is versatile and follows a structure that will cater to your requirements. All the templates prepared by Slidegeeks are easy to download and edit. Our research experts have taken care of the corporate themes as well. So, give it a try and see the results. This slide shows details about methods of bitcoin mining that can help organization assess different process on the basis of investment cost recovers and average setup cost. Its four methods are cloud mining, CPU mining, GPU mining and ASIC mining.
Drip Email Marketing Performance Statistics PPT Example MKT SS V
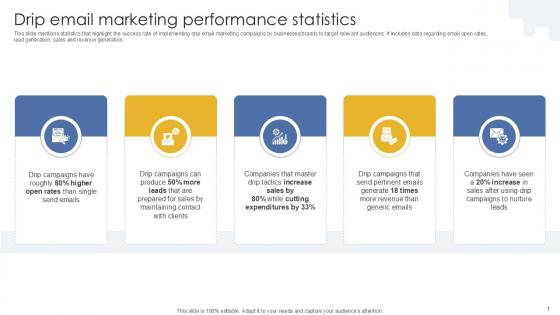
This slide mentions statistics that highlight the success rate of implementing drip email marketing campaigns by businesses brands to target relevant audiences. It includes data regarding email open rates, lead generation, sales and revenue generation. Whether you have daily or monthly meetings, a brilliant presentation is necessary. Drip Email Marketing Performance Statistics PPT Example MKT SS V can be your best option for delivering a presentation. Represent everything in detail using Drip Email Marketing Performance Statistics PPT Example MKT SS V and make yourself stand out in meetings. The template is versatile and follows a structure that will cater to your requirements. All the templates prepared by Slidegeeks are easy to download and edit. Our research experts have taken care of the corporate themes as well. So, give it a try and see the results. This slide mentions statistics that highlight the success rate of implementing drip email marketing campaigns by businesses brands to target relevant audiences. It includes data regarding email open rates, lead generation, sales and revenue generation.
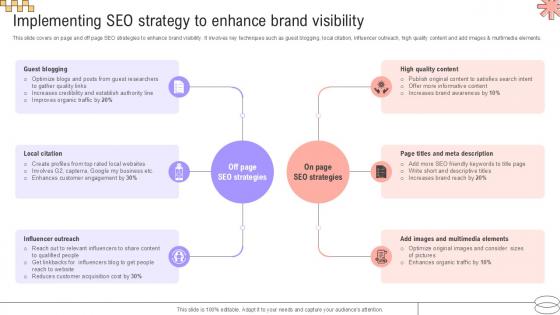
Implementing SEO Strategy To Implementing Geographic Extension PPT Example Strategy SS V
This slide covers on page and off page SEO strategies to enhance brand visibility. It involves key techniques such as guest blogging, local citation, influencer outreach, high quality content and add images and multimedia elements. Whether you have daily or monthly meetings, a brilliant presentation is necessary. Implementing SEO Strategy To Implementing Geographic Extension PPT Example Strategy SS V can be your best option for delivering a presentation. Represent everything in detail using Implementing SEO Strategy To Implementing Geographic Extension PPT Example Strategy SS V and make yourself stand out in meetings. The template is versatile and follows a structure that will cater to your requirements. All the templates prepared by Slidegeeks are easy to download and edit. Our research experts have taken care of the corporate themes as well. So, give it a try and see the results. This slide covers on page and off page SEO strategies to enhance brand visibility. It involves key techniques such as guest blogging, local citation, influencer outreach, high quality content and add images and multimedia elements.
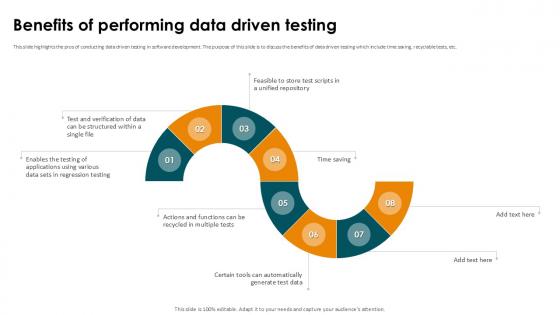
Benefits Of Performing Data Driven Testing Smoke Testing Ppt Presentation
This slide highlights the pros of conducting data driven testing in software development. The purpose of this slide is to discuss the benefits of data driven testing which include time saving, recyclable tests, etc. Whether you have daily or monthly meetings, a brilliant presentation is necessary. Benefits Of Performing Data Driven Testing Smoke Testing Ppt Presentation can be your best option for delivering a presentation. Represent everything in detail using Benefits Of Performing Data Driven Testing Smoke Testing Ppt Presentation and make yourself stand out in meetings. The template is versatile and follows a structure that will cater to your requirements. All the templates prepared by Slidegeeks are easy to download and edit. Our research experts have taken care of the corporate themes as well. So, give it a try and see the results. This slide highlights the pros of conducting data driven testing in software development. The purpose of this slide is to discuss the benefits of data driven testing which include time saving, recyclable tests, etc.
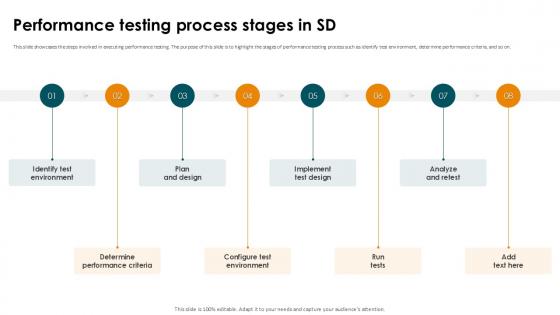
Performance Testing Process Stages In SD Smoke Testing Ppt Sample
This slide showcases the steps involved in executing performance testing. The purpose of this slide is to highlight the stages of performance testing process such as identify test environment, determine performance criteria, and so on. Whether you have daily or monthly meetings, a brilliant presentation is necessary. Performance Testing Process Stages In SD Smoke Testing Ppt Sample can be your best option for delivering a presentation. Represent everything in detail using Performance Testing Process Stages In SD Smoke Testing Ppt Sample and make yourself stand out in meetings. The template is versatile and follows a structure that will cater to your requirements. All the templates prepared by Slidegeeks are easy to download and edit. Our research experts have taken care of the corporate themes as well. So, give it a try and see the results. This slide showcases the steps involved in executing performance testing. The purpose of this slide is to highlight the stages of performance testing process such as identify test environment, determine performance criteria, and so on.
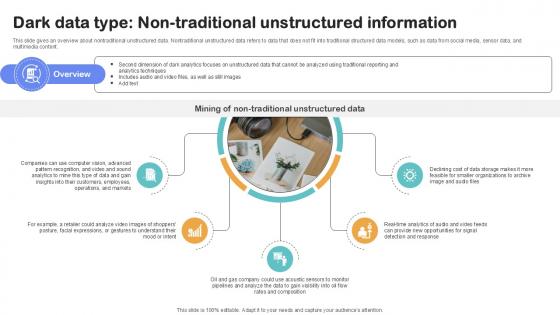
Dark Data Type Non Traditional Importance Of Unstructured Data Ppt PowerPoint
This slide gives an overview about nontraditional unstructured data. Nontraditional unstructured data refers to data that does not fit into traditional structured data models, such as data from social media, sensor data, and multimedia content.Whether you have daily or monthly meetings, a brilliant presentation is necessary. Dark Data Type Non Traditional Importance Of Unstructured Data Ppt PowerPoint can be your best option for delivering a presentation. Represent everything in detail using Dark Data Type Non Traditional Importance Of Unstructured Data Ppt PowerPoint and make yourself stand out in meetings. The template is versatile and follows a structure that will cater to your requirements. All the templates prepared by Slidegeeks are easy to download and edit. Our research experts have taken care of the corporate themes as well. So, give it a try and see the results. This slide gives an overview about nontraditional unstructured data. Nontraditional unstructured data refers to data that does not fit into traditional structured data models, such as data from social media, sensor data, and multimedia content.
Photonics Technology Future Silicon Photonics SiPh It Ppt Slide
This slide depicts the future applications of photonics technology in optical fibre with lasers and how lasers will become a standard route for data transmission from satellites to the earth. The laser beam technology contains a single wavelength.Whether you have daily or monthly meetings, a brilliant presentation is necessary. Photonics Technology Future Silicon Photonics SiPh It Ppt Slide can be your best option for delivering a presentation. Represent everything in detail using Photonics Technology Future Silicon Photonics SiPh It Ppt Slide and make yourself stand out in meetings. The template is versatile and follows a structure that will cater to your requirements. All the templates prepared by Slidegeeks are easy to download and edit. Our research experts have taken care of the corporate themes as well. So, give it a try and see the results. This slide depicts the future applications of photonics technology in optical fibre with lasers and how lasers will become a standard route for data transmission from satellites to the earth. The laser beam technology contains a single wavelength.
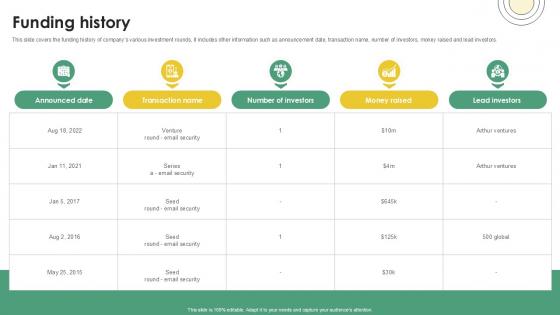
Funding History Email And Data Protection Platform Capital Funding Pitch Deck PPT Slide
This slide covers the funding history of companys various investment rounds, it includes other information such as announcement date, transaction name, number of investors, money raised and lead investors. Whether you have daily or monthly meetings, a brilliant presentation is necessary. Funding History Email And Data Protection Platform Capital Funding Pitch Deck PPT Slide can be your best option for delivering a presentation. Represent everything in detail using Funding History Email And Data Protection Platform Capital Funding Pitch Deck PPT Slide and make yourself stand out in meetings. The template is versatile and follows a structure that will cater to your requirements. All the templates prepared by Slidegeeks are easy to download and edit. Our research experts have taken care of the corporate themes as well. So, give it a try and see the results. This slide covers the funding history of companys various investment rounds, it includes other information such as announcement date, transaction name, number of investors, money raised and lead investors.

Different Components Of Auto Steps By Step Guide For Claiming Car PPT Slide
The slide illustrates various elements of auto insurance coverage required to be added to a policy. Various components included are mandatory bodily injuries, property damages, etc and optional collision, medical payment, underinsured and comprehensive coverage. Whether you have daily or monthly meetings, a brilliant presentation is necessary. Different Components Of Auto Steps By Step Guide For Claiming Car PPT Slide can be your best option for delivering a presentation. Represent everything in detail using Different Components Of Auto Steps By Step Guide For Claiming Car PPT Slide and make yourself stand out in meetings. The template is versatile and follows a structure that will cater to your requirements. All the templates prepared by Slidegeeks are easy to download and edit. Our research experts have taken care of the corporate themes as well. So, give it a try and see the results. The slide illustrates various elements of auto insurance coverage required to be added to a policy. Various components included are mandatory bodily injuries, property damages, etc and optional collision, medical payment, underinsured and comprehensive coverage.
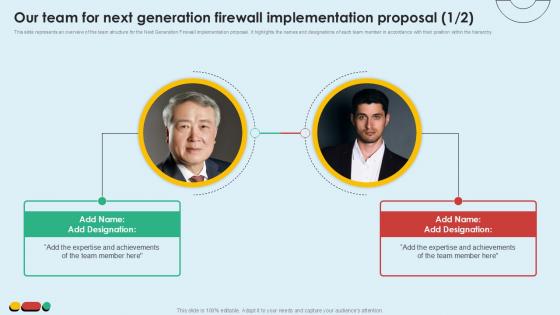
Our Team For Next Generation Intelligent Intrusion Prevention System Ppt Slide
This slide represents an overview of the team structure for the Next Generation Firewall implementation proposal. It highlights the names and designations of each team member in accordance with their position within the hierarchy.Whether you have daily or monthly meetings, a brilliant presentation is necessary. Our Team For Next Generation Intelligent Intrusion Prevention System Ppt Slide can be your best option for delivering a presentation. Represent everything in detail using Our Team For Next Generation Intelligent Intrusion Prevention System Ppt Slide and make yourself stand out in meetings. The template is versatile and follows a structure that will cater to your requirements. All the templates prepared by Slidegeeks are easy to download and edit. Our research experts have taken care of the corporate themes as well. So, give it a try and see the results. This slide represents an overview of the team structure for the Next Generation Firewall implementation proposal. It highlights the names and designations of each team member in accordance with their position within the hierarchy.
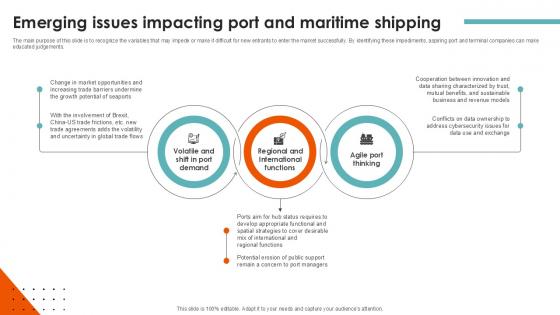
Emerging Issues Impacting Port Terminal Industry Ppt Example
The main purpose of this slide is to recognize the variables that may impede or make it difficult for new entrants to enter the market successfully. By identifying these impediments, aspiring port and terminal companies can make educated judgements.Whether you have daily or monthly meetings, a brilliant presentation is necessary. Emerging Issues Impacting Port Terminal Industry Ppt Example can be your best option for delivering a presentation. Represent everything in detail using Emerging Issues Impacting Port Terminal Industry Ppt Example and make yourself stand out in meetings. The template is versatile and follows a structure that will cater to your requirements. All the templates prepared by Slidegeeks are easy to download and edit. Our research experts have taken care of the corporate themes as well. So, give it a try and see the results. The main purpose of this slide is to recognize the variables that may impede or make it difficult for new entrants to enter the market successfully. By identifying these impediments, aspiring port and terminal companies can make educated judgements.
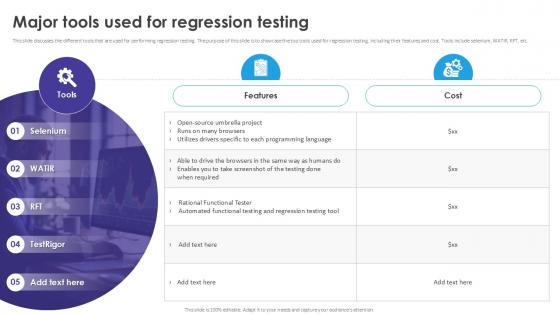
Major Tools Used For Regression Automated Regression Testing And Achieving PPT Slide
This slide discusses the different tools that are used for performing regression testing. The purpose of this slide is to showcase the top tools used for regression testing, including their features and cost. Tools include selenium, WATIR, RFT, etc. Whether you have daily or monthly meetings, a brilliant presentation is necessary. Major Tools Used For Regression Automated Regression Testing And Achieving PPT Slide can be your best option for delivering a presentation. Represent everything in detail using Major Tools Used For Regression Automated Regression Testing And Achieving PPT Slide and make yourself stand out in meetings. The template is versatile and follows a structure that will cater to your requirements. All the templates prepared by Slidegeeks are easy to download and edit. Our research experts have taken care of the corporate themes as well. So, give it a try and see the results. This slide discusses the different tools that are used for performing regression testing. The purpose of this slide is to showcase the top tools used for regression testing, including their features and cost. Tools include selenium, WATIR, RFT, etc.
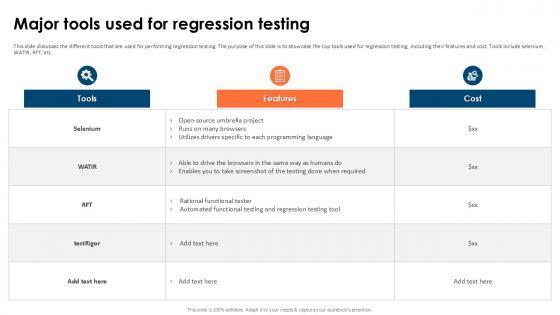
Major Tools Used For Regression Partial Regression Testing For A Best PPT Example
This slide discusses the different tools that are used for performing regression testing. The purpose of this slide is to showcase the top tools used for regression testing, including their features and cost. Tools include selenium, WATIR, RFT, etc. Whether you have daily or monthly meetings, a brilliant presentation is necessary. Major Tools Used For Regression Partial Regression Testing For A Best PPT Example can be your best option for delivering a presentation. Represent everything in detail using Major Tools Used For Regression Partial Regression Testing For A Best PPT Example and make yourself stand out in meetings. The template is versatile and follows a structure that will cater to your requirements. All the templates prepared by Slidegeeks are easy to download and edit. Our research experts have taken care of the corporate themes as well. So, give it a try and see the results. This slide discusses the different tools that are used for performing regression testing. The purpose of this slide is to showcase the top tools used for regression testing, including their features and cost. Tools include selenium, WATIR, RFT, etc.


 Continue with Email

 Home
Home


