Net Profit
Our Key Metrics Ppt PowerPoint Presentation Icon Slide
This is a our key metrics ppt powerpoint presentation icon slide. This is a five stage process. The stages in this process are cash flow, turnover, productivity, net income, customer satisfaction .
Inflation Rate Template 2 Ppt PowerPoint Presentation Icon Designs
This is a inflation rate template 2 ppt powerpoint presentation icon designs. This is a two stage process. The stages in this process are net sales, other income, taxes, management, business.
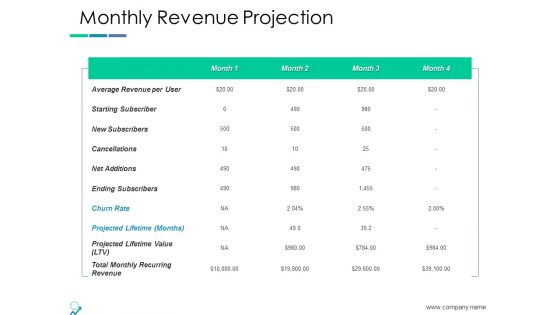
Monthly Revenue Projection Ppt PowerPoint Presentation Pictures Slide
This is a monthly revenue projection ppt powerpoint presentation pictures slide. This is a four stage process. The stages in this process are average revenue per user, starting subscriber, new subscribers, cancellations, net additions.
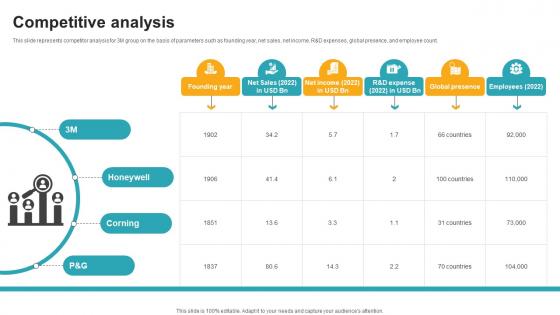
Competitive Analysis Innovative Industrial Solutions Company Profile CP SS V
This slide represents competitor analysis for 3M group on the basis of parameters such as founding year, net sales, net income, RandD expenses, global presence, and employee count.Slidegeeks is one of the best resources for PowerPoint templates. You can download easily and regulate Competitive Analysis Innovative Industrial Solutions Company Profile CP SS V for your personal presentations from our wonderful collection. A few clicks is all it takes to discover and get the most relevant and appropriate templates. Use our Templates to add a unique zing and appeal to your presentation and meetings. All the slides are easy to edit and you can use them even for advertisement purposes. This slide represents competitor analysis for 3M group on the basis of parameters such as founding year, net sales, net income, RandD expenses, global presence, and employee count.

Competitive Analysis Multinational Conglomerate Company Profile CP SS V
This slide represents competitor analysis for 3M group on the basis of parameters such as founding year, net sales, net income, RandD expenses, global presence, and employee count.Slidegeeks is one of the best resources for PowerPoint templates. You can download easily and regulate Competitive Analysis Multinational Conglomerate Company Profile CP SS V for your personal presentations from our wonderful collection. A few clicks is all it takes to discover and get the most relevant and appropriate templates. Use our Templates to add a unique zing and appeal to your presentation and meetings. All the slides are easy to edit and you can use them even for advertisement purposes. This slide represents competitor analysis for 3M group on the basis of parameters such as founding year, net sales, net income, RandD expenses, global presence, and employee count.
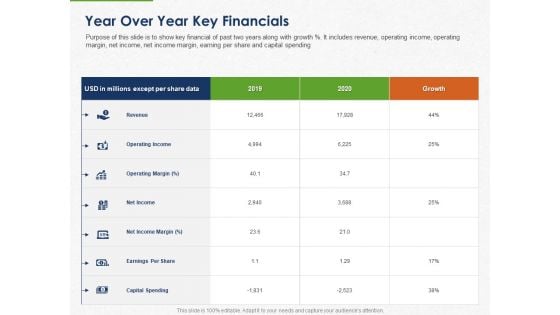
Developing And Creating Corner Market Place Year Over Year Key Financials Ppt PowerPoint Presentation Inspiration Outline PDF
Presenting this set of slides with name developing and creating corner market place year over year key financials ppt powerpoint presentation inspiration outline pdf. The topics discussed in these slides are revenue, operating income, operating margin, net income, net income margin, earnings per share, capital spending. This is a completely editable PowerPoint presentation and is available for immediate download. Download now and impress your audience.
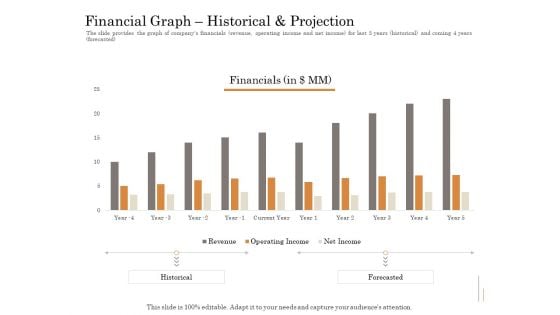
Subordinated Loan Funding Financial Graph Historical And Projection Ppt Model File Formats PDF
The slide provides the graph of companys financials revenue, operating income and net income for last 5 years historical and coming 4 years forecasted. Deliver and pitch your topic in the best possible manner with this subordinated loan funding financial graph historical and projection ppt model file formats pdf. Use them to share invaluable insights on revenue, operating income, net income, current year. and impress your audience. This template can be altered and modified as per your expectations. So, grab it now.
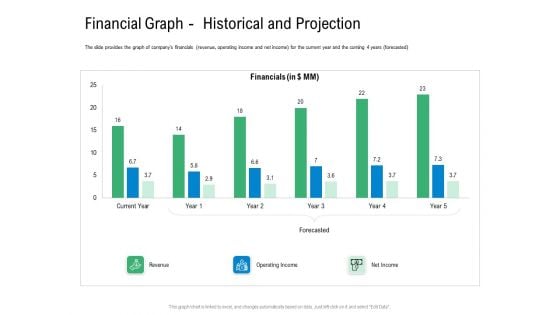
Convertible Preferred Stock Funding Pitch Deck Financial Graph Historical And Projection Themes PDF
The slide provides the graph of companys financials revenue, operating income and net income for the current year and the coming 4 years forecasted. Deliver an awe inspiring pitch with this creative convertible preferred stock funding pitch deck financial graph historical and projection themes pdf bundle. Topics like revenue, operating income, net income can be discussed with this completely editable template. It is available for immediate download depending on the needs and requirements of the user.
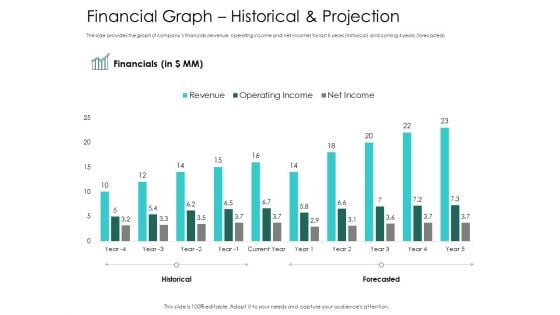
Hybrid Investment Pitch Deck Financial Graph Historical And Projection Ppt Portfolio Design Inspiration PDF
The slide provides the graph of companys financials revenue, operating income and net income for last 5 years historical and coming 4 years forecasted. Deliver an awe inspiring pitch with this creative hybrid investment pitch deck financial graph historical and projection ppt portfolio design inspiration pdf bundle. Topics like financial, revenue, operating income, net income can be discussed with this completely editable template. It is available for immediate download depending on the needs and requirements of the user.
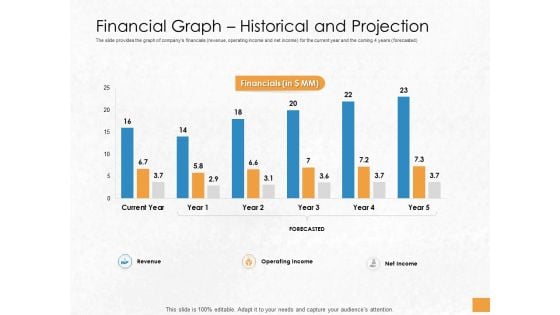
Convertible Debenture Funding Financial Graph Historical And Projection Ppt Professional Themes PDF
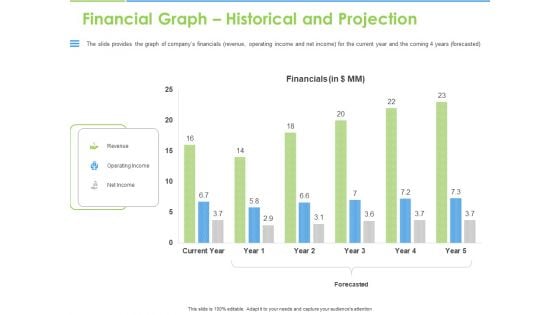
The slide provides the graph of companys financials revenue, operating income and net income for the current year and the coming 4 years forecasted. Deliver an awe-inspiring pitch with this creative convertible debenture funding financial graph historical and projection ppt professional themes pdf bundle. Topics like revenue, operating income, net income, forecasted, financials, current year can be discussed with this completely editable template. It is available for immediate download depending on the needs and requirements of the user.
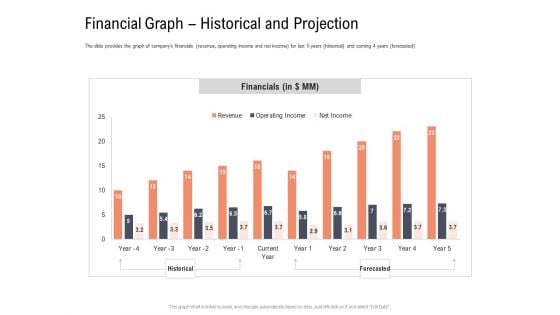
Investor Pitch Deck To Collect Capital From Subordinated Loan Financial Graph Historical And Projection Introduction PDF
The slide provides the graph of companys financials revenue, operating income and net income for last 5 years historical and coming 4 years forecasted. Deliver an awe-inspiring pitch with this creative investor pitch deck to collect capital from subordinated loan financial graph historical and projection introduction pdf bundle. Topics like financials, net income, operating income, revenue, historical, forecasted can be discussed with this completely editable template. It is available for immediate download depending on the needs and requirements of the user.
Convertible Bonds Pitch Deck For Increasing Capitals Financial Graph Historical And Projection Elements PDF
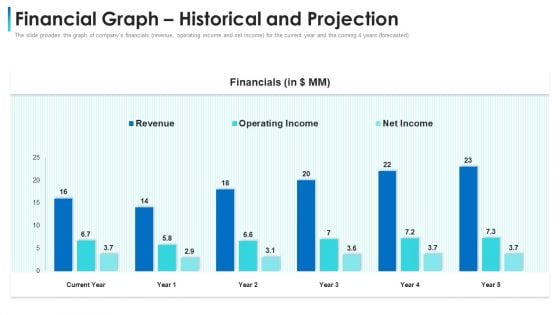
The slide provides the graph of companys financials revenue, operating income and net income for the current year and the coming 4 years forecasted. Deliver an awe-inspiring pitch with this creative convertible bonds pitch deck for increasing capitals financial graph historical and projection elements pdf bundle. Topics like revenue, operating income, net income, forecasted, financials, current year can be discussed with this completely editable template. It is available for immediate download depending on the needs and requirements of the user.
Convertible Bond Financing Pitch Deck Financial Graph Historical And Projection Slides PDF
The slide provides the graph of companys financials revenue, operating income and net income for the current year and the coming 4 years forecasted. Deliver an awe-inspiring pitch with this creative convertible bond financing pitch deck financial graph historical and projection slides pdf bundle. Topics like revenue, operating income, net income, financial can be discussed with this completely editable template. It is available for immediate download depending on the needs and requirements of the user.
Key Statistics Related To Companys Financials And Operations Ppt File Clipart PDF
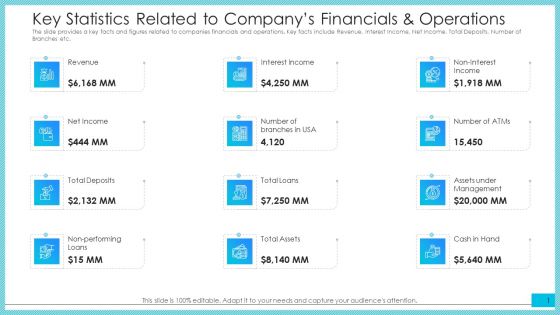
The slide provides a key facts and figures related to companies financials and operations. Key facts include Revenue, Interest Income, Net Income, Total Deposits, Number of Branches etc.Deliver and pitch your topic in the best possible manner with this key statistics related to companys financials and operations ppt file clipart pdf. Use them to share invaluable insights on net income, revenue, interest income and impress your audience. This template can be altered and modified as per your expectations. So, grab it now.
Key Statistics Related To Companys Financials And Operations Ppt Pictures Introduction PDF
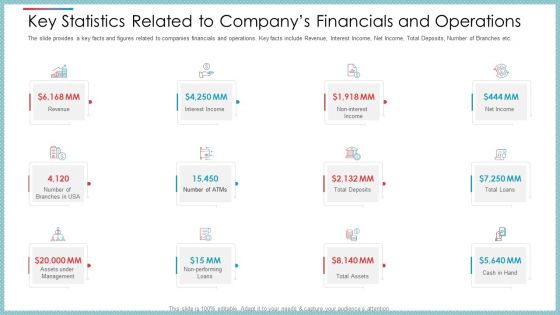
The slide provides a key facts and figures related to companies financials and operations. Key facts include Revenue, Interest Income, Net Income, Total Deposits, Number of Branches etc. Deliver and pitch your topic in the best possible manner with this key statistics related to companys financials and operations ppt pictures introduction pdf. Use them to share invaluable insights on net income, revenue, interest income and impress your audience. This template can be altered and modified as per your expectations. So, grab it now.
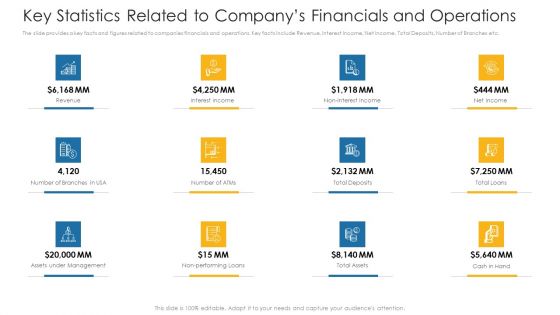
Key Statistics Related To Companys Financials And Operations Ppt Outline Example PDF
The slide provides a key facts and figures related to companies financials and operations. Key facts include Revenue, Interest Income, Net Income, Total Deposits, Number of Branches etc. Deliver an awe-inspiring pitch with this creative key statistics related to companys financials and operations ppt outline example pdf. bundle. Topics like net income, revenue, interest income can be discussed with this completely editable template. It is available for immediate download depending on the needs and requirements of the user.
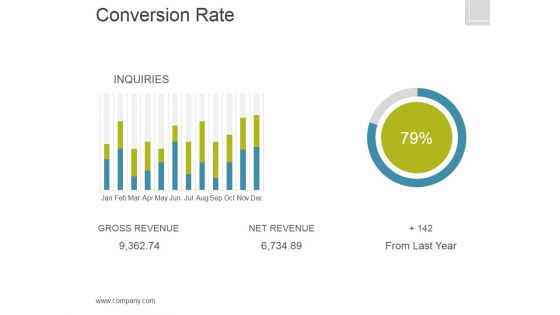
Conversion Rate Template 1 Ppt PowerPoint Presentation Portfolio
This is a conversion rate template 1 ppt powerpoint presentation portfolio. This is a three stage process. The stages in this process are gross revenue, net revenue, from last year.
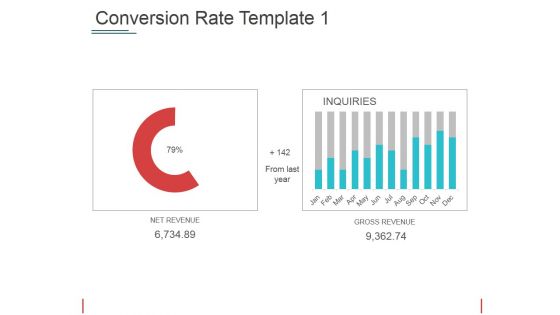
Conversion Rate Template 1 Ppt PowerPoint Presentation Visual Aids Files
This is a conversion rate template 1 ppt powerpoint presentation visual aids files. This is a two stage process. The stages in this process are net revenue gross revenue from last year.
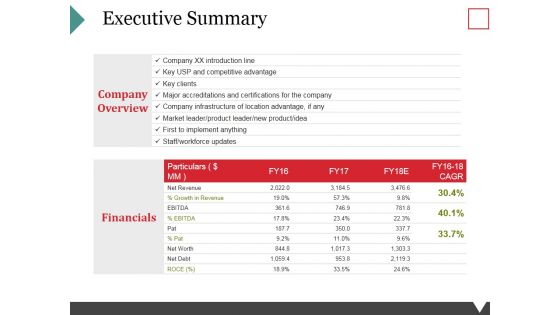
Executive Summary Ppt PowerPoint Presentation Portfolio Background
This is a executive summary ppt powerpoint presentation portfolio background. This is a two stage process. The stages in this process are company overview, financials, key clients, net revenue, growth in revenue.
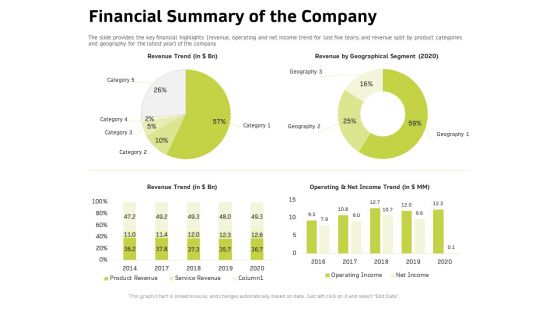
Customer Relationship Management In Freehold Property Financial Summary Of The Company Brochure PDF
Presenting this set of slides with name customer relationship management in freehold property financial summary of the company brochure pdf. The topics discussed in these slides are revenue trend, operating and net income trend, revenue geographical segment 2020, operating income, net income, product revenue, service revenue. This is a completely editable PowerPoint presentation and is available for immediate download. Download now and impress your audience.
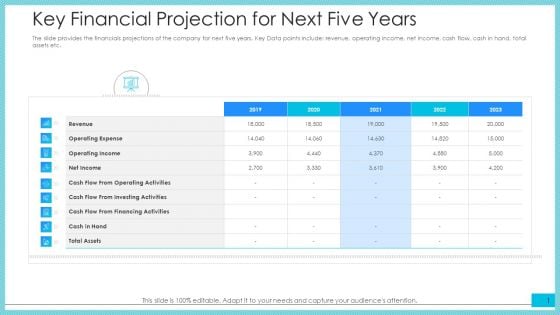
Key Financial Projection For Next Five Years Ppt Show PDF
The slide provides the financials projections of the company for next five years. Key Data points include revenue, operating income, net income, cash flow, cash in hand, total assets etc.Deliver an awe-inspiring pitch with this creative key financial projection for next five years ppt show pdf. bundle. Topics like operating expense, operating income, net income can be discussed with this completely editable template. It is available for immediate download depending on the needs and requirements of the user.
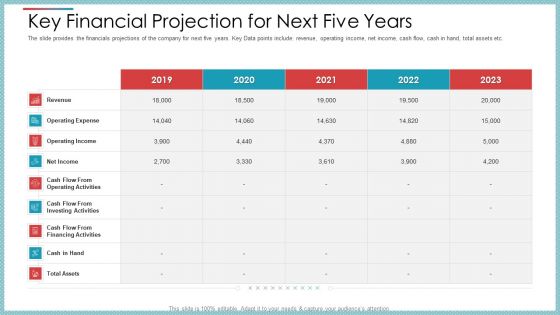
Key Financial Projection For Next Five Years Ppt Outline Master Slide PDF
The slide provides the financials projections of the company for next five years. Key Data points include revenue, operating income, net income, cash flow, cash in hand, total assets etc.Deliver an awe-inspiring pitch with this creative key financial projection for next five years ppt outline master slide pdf. bundle. Topics like operating expense, operating income, net income can be discussed with this completely editable template. It is available for immediate download depending on the needs and requirements of the user.
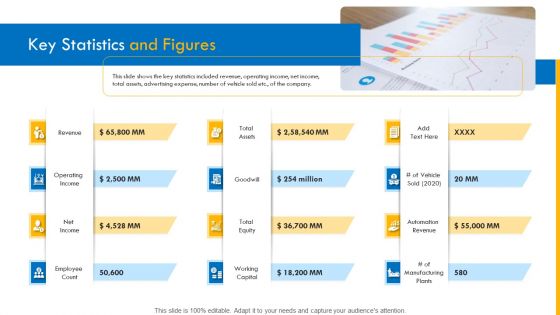
Investor Pitch Deck For Interim Financing Key Statistics And Figures Inspiration PDF
This slide shows the key statistics included revenue, operating income, net income, total assets, advertising expense, number of vehicle sold etc., of the company.Deliver and pitch your topic in the best possible manner with this investor pitch deck for interim financing key statistics and figures inspiration pdf. Use them to share invaluable insights on total assets, operating income, net income, total equity, goodwill and impress your audience. This template can be altered and modified as per your expectations. So, grab it now.
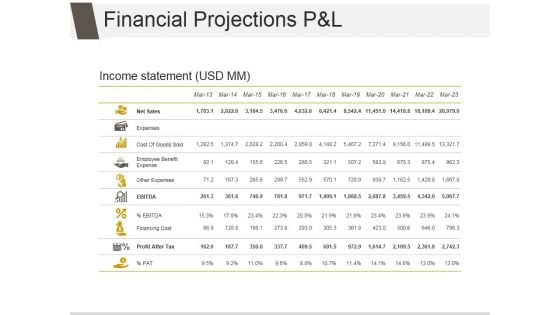
Financial Projections P And L Ppt PowerPoint Presentation Design Ideas
This is a financial projections p and l ppt powerpoint presentation design ideas. This is a eleven stage process. The stages in this process are net sales, expenses, cost of goods sold, employee benefit expense, other expenses, financing cost.
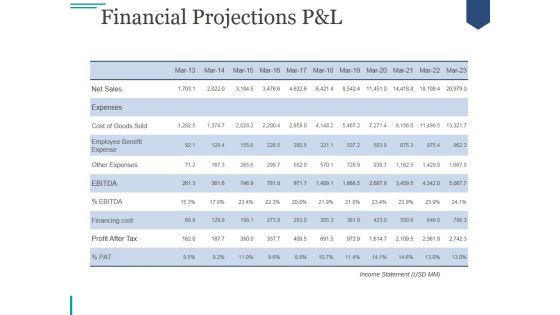
Financial Projections Pand L Ppt PowerPoint Presentation Template
This is a financial projections pand l ppt powerpoint presentation template. This is a eleven stage process. The stages in this process are net sales, expenses, cost of goods sold, employee benefit expense, other expenses, financing cost.
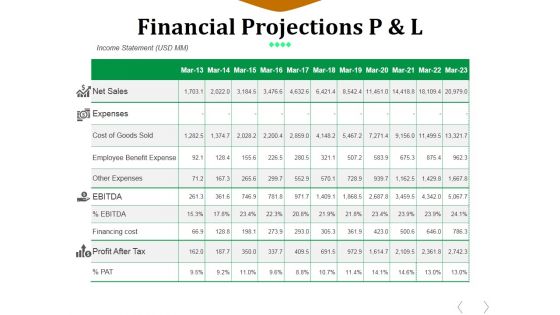
Financial Projections P And L Ppt PowerPoint Presentation File Professional
This is a financial projections p and l ppt powerpoint presentation file professional. This is a eleven stage process. The stages in this process are net sales, expenses, cost of goods sold, employee benefit expense, other expenses, financing cost.
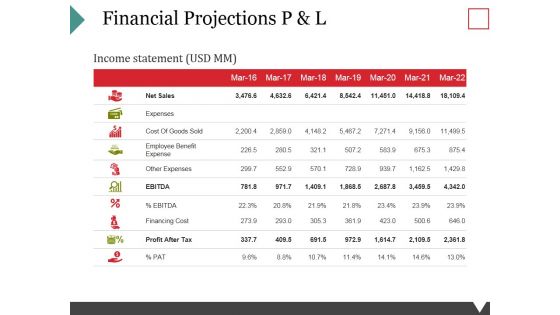
Financial Projections P And L Ppt PowerPoint Presentation Ideas Elements
This is a financial projections p and l ppt powerpoint presentation ideas elements. This is a seven stage process. The stages in this process are net sales, expenses, cost of goods sold, employee benefit expense, other expenses.
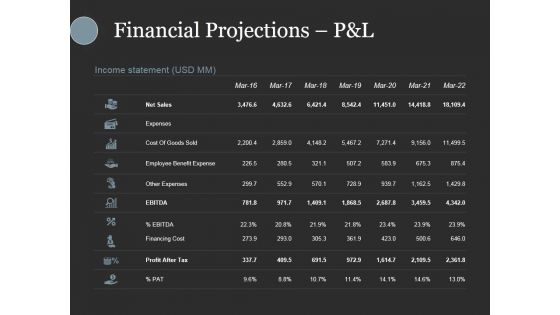
Financial Projections Pandl Ppt PowerPoint Presentation Slides Show
This is a financial projections pandl ppt powerpoint presentation slides show. This is a seven stage process. The stages in this process are net sales, expenses, cost of goods sold, employee benefit expense, other expenses.
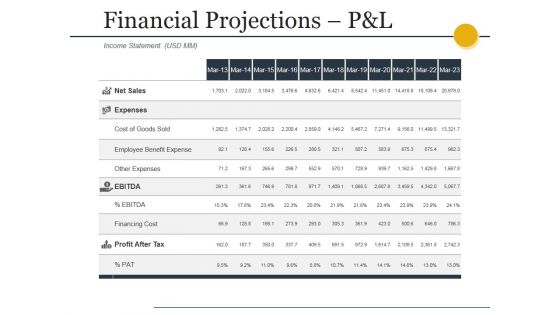
Financial Projections Pandl Ppt PowerPoint Presentation Styles Gallery
This is a financial projections pandl ppt powerpoint presentation styles gallery. This is a eleven stage process. The stages in this process are net sales, expenses, cost of goods sold, employee benefit expense, other expenses.
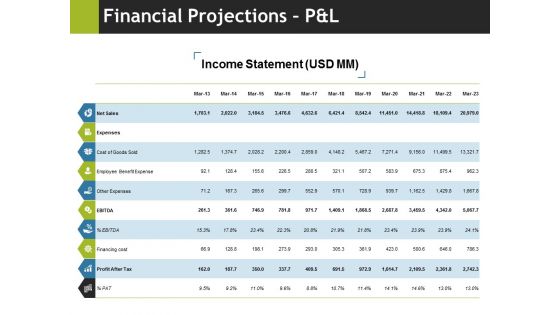
Financial Projections Pandl Ppt PowerPoint Presentation Portfolio Sample
This is a financial projections pandl ppt powerpoint presentation portfolio sample. This is a ten stage process. The stages in this process are net sales, expenses, cost of goods sold, employee benefit expense, other expenses.
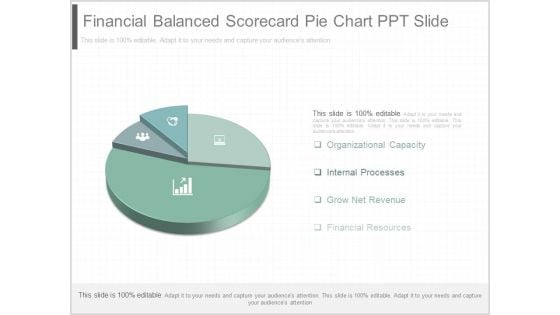
Financial Balanced Scorecard Pie Chart Ppt Slide
This is a financial balanced scorecard pie chart ppt slide. This is a four stage process. The stages in this process are organizational capacity, internal processes, grow net revenue, financial resources.
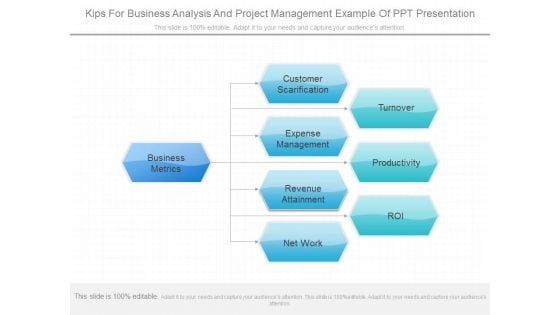
Kips For Business Analysis And Project Management Example Of Ppt Presentation
This is a kips for business analysis and project management example of ppt presentation. This is a eight stage process. The stages in this process are business metrics, customer scarification, expense management, revenue attainment, net work, turnover, productivity, roi.
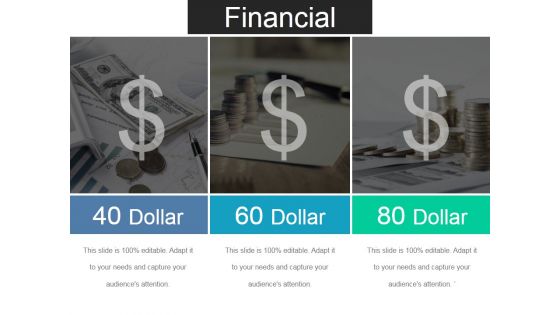
Financial Ppt PowerPoint Presentation Show Graphic Tips
This is a financial ppt powerpoint presentation show graphic tips. This is a six stage process. The stages in this process are target market, users, net revenue, total expenses.
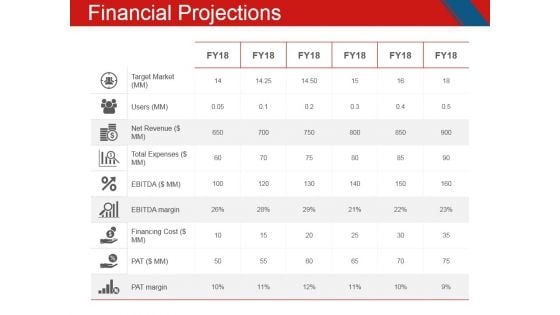
Financial Projections Ppt PowerPoint Presentation Inspiration Deck
This is a financial projections ppt powerpoint presentation inspiration deck. This is a six stage process. The stages in this process are target market, users, net revenue, total expenses, financing cost.
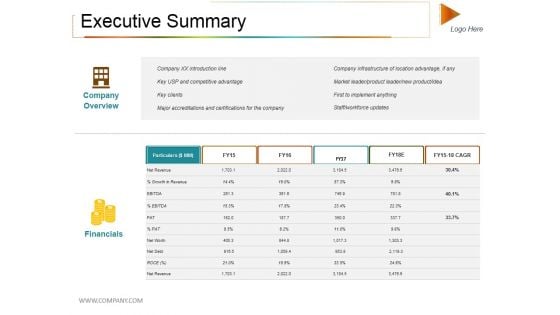
Executive Summary Ppt PowerPoint Presentation Visual Aids Inspiration
This is a executive summary ppt powerpoint presentation visual aids inspiration. This is a five stage process. The stages in this process are company overview, financials, net revenue, particulars.
Financial Ppt PowerPoint Presentation Summary Graphics Tutorials
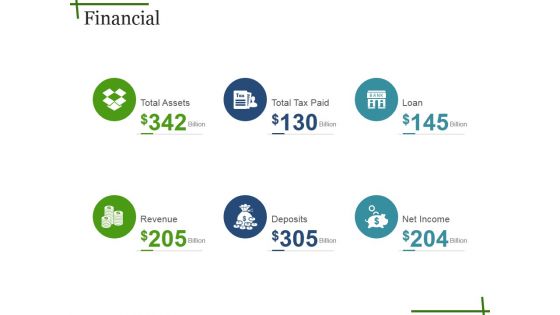
This is a financial ppt powerpoint presentation summary graphics tutorials. This is a six stage process. The stages in this process are target market, users, net revenue, total expenses, ebitda.
Financial Projections Ppt PowerPoint Presentation Styles Microsoft
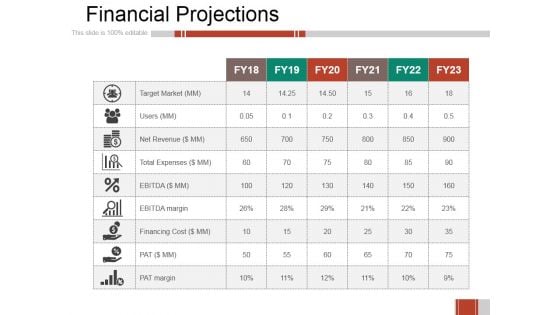
This is a financial projections ppt powerpoint presentation styles microsoft. This is a six stage process. The stages in this process are target market, users, net revenue, total expenses, financing cost.
Financial Projections Ppt PowerPoint Presentation Model Diagrams
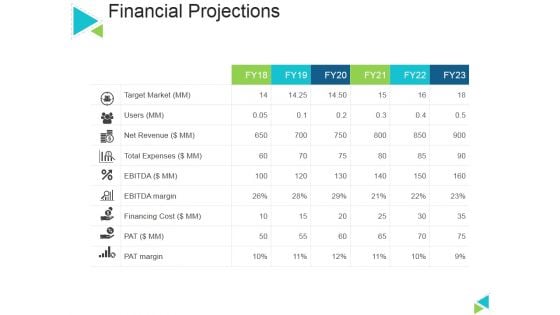
This is a financial projections ppt powerpoint presentation model diagrams. This is a six stage process. The stages in this process are target market, net revenue, ebitda margin, financing cost, pat margin.

Financial Projections Ppt PowerPoint Presentation Ideas Example Introduction
This is a financial projections ppt powerpoint presentation ideas example introduction. This is a five stage process. The stages in this process are target market, users, net revenue, total expenses, financing cost.

Executive Summary Template 2 Ppt PowerPoint Presentation Summary Ideas
This is a executive summary template 2 ppt powerpoint presentation summary ideas. This is a four stage process. The stages in this process are company overview, financials, transaction, particulars, net revenue.
Financial Ppt PowerPoint Presentation Layouts Portrait
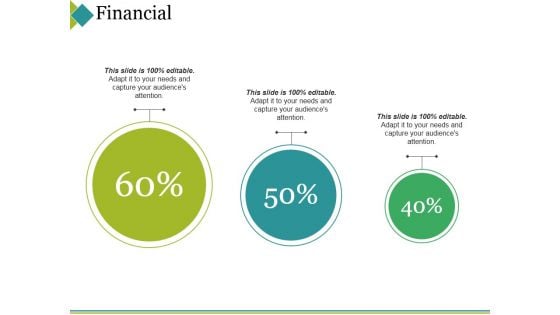
This is a financial ppt powerpoint presentation layouts portrait. This is a seven stage process. The stages in this process are target market, users, net revenue, financing cost, total expenses.
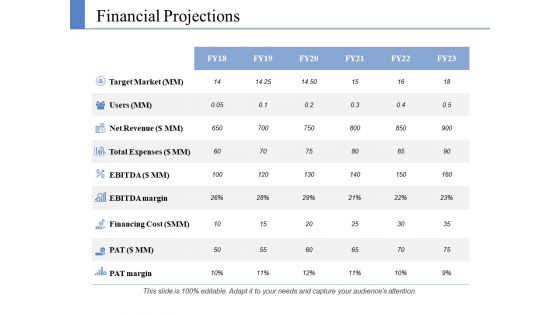
Financial Projections Ppt PowerPoint Presentation Layouts Example File
This is a financial projections ppt powerpoint presentation layouts example file. This is a six stage process. The stages in this process are target market, users, net revenue, total expenses, financing cost.

Financial Ppt PowerPoint Presentation Pictures Inspiration
This is a financial ppt powerpoint presentation pictures inspiration. This is a six stage process. The stages in this process are target market, users, net revenue, total expenses, pat margin.
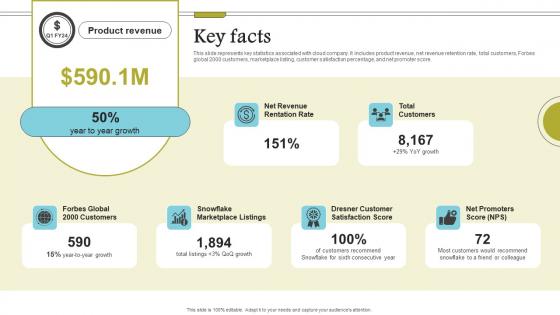
Key Facts Cloud Data Computing Company Fund Raising Mockup PDF
This slide represents key statistics associated with cloud company. It includes product revenue, net revenue retention rate, total customers, Forbes global 2000 customers, marketplace listing, customer satisfaction percentage, and net promoter score. If your project calls for a presentation, then Slidegeeks is your go-to partner because we have professionally designed, easy-to-edit templates that are perfect for any presentation. After downloading, you can easily edit Key Facts Cloud Data Computing Company Fund Raising Mockup PDF and make the changes accordingly. You can rearrange slides or fill them with different images. Check out all the handy templates This slide represents key statistics associated with cloud company. It includes product revenue, net revenue retention rate, total customers, Forbes global 2000 customers, marketplace listing, customer satisfaction percentage, and net promoter score.
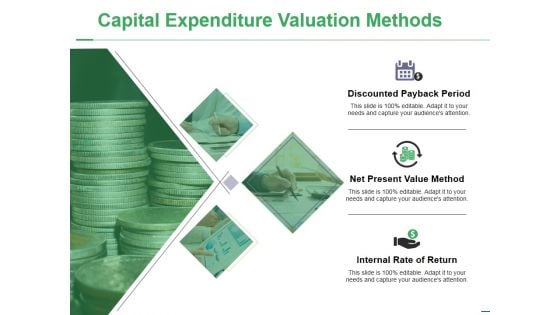
Capital Expenditure Valuation Methods Ppt PowerPoint Presentation File Background Images
This is a capital expenditure valuation methods ppt powerpoint presentation file background images. This is a three stage process. The stages in this process are discounted payback period, net present value method, internal rate of return.
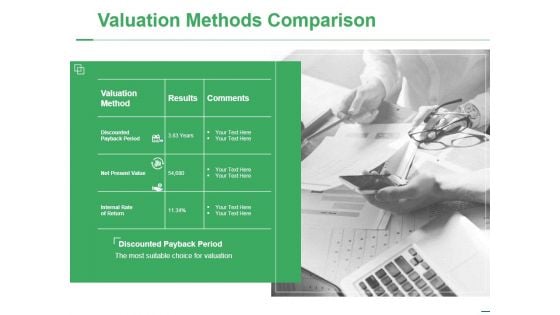
Valuation Methods Comparison Ppt PowerPoint Presentation Inspiration Background Images
This is a valuation methods comparison ppt powerpoint presentation inspiration background images. This is a two stage process. The stages in this process are valuation method, results, comments, internal rate of return, net present value.

Capital Expenditure Valuation Methods Ppt PowerPoint Presentation Show Format
This is a capital expenditure valuation methods ppt powerpoint presentation show format. This is a four stage process. The stages in this process are discounted payback period, net present value method, internal rate of return, business, icons.
Capital Expenditure Valuation Methods Ppt PowerPoint Presentation Professional Icons
This is a capital expenditure valuation methods ppt powerpoint presentation professional icons. This is a three stage process. The stages in this process are discounted payback period, net present value method, internal rate of return, capital expenditure valuation methods.
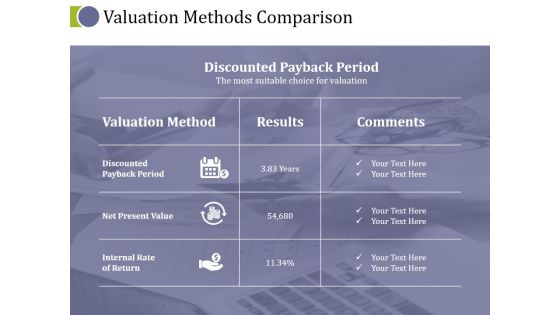
Valuation Methods Comparison Ppt PowerPoint Presentation Ideas Background Image
This is a valuation methods comparison ppt powerpoint presentation ideas background image. This is a two stage process. The stages in this process are valuation method, discounted payback period, net present value, internal rate of return.
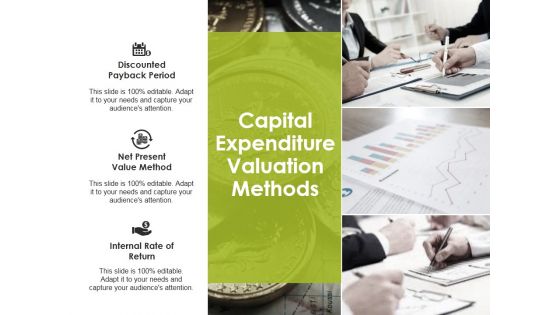
Capital Expenditure Valuation Methods Ppt PowerPoint Presentation Styles Influencers
This is a capital expenditure valuation methods ppt powerpoint presentation styles influencers. This is a three stage process. The stages in this process are discounted payback period, net present value method, internal rate of return.

Capital Expenditure Valuation Methods Ppt PowerPoint Presentation Slides Grid
This is a capital expenditure valuation methods ppt powerpoint presentation slides grid. This is a three stage process. The stages in this process are discounted payback period, net present value method, internal rate of return.

Evaluations Techniques Of Projects Ppt Powerpoint Presentation Summary Example File
This is a evaluations techniques of projects ppt powerpoint presentation summary example file. This is a four stage process. The stages in this process are return of investment, payback method, net present value, the internal rate of return.
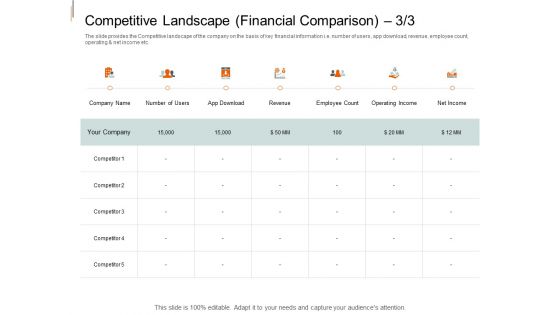
Equity Crowd Investing Competitive Landscape Financial Comparison Competitor Ideas PDF
The slide provides the Competitive landscape of the company on the basis of key financial information i.e. number of users, app download, revenue, employee count, operating and net income etc. Deliver an awe inspiring pitch with this creative equity crowd investing competitive landscape financial comparison competitor ideas pdf bundle. Topics like revenue, employee count, operating income, net income can be discussed with this completely editable template. It is available for immediate download depending on the needs and requirements of the user.
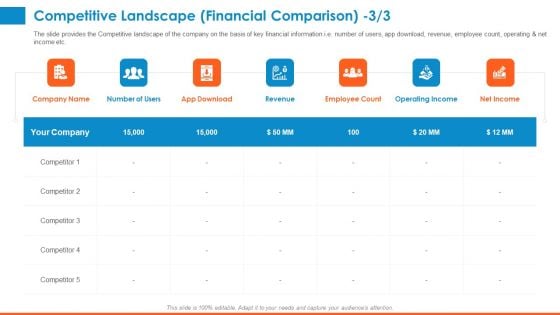
Raising Company Capital From Public Funding Sources Competitive Landscape Financial Comparison Graphics PDF
The slide provides the Competitive landscape of the company on the basis of key financial information i.e. number of users, app download, revenue, employee count, operating and net income etc. Deliver an awe-inspiring pitch with this creative raising company capital from public funding sources competitive landscape financial comparison graphics pdf bundle. Topics like revenue, employee count, operating income, net income can be discussed with this completely editable template. It is available for immediate download depending on the needs and requirements of the user.

Key Statistics Related To Companys Financials And Operations Ppt Infographics Gallery PDF
The slide provides a key facts and figures related to companies financials and operations. Key facts include Revenue, Interest Income, Net Income, Total Deposits, Number of Branches etc.Deliver an awe-inspiring pitch with this creative key statistics related to companys financials and operations ppt infographics gallery pdf. bundle. Topics like net income, revenue, interest incomecan be discussed with this completely editable template. It is available for immediate download depending on the needs and requirements of the user.
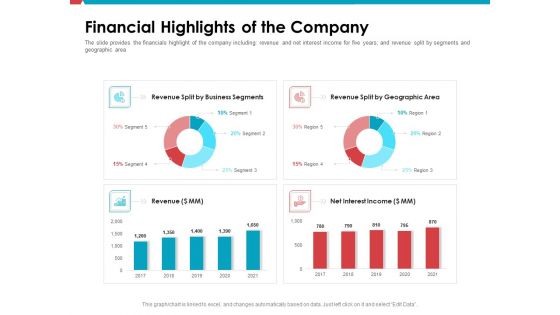
Investor Pitch Deck Public Offering Market Financial Highlights Of The Company Slides PDF
The slide provides the financials highlight of the company including, revenue and net interest income for five years, and revenue split by segments and geographic area. Deliver an awe-inspiring pitch with this creative investor pitch deck public offering market financial highlights of the company slides pdf bundle. Topics like revenue split by business segments, revenue, net interest income can be discussed with this completely editable template. It is available for immediate download depending on the needs and requirements of the user.
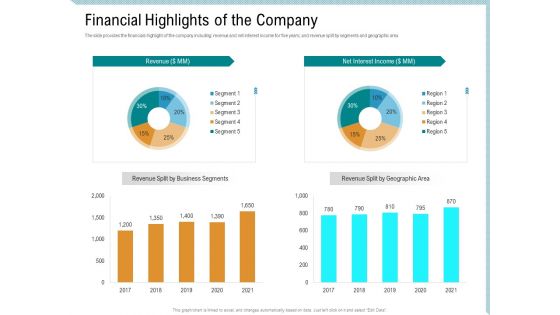
Investor Pitch Deck Collect Capital Financial Market Financial Highlights Of The Company Pictures PDF
The slide provides the financials highlight of the company including, revenue and net interest income for five years, and revenue split by segments and geographic area. Deliver an awe-inspiring pitch with this creative investor pitch deck collect capital financial market financial highlights of the company pictures pdf bundle. Topics like revenue split by business segments, revenue, net interest income can be discussed with this completely editable template. It is available for immediate download depending on the needs and requirements of the user.
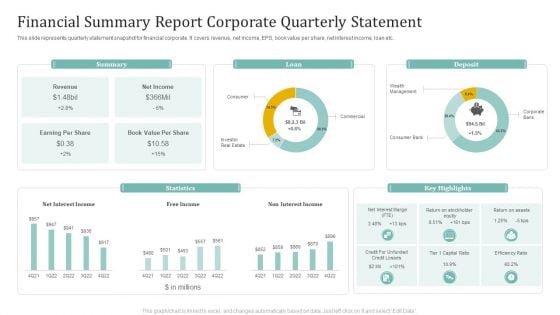
Financial Summary Report Corporate Quarterly Statement Ppt Slides Ideas PDF
This slide represents quarterly statement snapshot for financial corporate. It covers revenue, net income, EPS, book value per share, net interest income, loan etc. Showcasing this set of slides titled Financial Summary Report Corporate Quarterly Statement Ppt Slides Ideas PDF. The topics addressed in these templates are Summary, Loan, Deposit, Statistics. All the content presented in this PPT design is completely editable. Download it and make adjustments in color, background, font etc. as per your unique business setting.
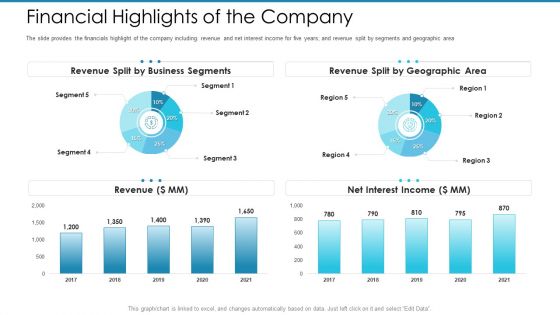
Post Initial Pubic Offering Market Pitch Deck Financial Highlights Of The Company Slides PDF
The slide provides the financials highlight of the company including revenue and net interest income for five years and revenue split by segments and geographic area Deliver an awe-inspiring pitch with this creative post initial pubic offering market pitch deck financial highlights of the company slides pdf. bundle. Topics like revenue, 2017 to 2021, net interest income can be discussed with this completely editable template. It is available for immediate download depending on the needs and requirements of the user.
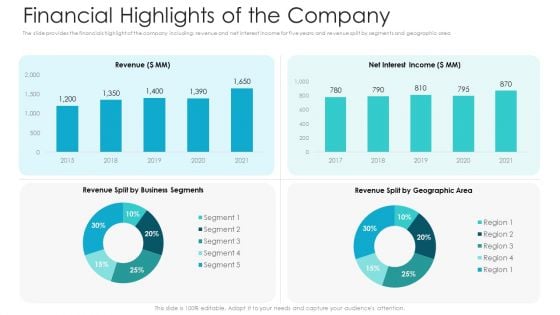
Private Equity Fundraising Pitch Deck Financial Highlights Of The Company Ppt Layouts Outline PDF
The slide provides the financials highlight of the company including revenue and net interest income for five years and revenue split by segments and geographic area. Deliver an awe inspiring pitch with this creative private equity fundraising pitch deck financial highlights of the company ppt layouts outline pdf bundle. Topics like revenue, net interest income, financial highlights of the company can be discussed with this completely editable template. It is available for immediate download depending on the needs and requirements of the user.


 Continue with Email

 Home
Home


