Net Sales
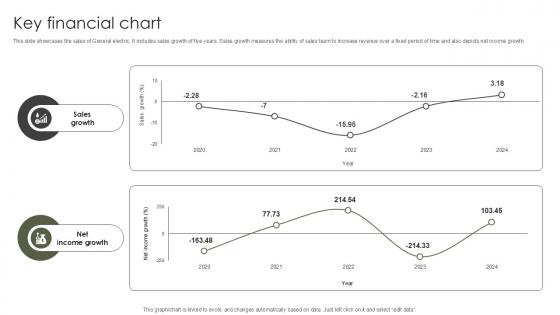
Key Financial Chart Military Aircraft Engine Manufacturing PPT Presentation CP SS V
This slide showcases the sales of General electric. It includes sales growth of five years. Sales growth measures the ability of sales team to increase revenue over a fixed period of time and also depicts net income growth. Explore a selection of the finest Key Financial Chart Military Aircraft Engine Manufacturing PPT Presentation CP SS V here. With a plethora of professionally designed and pre-made slide templates, you can quickly and easily find the right one for your upcoming presentation. You can use our Key Financial Chart Military Aircraft Engine Manufacturing PPT Presentation CP SS V to effectively convey your message to a wider audience. Slidegeeks has done a lot of research before preparing these presentation templates. The content can be personalized and the slides are highly editable. Grab templates today from Slidegeeks. This slide showcases the sales of General electric. It includes sales growth of five years. Sales growth measures the ability of sales team to increase revenue over a fixed period of time and also depicts net income growth.
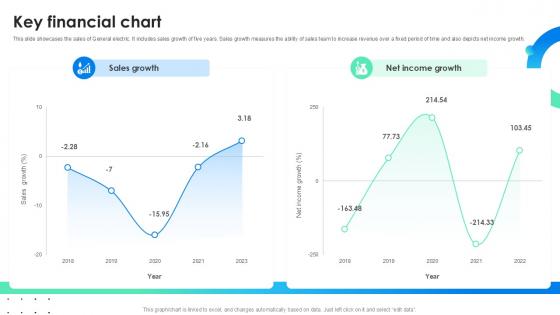
Key Financial Chart Global Energy Company Profile PPT Example CP SS V
This slide showcases the sales of General electric. It includes sales growth of five years. Sales growth measures the ability of sales team to increase revenue over a fixed period of time and also depicts net income growth. Explore a selection of the finest Key Financial Chart Global Energy Company Profile PPT Example CP SS V here. With a plethora of professionally designed and pre-made slide templates, you can quickly and easily find the right one for your upcoming presentation. You can use our Key Financial Chart Global Energy Company Profile PPT Example CP SS V to effectively convey your message to a wider audience. Slidegeeks has done a lot of research before preparing these presentation templates. The content can be personalized and the slides are highly editable. Grab templates today from Slidegeeks. This slide showcases the sales of General electric. It includes sales growth of five years. Sales growth measures the ability of sales team to increase revenue over a fixed period of time and also depicts net income growth.
Business Event Return On Investment Tracking Tools And Metrics Portrait Pdf
The slide displays event ROI metrics and tools that aid in determining net value and costs contributing to an events success. It contains business goals such as brand awareness. Sales revenue, event engagement, recruitment etc. event goals, ROI metrics, ROI tools, etc. Pitch your topic with ease and precision using this Business Event Return On Investment Tracking Tools And Metrics Portrait Pdf This layout presents information on Building Brand Awareness, Driving Sales Revenue, Driving Recruitment It is also available for immediate download and adjustment. So, changes can be made in the color, design, graphics or any other component to create a unique layout. The slide displays event ROI metrics and tools that aid in determining net value and costs contributing to an events success. It contains business goals such as brand awareness. Sales revenue, event engagement, recruitment etc. event goals, ROI metrics, ROI tools, etc.
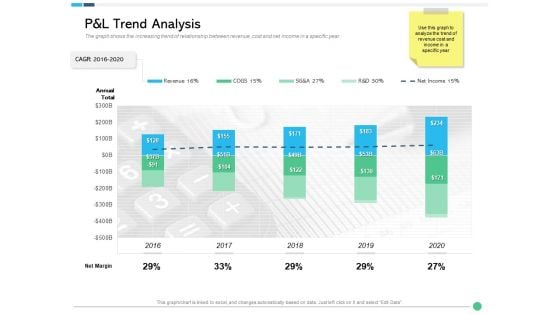
Assessing Synergies Pandl Trend Analysis Ppt PowerPoint Presentation Show Ideas PDF
The graph shows the increasing trend of relationship between revenue ,cost and net income in a specific year. Deliver an awe-inspiring pitch with this creative assessing synergies pandl trend analysis ppt powerpoint presentation show ideas pdf bundle. Topics like net margin, 2016 to 2020, net income can be discussed with this completely editable template. It is available for immediate download depending on the needs and requirements of the user.

Revaluate Capital Structure Resolution Cash Flow Statement FY 2019 2020 Inspiration PDF
The purpose of this slide is to provide glimpse about the firms ability to create value for shareholders by generating positive cash flows for current year. Deliver an awe inspiring pitch with this creative revaluate capital structure resolution cash flow statement fy 2019 2020 inspiration pdf. bundle. Topics like adjustments net income, investments, net borrowings, changes liabilities, net income can be discussed with this completely editable template. It is available for immediate download depending on the needs and requirements of the user.
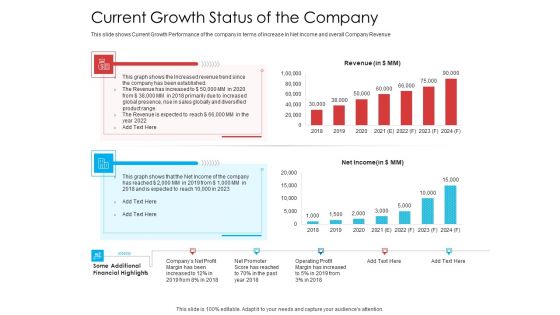
Current Growth Status Of The Company Rules PDF
This slide shows Current Growth Performance of the company in terms of increase in Net Income and overall Company Revenue. Deliver an awe-inspiring pitch with this creative current growth status of the company rules pdf bundle. Topics like revenue, net income, financial, operating profit margin, net promoter score can be discussed with this completely editable template. It is available for immediate download depending on the needs and requirements of the user.
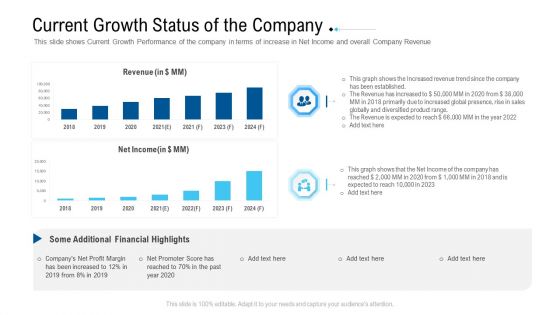
Funding Deck To Raise Grant Funds From Public Organizations Current Growth Status Of The Company Ideas PDF
This slide shows Current Growth Performance of the company in terms of increase in Net Income and overall Company Revenue. Deliver an awe inspiring pitch with this creative funding deck to raise grant funds from public organizations current growth status of the company ideas pdf bundle. Topics like revenue, net income, financial highlights, net profit margin, revenue can be discussed with this completely editable template. It is available for immediate download depending on the needs and requirements of the user.
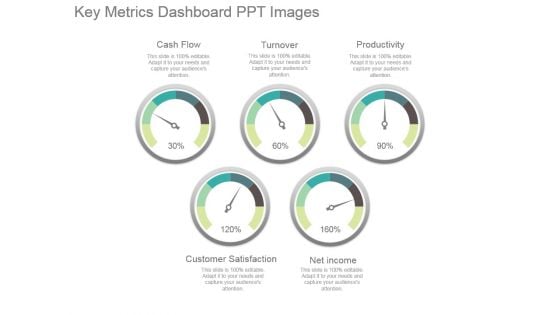
Key Metrics Dashboard Ppt Images
This is a key metrics dashboard ppt images. This is a five stage process. The stages in this process are cash flow, turnover, productivity, net income, customer satisfaction.
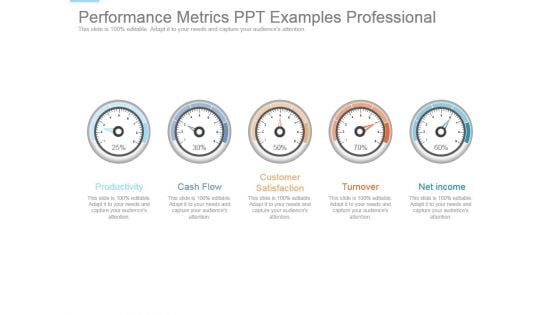
Performance Metrics Ppt Examples Professional
This is a performance metrics ppt examples professional. This is a five stage process. The stages in this process are productivity, cash flow, customer satisfaction, turnover, net income.
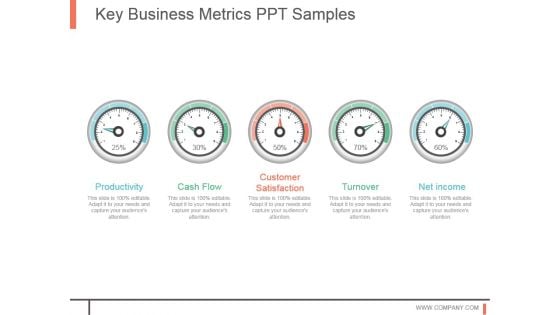
Key Business Metrics Ppt Samples
This is a key business metrics ppt samples. This is a five stage process. The stages in this process are productivity, cash flow, customer satisfaction, turnover, net income.

Our Performance Indicators Powerpoint Themes
This is a our performance indicators powerpoint themes. This is a five stage process. The stages in this process are cash flow, turnover, productivity, customer satisfaction, net income.
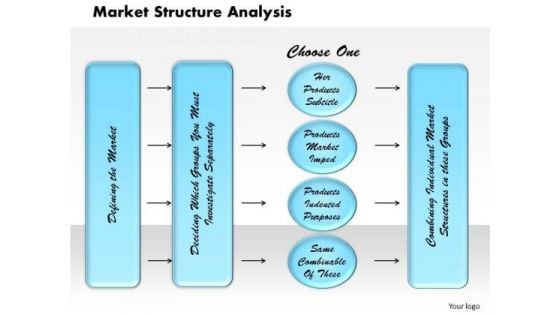
Market Structure Analysis Business PowerPoint Presentation
Our Market Structure Analysis Business Powerpoint Presentation Powerpoint Templates And Your Ideas Make A Great Doubles Pair. Play The Net With Assured Hands.
Financial Ppt PowerPoint Presentation Icon Objects
This is a financial ppt powerpoint presentation icon objects. This is a three stage process. The stages in this process are revenue, deposits, net income, financial .
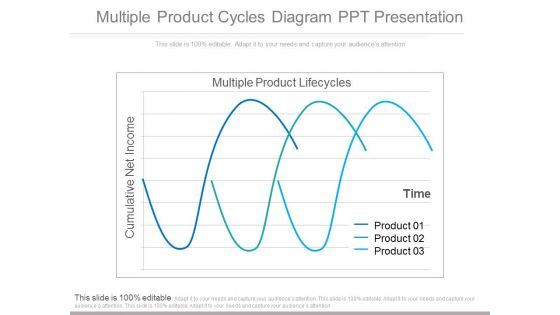
Multiple Product Cycles Diagram Ppt Presentation
This is a multiple product cycles diagram ppt presentation. This is a three stage process. The stages in this process are multiple product life cycles, cumulative net income.
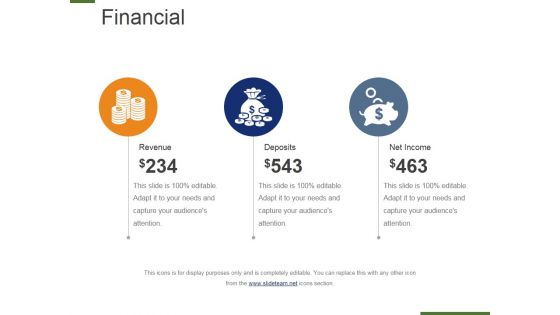
Financial Ppt PowerPoint Presentation Gallery Sample
This is a financial ppt powerpoint presentation gallery sample. This is a three stage process. The stages in this process are revenue, deposits, net income.

Financial Ppt PowerPoint Presentation Ideas Template
This is a financial ppt powerpoint presentation ideas template. This is a three stage process. The stages in this process are revenue, deposits, net income.
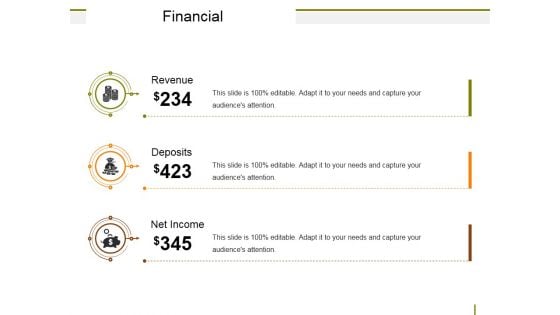
Financial Ppt PowerPoint Presentation Ideas Guide
This is a financial ppt powerpoint presentation ideas guide. This is a three stage process. The stages in this process are revenue, deposits, net income.
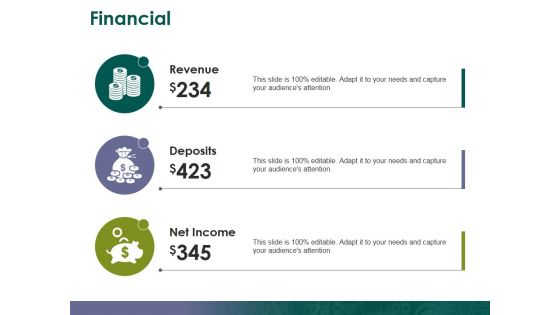
Financial Ppt PowerPoint Presentation Model Show
This is a financial ppt powerpoint presentation model show. This is a three stage process. The stages in this process are revenue deposits, net income, financial.

Financial Ppt PowerPoint Presentation Infographic Template Example Introduction
This is a financial ppt powerpoint presentation infographic template example introduction. This is a three stage process. The stages in this process are financial, revenue, deposits, net income.
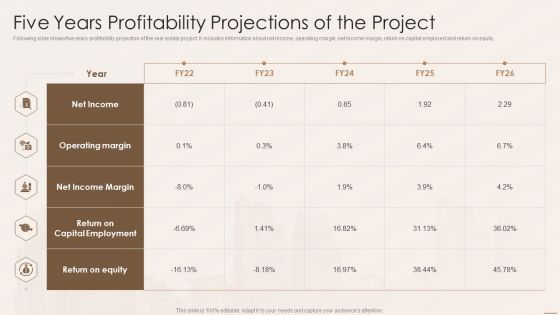
Real Estate Developers Funding Alternatives Five Years Profitability Projections Of The Project Ideas PDF
Following slide shows five years profitability projection of the real estate project. It includes information about net income, operating margin, net income margin, return on capital employed and return on equity. Deliver and pitch your topic in the best possible manner with this Real Estate Developers Funding Alternatives Five Years Profitability Projections Of The Project Ideas PDF. Use them to share invaluable insights on Net Income, Operating Margin, Net Income Margin and impress your audience. This template can be altered and modified as per your expectations. So, grab it now.

Capital Investment Options Five Years Profitability Projections Of The Project Download PDF
Following slide shows five years profitability projection of the real estate project. It includes information about net income, operating margin, net income margin, return on capital employed and return on equity. Deliver and pitch your topic in the best possible manner with this Capital Investment Options Five Years Profitability Projections Of The Project Download PDF. Use them to share invaluable insights on Operating Margin, Net Income, Net Income Margin and impress your audience. This template can be altered and modified as per your expectations. So, grab it now.
Roadmap For Financial Accounting Transformation Key Performance Indicators To Track The Success Of Accounting Icons PDF
The slide shows key Performance Indicator KPI which will help the company to track the success of Accounting and Finance Transformation. Major KPIs include revenue, operating profit margin, net profit margin, invoice errors, net discount etc. Deliver an awe inspiring pitch with this creative roadmap for financial accounting transformation key performance indicators to track the success of accounting icons pdf bundle. Topics like revenue, operating profit margin, net profit margin, invoice errors, net discount can be discussed with this completely editable template. It is available for immediate download depending on the needs and requirements of the user.
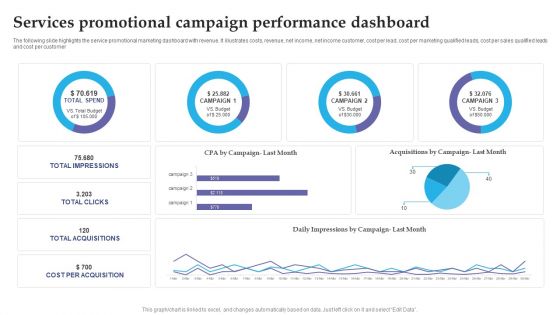
Services Promotional Campaign Performance Dashboard Slides PDF
The following slide highlights the service promotional marketing dashboard with revenue. It illustrates costs, revenue, net income, net income customer, cost per lead, cost per marketing qualified leads, cost per sales qualified leads and cost per customer. Pitch your topic with ease and precision using this Services Promotional Campaign Performance Dashboard Slides PDF. This layout presents information on Services Promotional, Campaign Performance Dashboard. It is also available for immediate download and adjustment. So, changes can be made in the color, design, graphics or any other component to create a unique layout.
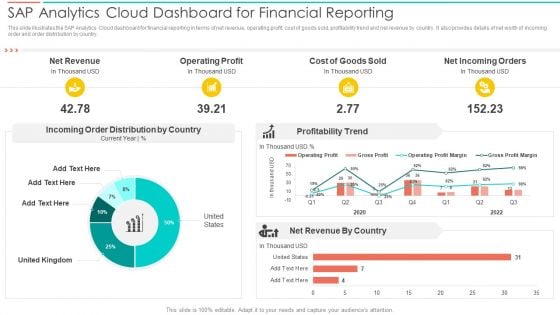
SAC Planning And Implementation SAP Analytics Cloud Dashboard For Financial Reporting Introduction PDF
This slide illustrates the SAP Analytics Cloud dashboard for financial reporting in terms of net revenue, operating profit, cost of goods sold, profitability trend and net revenue by country. It also provides details of net worth of incoming order and order distribution by country. Deliver an awe inspiring pitch with this creative SAC Planning And Implementation SAP Analytics Cloud Dashboard For Financial Reporting Introduction PDF bundle. Topics like Net Revenue, Operating Profit, Cost Goods Sold can be discussed with this completely editable template. It is available for immediate download depending on the needs and requirements of the user.
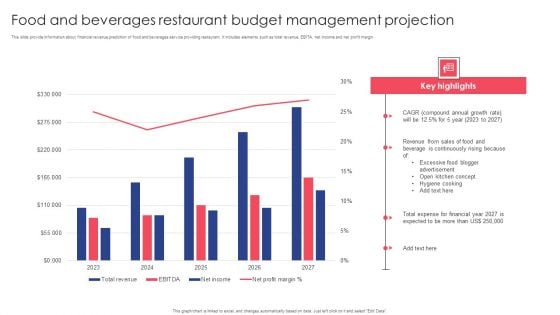
Food And Beverages Restaurant Budget Management Projection Brochure PDF
This slide provide information about financial revenue prediction of food and beverages service providing restaurant. It includes elements such as total revenue, EBITA, net income and net profit margin. Showcasing this set of slides titled Food And Beverages Restaurant Budget Management Projection Brochure PDF. The topics addressed in these templates are Compound Annual, Sales Food, Continuously Rising. All the content presented in this PPT design is completely editable. Download it and make adjustments in color, background, font etc. as per your unique business setting.
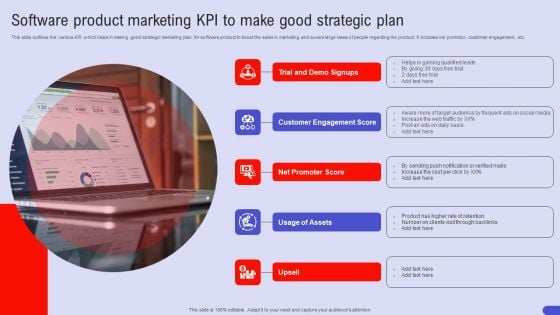
Software Product Marketing Kpi To Make Good Strategic Plan Infographics PDF
This slide outlines the various KPI which helps in making good strategic marketing plan for software product to boost the sales in marketing and aware large mass of people regarding the product. It includes net promotor, customer engagement, etc. Persuade your audience using this Software Product Marketing Kpi To Make Good Strategic Plan Infographics PDF. This PPT design covers five stages, thus making it a great tool to use. It also caters to a variety of topics including Customer Engagement Score, Net Promoter Score, Trial And Demo Signups. Download this PPT design now to present a convincing pitch that not only emphasizes the topic but also showcases your presentation skills.
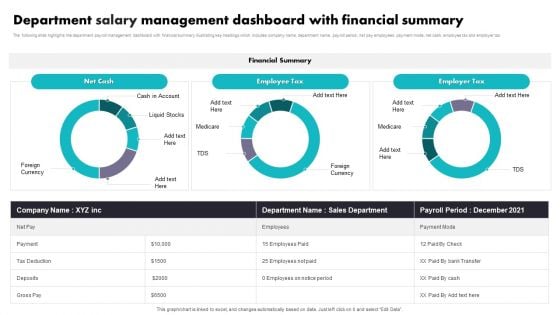
Department Salary Management Dashboard With Financial Summary Portrait PDF
The following slide highlights the department payroll management dashboard with financial summary illustrating key headings which includes company name, department name, payroll period, net pay employees, payment mode, net cash, employee tax and employer tax. Showcasing this set of slides titled Department Salary Management Dashboard With Financial Summary Portrait PDF. The topics addressed in these templates are Sales Department, Employee Tax, Financial Summary. All the content presented in this PPT design is completely editable. Download it and make adjustments in color, background, font etc. as per your unique business setting.
Key Product Distribution Channels Partner Growth Goals Ppt Infographic Template Icons PDF
Presenting this set of slides with name key product distribution channels partner growth goals ppt infographic template icons pdf. The topics discussed in these slides are revenue, profit margin, net new customers, customer satisfaction, net promoter. This is a completely editable PowerPoint presentation and is available for immediate download. Download now and impress your audience.
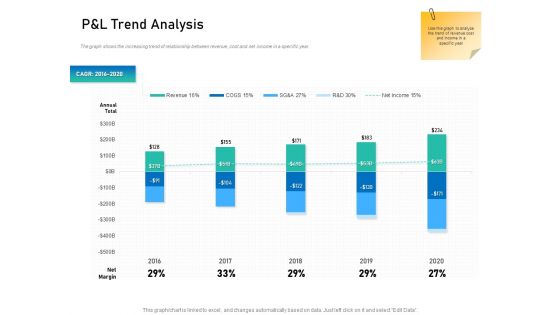
Alliance Evaluation P And L Trend Analysis Ppt Professional Smartart PDF
Presenting this set of slides with name alliance evaluation p and l trend analysis ppt professional smartart pdf. The topics discussed in these slides are revenue, net margin, cost, net income. This is a completely editable PowerPoint presentation and is available for immediate download. Download now and impress your audience.
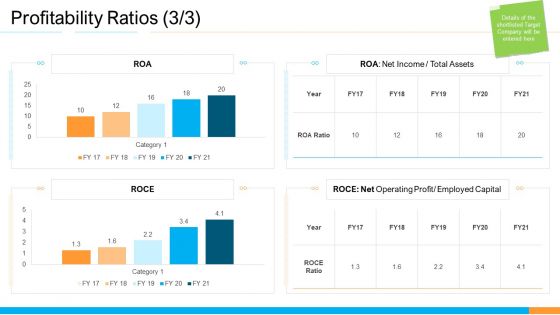
Business Takeover Plan For Inorganic Growth Profitability Ratios Total Rules PDF
Deliver an awe inspiring pitch with this creative business takeover plan for inorganic growth profitability ratios total rules pdfbundle. Topics like roa net income total assets, roce net operating profit or employed capital, roce ratio can be discussed with this completely editable template. It is available for immediate download depending on the needs and requirements of the user.
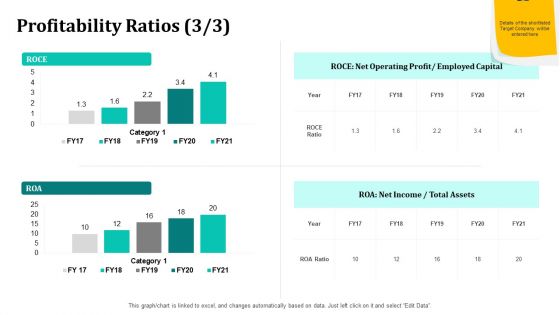
Merger And Acquisition Strategy For Inorganic Growth Profitability Ratios Capital Ppt Pictures Ideas PDF
Deliver an awe inspiring pitch with this creative merger and acquisition strategy for inorganic growth profitability ratios capital ppt pictures ideas pdf bundle. Topics like profitability ratios, net operating profit, net income can be discussed with this completely editable template. It is available for immediate download depending on the needs and requirements of the user.
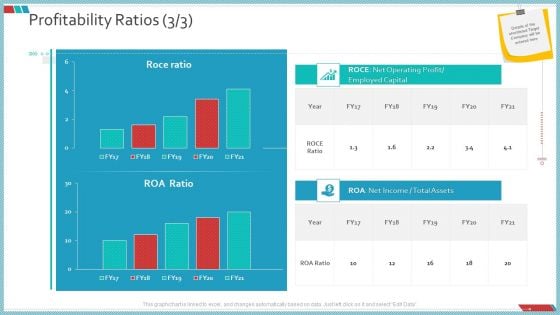
Enterprise Action Plan For Growth Profitability Ratios Roce Introduction PDF
Deliver and pitch your topic in the best possible manner with this enterprise action plan for growth profitability ratios roce introduction pdf. Use them to share invaluable insights on roce net operating profit or employed capital, roa net income or total assets, roce ratio and impress your audience. This template can be altered and modified as per your expectations. So, grab it now.
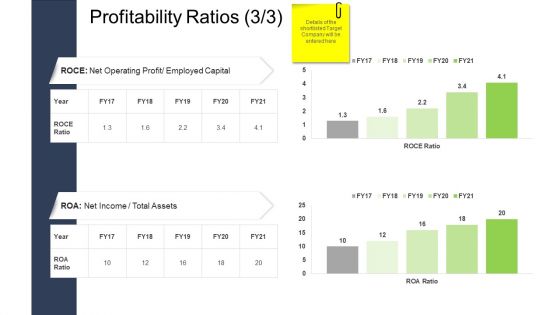
Tactical Merger Profitability Ratios Assets Ppt File Sample PDF
Deliver and pitch your topic in the best possible manner with this tactical merger profitability ratios assets ppt file sample pdf. Use them to share invaluable insights on net income, total assets, net operating profit, employed capital and impress your audience. This template can be altered and modified as per your expectations. So, grab it now.
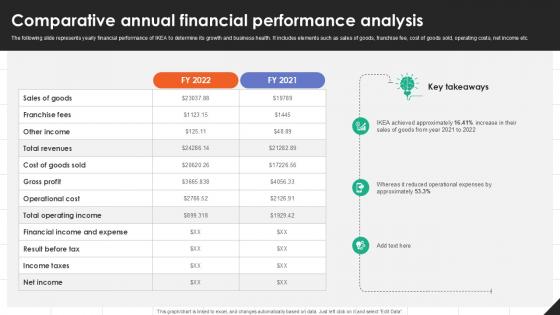
Comparative Annual Financial IKEAs Successful Market Expansion PPT Slide Strategy SS V
The following slide represents yearly financial performance of IKEA to determine its growth and business health. It includes elements such as sales of goods, franchise fee, cost of goods sold, operating costs, net income etc. From laying roadmaps to briefing everything in detail, our templates are perfect for you. You can set the stage with your presentation slides. All you have to do is download these easy-to-edit and customizable templates. Comparative Annual Financial IKEAs Successful Market Expansion PPT Slide Strategy SS V will help you deliver an outstanding performance that everyone would remember and praise you for. Do download this presentation today. The following slide represents yearly financial performance of IKEA to determine its growth and business health. It includes elements such as sales of goods, franchise fee, cost of goods sold, operating costs, net income etc.
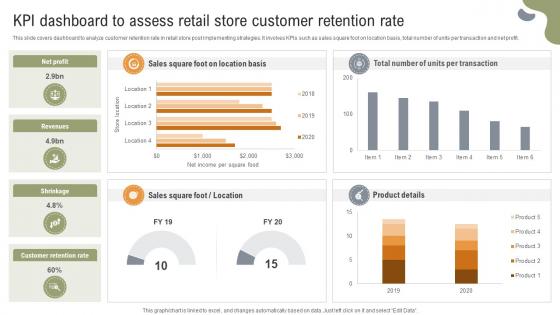
Implementing Strategies To Enhance Grocery KPI Dashboard To Assess Retail Store Customer
This slide covers dashboard to analyze customer retention rate in retail store post implementing strategies. It involves KPIs such as sales square foot on location basis, total number of units per transaction and net profit. Crafting an eye-catching presentation has never been more straightforward. Let your presentation shine with this tasteful yet straightforward Implementing Strategies To Enhance Grocery KPI Dashboard To Assess Retail Store Customer template. It offers a minimalistic and classy look that is great for making a statement. The colors have been employed intelligently to add a bit of playfulness while still remaining professional. Construct the ideal Implementing Strategies To Enhance Grocery KPI Dashboard To Assess Retail Store Customer that effortlessly grabs the attention of your audience Begin now and be certain to wow your customers This slide covers dashboard to analyze customer retention rate in retail store post implementing strategies. It involves KPIs such as sales square foot on location basis, total number of units per transaction and net profit.
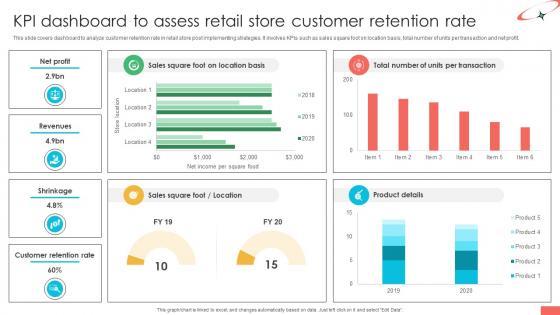
Marketing Strategies For Effective Retail KPI Dashboard To Assess Retail Store Customer
This slide covers dashboard to analyze customer retention rate in retail store post implementing strategies. It involves KPIs such as sales square foot on location basis, total number of units per transaction and net profit. Slidegeeks is one of the best resources for PowerPoint templates. You can download easily and regulate Marketing Strategies For Effective Retail KPI Dashboard To Assess Retail Store Customer for your personal presentations from our wonderful collection. A few clicks is all it takes to discover and get the most relevant and appropriate templates. Use our Templates to add a unique zing and appeal to your presentation and meetings. All the slides are easy to edit and you can use them even for advertisement purposes. This slide covers dashboard to analyze customer retention rate in retail store post implementing strategies. It involves KPIs such as sales square foot on location basis, total number of units per transaction and net profit.
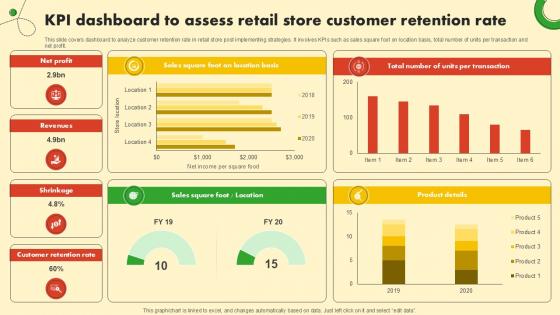
KPI Dashboard To Assess Retail Store Food And Grocery Retail Ppt Presentation
This slide covers dashboard to analyze customer retention rate in retail store post implementing strategies. It involves KPIs such as sales square foot on location basis, total number of units per transaction and net profit. Present like a pro with KPI Dashboard To Assess Retail Store Food And Grocery Retail Ppt Presentation. Create beautiful presentations together with your team, using our easy-to-use presentation slides. Share your ideas in real-time and make changes on the fly by downloading our templates. So whether you are in the office, on the go, or in a remote location, you can stay in sync with your team and present your ideas with confidence. With Slidegeeks presentation got a whole lot easier. Grab these presentations today. This slide covers dashboard to analyze customer retention rate in retail store post implementing strategies. It involves KPIs such as sales square foot on location basis, total number of units per transaction and net profit.
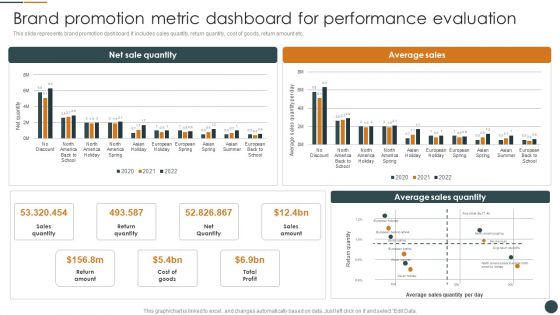
Brand Promotion Metric Dashboard For Performance Evaluation Brand Promotion Techniques To Enhance Download PDF
This slide represents brand promotion dashboard. It includes sales quantity, return quantity, cost of goods, return amount etc.Deliver an awe inspiring pitch with this creative Brand Promotion Metric Dashboard For Performance Evaluation Brand Promotion Techniques To Enhance Download PDF bundle. Topics like Return Quantity, Net Quantity, Return Amount can be discussed with this completely editable template. It is available for immediate download depending on the needs and requirements of the user.
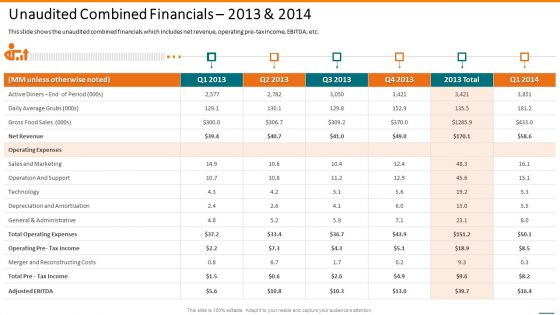
Grubhub Fund Raising Elevator Unaudited Combined Financials 2013 And 2014 Themes PDF
This slide shows the unaudited combined financials which includes net revenue, operating pre tax income, EBITDA, etc. Deliver and pitch your topic in the best possible manner with this grubhub fund raising elevator unaudited combined financials 2013 and 2014 themes pdf. Use them to share invaluable insights on operating expenses, technology, tax income, sales and impress your audience. This template can be altered and modified as per your expectations. So, grab it now.
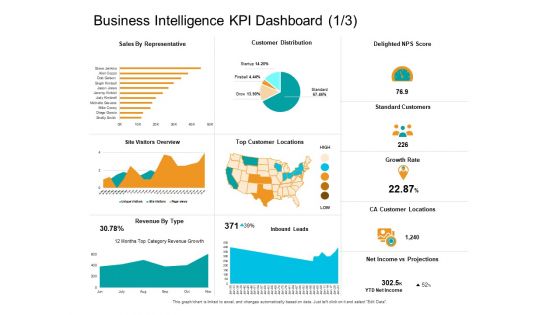
Facts Assessment Business Intelligence KPI Dashboard Expenses Ppt PowerPoint Presentation Layouts Background Images PDF
Presenting this set of slides with name facts assessment business intelligence kpi dashboard expenses ppt powerpoint presentation layouts background images pdf. The topics discussed in these slides are sales representative, delighted nps score, standard customers, growth rate, ca customer locations, net income vs projections, revenue type, top customer locations, customer distribution. This is a completely editable PowerPoint presentation and is available for immediate download. Download now and impress your audience.
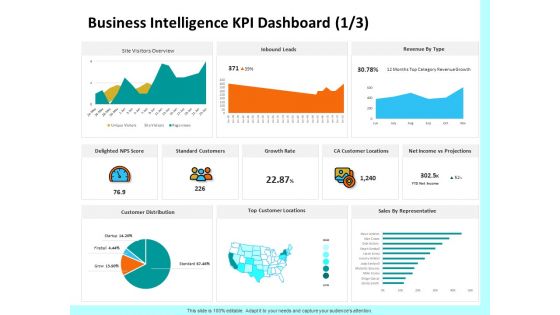
Firm Productivity Administration Business Intelligence KPI Dashboard Score Ppt PowerPoint Presentation Infographic Template Display PDF
Presenting this set of slides with name firm productivity administration business intelligence kpi dashboard score ppt powerpoint presentation infographic template display pdf. The topics discussed in these slides are sales representative, delighted nps score, standard customers, growth rate, ca customer locations, net income vs projections, revenue type, top customer locations, customer distribution. This is a completely editable PowerPoint presentation and is available for immediate download. Download now and impress your audience.

Enterprise Problem Solving And Intellect Business Intelligence KPI Dashboard Growth Ppt PowerPoint Presentation Model Images PDF
Presenting this set of slides with name enterprise problem solving and intellect business intelligence kpi dashboard growth ppt powerpoint presentation model images pdf. The topics discussed in these slides are sales representative, delighted nps score, standard customers, growth rate, ca customer locations, net income vs projections, revenue type, top customer locations, customer distribution. This is a completely editable PowerPoint presentation and is available for immediate download. Download now and impress your audience.
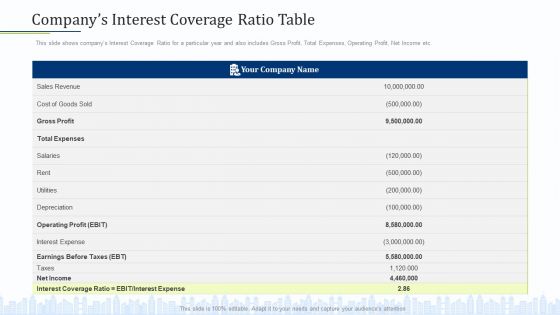
Pitch Deck Draw External Capital From Commercial Banking Institution Companys Interest Coverage Ratio Table Clipart PDF
This slide shows companys Interest Coverage Ratio for a particular year and also includes Gross Profit, Total Expenses, Operating Profit, Net Income etc.Deliver and pitch your topic in the best possible manner with this pitch deck draw external capital from commercial banking institution companys interest coverage ratio table clipart pdf. Use them to share invaluable insights on interest expense, total expenses, sales revenue and impress your audience. This template can be altered and modified as per your expectations. So, grab it now.
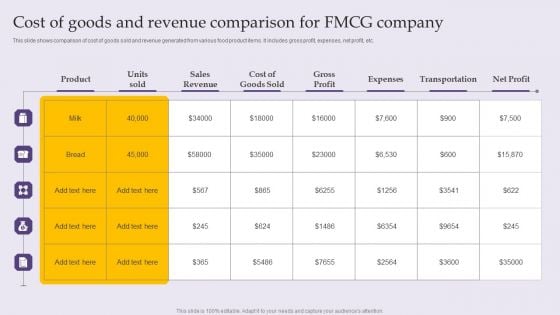
Cost Of Goods And Revenue Comparison For FMCG Company Rules PDF
This slide shows comparison of cost of goods sold and revenue generated from various food product items. It includes gross profit, expenses, net profit, etc.Pitch your topic with ease and precision using this Cost Of Goods And Revenue Comparison For FMCG Company Rules PDF. This layout presents information on Sales Revenue, Gross Profit, Transportation. It is also available for immediate download and adjustment. So, changes can be made in the color, design, graphics or any other component to create a unique layout.
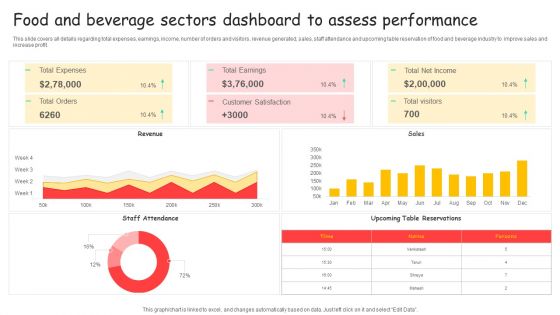
Food And Beverage Sectors Dashboard To Assess Performance Ppt Styles Elements PDF
This slide covers all details regarding total expenses, earnings, income, number of orders and visitors, revenue generated, sales, staff attendance and upcoming table reservation of food and beverage industry to improve sales and increase profit. Showcasing this set of slides titled Food And Beverage Sectors Dashboard To Assess Performance Ppt Styles Elements PDF. The topics addressed in these templates are Total Expenses, Total Earnings, Total Net Income. All the content presented in this PPT design is completely editable. Download it and make adjustments in color, background, font etc. as per your unique business setting.
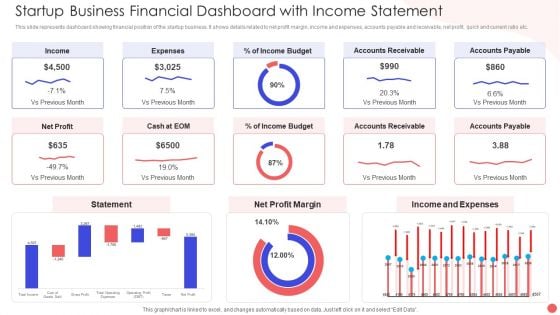
Startup Business Financial Dashboard With Income Statement Portrait PDF
This slide represents dashboard showing financial position of the startup business. It shows details related to net profit margin, income and expenses, accounts payable and receivable, net profit, quick and current ratio etc. Showcasing this set of slides titled Startup Business Financial Dashboard With Income Statement Portrait PDF. The topics addressed in these templates are Accounts Receivable Income, Income And Expenses, Net Profit Margin. All the content presented in this PPT design is completely editable. Download it and make adjustments in color, background, font etc. as per your unique business setting.
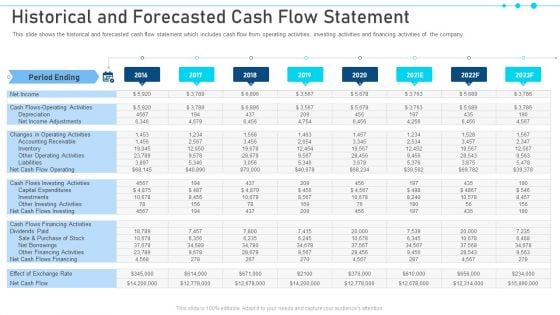
Pitch Deck For Raising Capital From Business Finances Historical And Forecasted Cash Flow Statement Diagrams PDF
This slide shows the historical and forecasted cash flow statement which includes cash flow from operating activities, investing activities and financing activities of the company. Deliver an awe-inspiring pitch with this creative pitch deck for raising capital from business finances historical and forecasted cash flow statement diagrams pdf. bundle. Topics like net income, net income adjustments, effect of exchange rate, net cash flows investing, purchase of stock can be discussed with this completely editable template. It is available for immediate download depending on the needs and requirements of the user.
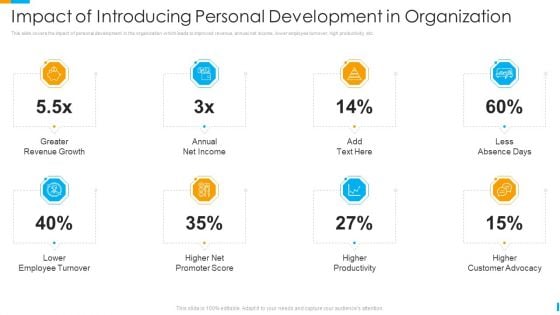
Business Journey Impact Of Introducing Personal Development In Organization Ppt Styles PDF
This slide covers the impact of personal development in the organization which leads to improved revenue, annual net income, lower employee turnover, high productivity, etc. Presenting business journey impact of introducing personal development in organization ppt styles pdf to provide visual cues and insights. Share and navigate important information on eight stages that need your due attention. This template can be used to pitch topics like higher productivity, greater revenue growth, annual net income, higher customer advocacy, higher net promoter score. In addtion, this PPT design contains high resolution images, graphics, etc, that are easily editable and available for immediate download.
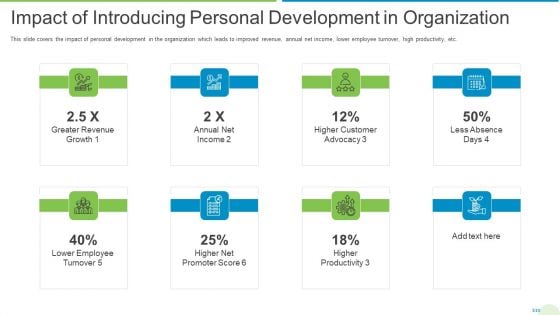
Employee Journey In Company Impact Of Introducing Personal Development In Organization Brochure PDF
This slide covers the impact of personal development in the organization which leads to improved revenue, annual net income, lower employee turnover, high productivity, etc. Presenting employee journey in company impact of introducing personal development in organization brochure pdf to provide visual cues and insights. Share and navigate important information on eight stages that need your due attention. This template can be used to pitch topics like higher productivity, greater revenue growth, annual net income, higher customer advocacy, higher net promoter score. In addtion, this PPT design contains high resolution images, graphics, etc, that are easily editable and available for immediate download.

Comparative Dupont Analysis For Three Companies Mockup PDF
The following slide highlights the comparative dupont analysis for three companies illustrating particulars and equations, where particulars consists of net income, revenue, average assets, average equity, net profit margin, total asset turnover, financial leverage and return on equity. Pitch your topic with ease and precision using this Comparative Dupont Analysis For Three Companies Mockup PDF. This layout presents information on Average Equity, Net Profit Margin, Return On Equity. It is also available for immediate download and adjustment. So, changes can be made in the color, design, graphics or any other component to create a unique layout.

Return On Investment For New Apparel Business Market Entry Approach For Apparel Sector Topics PDF
This slide covers return on funding for the new apparel business in new market. It includes details such as year-on-year investment change, net income change, sequence net investment change, and net income change.Deliver an awe inspiring pitch with this creative Return On Investment For New Apparel Business Market Entry Approach For Apparel Sector Topics PDF bundle. Topics like Investment Change, Investment, Income Change can be discussed with this completely editable template. It is available for immediate download depending on the needs and requirements of the user.
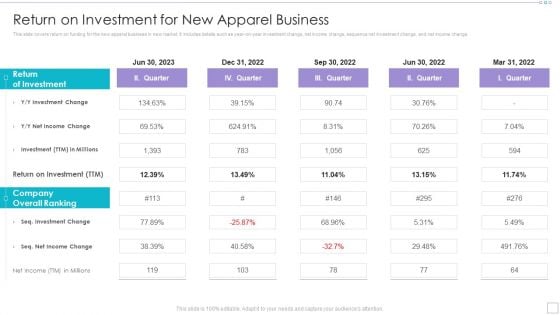
Clothing Business Market Entry Strategy Return On Investment For New Apparel Business Structure PDF
This slide covers return on funding for the new apparel business in new market. It includes details such as year on year investment change, net income change, sequence net investment change, and net income change. Deliver an awe inspiring pitch with this creative Clothing Business Market Entry Strategy Return On Investment For New Apparel Business Structure PDF bundle. Topics like Return Of Investment, Overall Ranking, Investment can be discussed with this completely editable template. It is available for immediate download depending on the needs and requirements of the user.
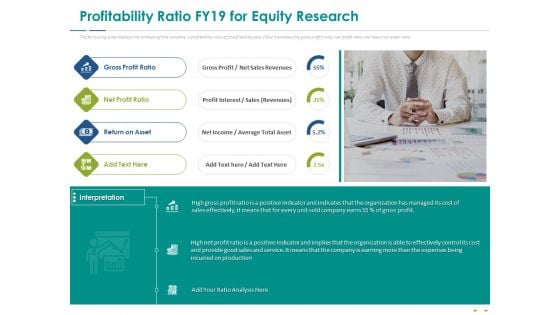
Stock Market Research Report Profitability Ratio FY19 For Equity Research Ideas PDF
The following slide displays the analysis of the companys profitability ratio of the financial year 19 as it analysis the gross profit ratio, net profit ratio and return on asset ratio. This is a stock market research report profitability ratio fy19 for equity research ideas pdf template with various stages. Focus and dispense information on four stages using this creative set, that comes with editable features. It contains large content boxes to add your information on topics like gross profit ratio, net profit ratio, return on asset, net income. You can also showcase facts, figures, and other relevant content using this PPT layout. Grab it now.
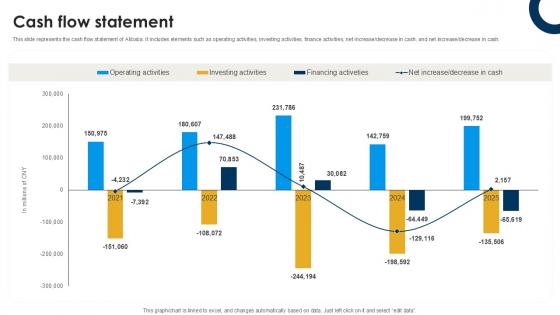
Cash Flow Statement International Trade Of Products And Services PPT Template CP SS V
This slide represents the cash flow statement of Alibaba. It includes elements such as operating activities, investing activities, finance activities, net increasedecrease in cash, and net increasedecrease in cash. Want to ace your presentation in front of a live audience Our Cash Flow Statement International Trade Of Products And Services PPT Template CP SS V can help you do that by engaging all the users towards you. Slidegeeks experts have put their efforts and expertise into creating these impeccable powerpoint presentations so that you can communicate your ideas clearly. Moreover, all the templates are customizable, and easy-to-edit and downloadable. Use these for both personal and commercial use. This slide represents the cash flow statement of Alibaba. It includes elements such as operating activities, investing activities, finance activities, net increasedecrease in cash, and net increasedecrease in cash.
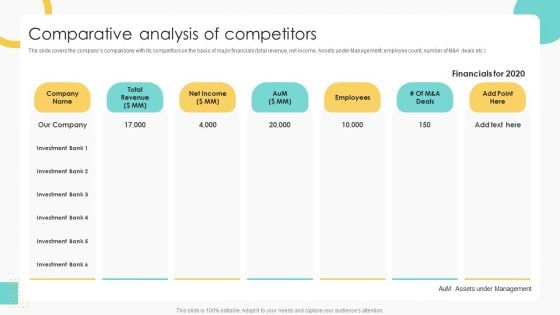
Buy Side Merger And Acquisition Pitch Book Comparative Analysis Of Competitors Summary PDF
The slide covers the companys comparisons with its competitors on the basis of major financials total revenue, net income, Assets under Management, employee count, number of M and A deals etc. Deliver an awe inspiring pitch with this creative Buy Side Merger And Acquisition Pitch Book Comparative Analysis Of Competitors Summary PDF bundle. Topics like Total Revenue, Net Income, Employees can be discussed with this completely editable template. It is available for immediate download depending on the needs and requirements of the user.
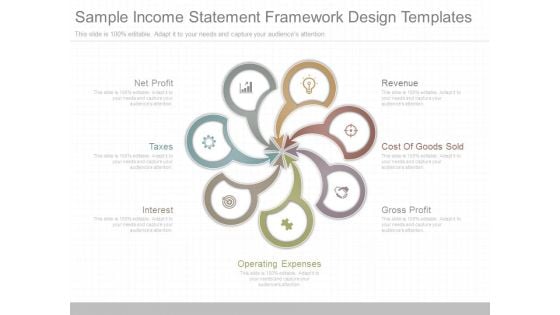
Sample Income Statement Framework Design Templates
This is a sample income statement framework design templates. This is a seven stage process. The stages in this process are net profit, taxes, interest, revenue, cost of goods sold, gross profit, operating expenses.
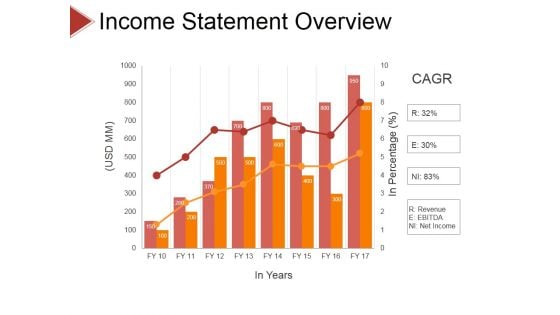
Income Statement Overview Ppt PowerPoint Presentation Slides Samples
This is a income statement overview ppt powerpoint presentation slides samples. This is a eight stage process. The stages in this process are business, strategy, analysis, pretention, revenue, ebitda, net income.
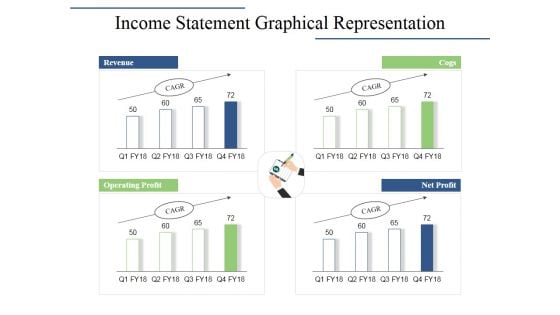
Income Statement Graphical Representation Ppt PowerPoint Presentation Infographics Layouts
This is a income statement graphical representation ppt powerpoint presentation infographics layouts. This is a four stage process. The stages in this process are revenue, cogs, operating profit, net profit.

Income Statement Graphical Representation Ppt PowerPoint Presentation Layouts Designs Download
This is a income statement graphical representation ppt powerpoint presentation layouts designs download. This is a four stage process. The stages in this process are revenue, cogs, operating profit, net profit.

Income Statement Graphical Representation Ppt PowerPoint Presentation Summary Inspiration
This is a income statement graphical representation ppt powerpoint presentation summary inspiration. This is a four stage process. The stages in this process are revenue, cogs, operating profit, net profit.


 Continue with Email

 Home
Home


