Note Icon
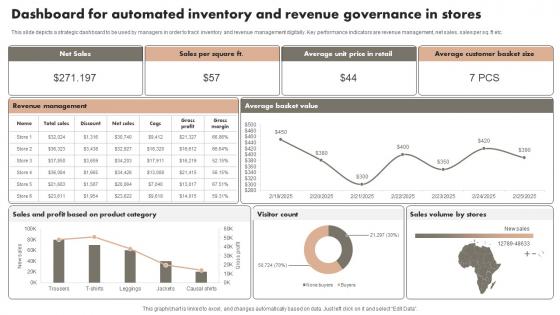
Dashboard For Automated Inventory And Revenue Governance In Stores Microsoft Pdf
This slide depicts a strategic dashboard to be used by managers in order to track inventory and revenue management digitally. Key performance indicators are revenue management, net sales, sales per sq. ft etc. Pitch your topic with ease and precision using this Dashboard For Automated Inventory And Revenue Governance In Stores Microsoft Pdf. This layout presents information on Net Sales, Stores, Category. It is also available for immediate download and adjustment. So, changes can be made in the color, design, graphics or any other component to create a unique layout. This slide depicts a strategic dashboard to be used by managers in order to track inventory and revenue management digitally. Key performance indicators are revenue management, net sales, sales per sq. ft etc.
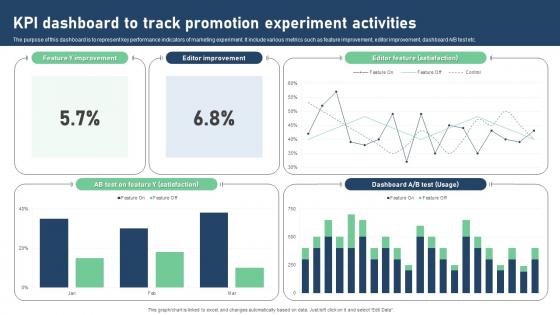
Kpi Dashboard To Track Promotion Experiment Activities Portrait Pdf
The purpose of this dashboard is to represent key performance indicators of marketing experiment. It include various metrics such as feature improvement, editor improvement, dashboard A or B test etc. Pitch your topic with ease and precision using this Kpi Dashboard To Track Promotion Experiment Activities Portrait Pdf. This layout presents information on KPI Dashboard, Track Promotion, Experiment Activities, Editor Improvement. It is also available for immediate download and adjustment. So, changes can be made in the color, design, graphics or any other component to create a unique layout. The purpose of this dashboard is to represent key performance indicators of marketing experiment. It include various metrics such as feature improvement, editor improvement, dashboard A or B test etc.
Kpi Dashboard For Tracking Virtual Security Hazards Of Healthcare Organization Professional Pdf
This slide depicts dashboard for tracking cyber security risks faced by healthcare organizations to effectively manage the major threats and take action accordingly. The key performing indicators are percentage of risks exceeding threshold limit, breakdown of threat rating, action plan etc. Showcasing this set of slides titled Kpi Dashboard For Tracking Virtual Security Hazards Of Healthcare Organization Professional Pdf. The topics addressed in these templates are Analysis Progress, Resolution Progress, Threshold Limit. All the content presented in this PPT design is completely editable. Download it and make adjustments in color, background, font etc. as per your unique business setting. This slide depicts dashboard for tracking cyber security risks faced by healthcare organizations to effectively manage the major threats and take action accordingly. The key performing indicators are percentage of risks exceeding threshold limit, breakdown of threat rating, action plan etc.
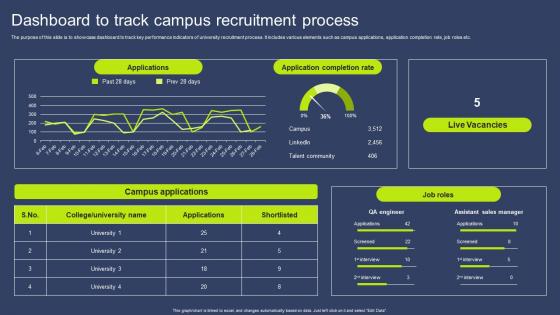
Dashboard To Track Campus Recruitment Process Clipart Pdf
The purpose of this slide is to showcase dashboard to track key performance indicators of university recruitment process. It includes various elements such as campus applications, application completion rate, job roles etc. Showcasing this set of slides titled Dashboard To Track Campus Recruitment Process Clipart Pdf. The topics addressed in these templates are Applications, Application Completion Rate, Live Vacancies. All the content presented in this PPT design is completely editable. Download it and make adjustments in color, background, font etc. as per your unique business setting. The purpose of this slide is to showcase dashboard to track key performance indicators of university recruitment process. It includes various elements such as campus applications, application completion rate, job roles etc.
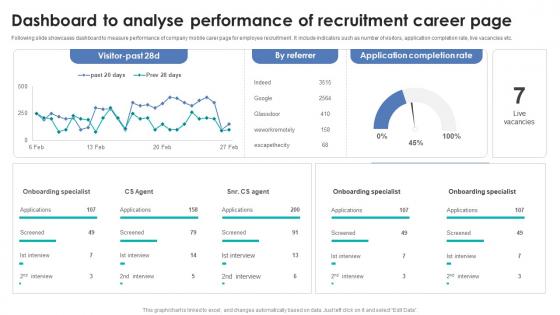
Integrating Automation For Effective Business Dashboard To Analyse Performance Of Recruitment
Following slide showcases dashboard to measure performance of company mobile carer page for employee recruitment . It include indicators such as number of visitors, application completion rate, live vacancies etc. Present like a pro with Integrating Automation For Effective Business Dashboard To Analyse Performance Of Recruitment. Create beautiful presentations together with your team, using our easy-to-use presentation slides. Share your ideas in real-time and make changes on the fly by downloading our templates. So whether you are in the office, on the go, or in a remote location, you can stay in sync with your team and present your ideas with confidence. With Slidegeeks presentation got a whole lot easier. Grab these presentations today. Following slide showcases dashboard to measure performance of company mobile carer page for employee recruitment . It include indicators such as number of visitors, application completion rate, live vacancies etc.
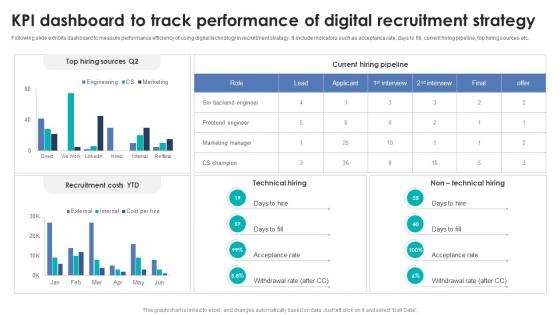
Integrating Automation For Effective Business Kpi Dashboard To Track Performance Of Digital
Following slide exhibits dashboard to measure performance efficiency of using digital technology in recruitment strategy. It include indicators such as acceptance rate, days to fill, current hiring pipeline, top hiring sources etc. Crafting an eye-catching presentation has never been more straightforward. Let your presentation shine with this tasteful yet straightforward Integrating Automation For Effective Business Kpi Dashboard To Track Performance Of Digital template. It offers a minimalistic and classy look that is great for making a statement. The colors have been employed intelligently to add a bit of playfulness while still remaining professional. Construct the ideal Integrating Automation For Effective Business Kpi Dashboard To Track Performance Of Digital that effortlessly grabs the attention of your audience Begin now and be certain to wow your customers Following slide exhibits dashboard to measure performance efficiency of using digital technology in recruitment strategy. It include indicators such as acceptance rate, days to fill, current hiring pipeline, top hiring sources etc.
Web Consulting Business Various Kpis For Tracking Business Performance
Mentioned slide provide insights into various key performance indicators to determine business performance. It includes KPIs such as business financials, website traffic, customer case, customer engagement, conversion rate, customer retention, customer bounce rate, employee turnover, etc. This modern and well-arranged Web Consulting Business Various Kpis For Tracking Business Performance provides lots of creative possibilities. It is very simple to customize and edit with the Powerpoint Software. Just drag and drop your pictures into the shapes. All facets of this template can be edited with Powerpoint, no extra software is necessary. Add your own material, put your images in the places assigned for them, adjust the colors, and then you can show your slides to the world, with an animated slide included. Mentioned slide provide insights into various key performance indicators to determine business performance. It includes KPIs such as business financials, website traffic, customer case, customer engagement, conversion rate, customer retention, customer bounce rate, employee turnover, etc.
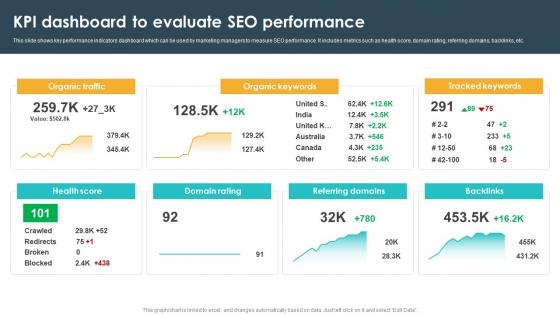
Kpi Dashboard To Evaluate Seo Performance Seo Content Plan To Drive Strategy SS V
This slide shows key performance indicators dashboard which can be used by marketing managers to measure SEO performance. It includes metrics such as health score, domain rating, referring domains, backlinks, etc. Welcome to our selection of the Kpi Dashboard To Evaluate Seo Performance Seo Content Plan To Drive Strategy SS V These are designed to help you showcase your creativity and bring your sphere to life. Planning and Innovation are essential for any business that is just starting out. This collection contains the designs that you need for your everyday presentations. All of our PowerPoints are 100Percent editable, so you can customize them to suit your needs. This multi-purpose template can be used in various situations. Grab these presentation templates today. This slide shows key performance indicators dashboard which can be used by marketing managers to measure SEO performance. It includes metrics such as health score, domain rating, referring domains, backlinks, etc.
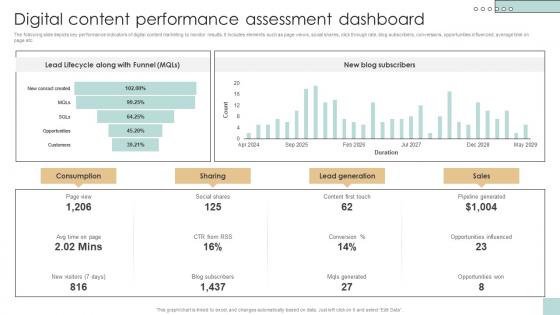
Digital Content Performance Assessment Developing And Creating Digital Content Strategy SS V
The following slide depicts key performance indicators of digital content marketing to monitor results. It includes elements such as page views, social shares, click through rate, blog subscribers, conversions, opportunities influenced, average time on page etc. If your project calls for a presentation, then Slidegeeks is your go-to partner because we have professionally designed, easy-to-edit templates that are perfect for any presentation. After downloading, you can easily edit Digital Content Performance Assessment Developing And Creating Digital Content Strategy SS V and make the changes accordingly. You can rearrange slides or fill them with different images. Check out all the handy templates The following slide depicts key performance indicators of digital content marketing to monitor results. It includes elements such as page views, social shares, click through rate, blog subscribers, conversions, opportunities influenced, average time on page etc.
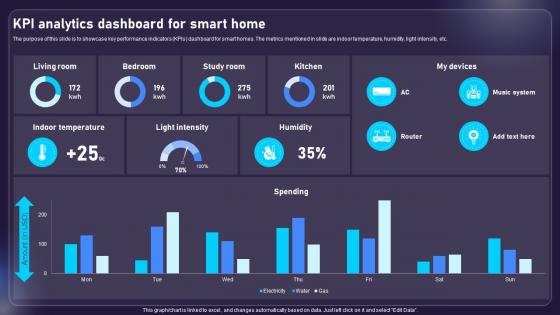
Kpi Analytics Dashboard For Smart Home AIOT Applications For Various Industries IoT SS V
The purpose of this slide is to showcase key performance indicators KPIs dashboard for smart homes. The metrics mentioned in slide are indoor temperature, humidity, light intensity, etc. Slidegeeks has constructed Kpi Analytics Dashboard For Smart Home AIOT Applications For Various Industries IoT SS V after conducting extensive research and examination. These presentation templates are constantly being generated and modified based on user preferences and critiques from editors. Here, you will find the most attractive templates for a range of purposes while taking into account ratings and remarks from users regarding the content. This is an excellent jumping-off point to explore our content and will give new users an insight into our top-notch PowerPoint Templates. The purpose of this slide is to showcase key performance indicators KPIs dashboard for smart homes. The metrics mentioned in slide are indoor temperature, humidity, light intensity, etc.
Smart Attendance Tracking Systems Dashboard Impact Of IoT Technology On Education IoT SS V
Following slide highlights dashboard to monitor and track student attendance by using Io enabled asset tracking devices. It includes indicators such as overtime, statistics, source, exceptions, pending requests, etc. Want to ace your presentation in front of a live audience Our Smart Attendance Tracking Systems Dashboard Impact Of IoT Technology On Education IoT SS V can help you do that by engaging all the users towards you. Slidegeeks experts have put their efforts and expertise into creating these impeccable powerpoint presentations so that you can communicate your ideas clearly. Moreover, all the templates are customizable, and easy-to-edit and downloadable. Use these for both personal and commercial use. Following slide highlights dashboard to monitor and track student attendance by using Io enabled asset tracking devices. It includes indicators such as overtime, statistics, source, exceptions, pending requests, etc.
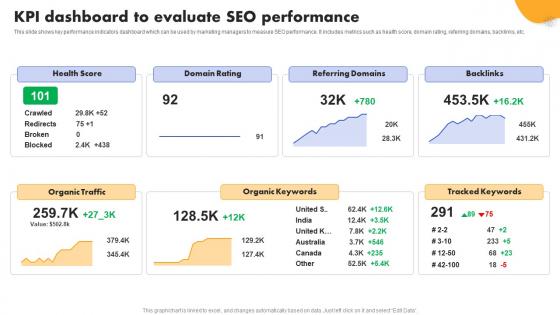
SEO Strategy To Improve KPI Dashboard To Evaluate SEO Performance Strategy SS V
This slide shows key performance indicators dashboard which can be used by marketing managers to measure SEO performance. It includes metrics such as health score, domain rating, referring domains, backlinks, etc. Want to ace your presentation in front of a live audience Our SEO Strategy To Improve KPI Dashboard To Evaluate SEO Performance Strategy SS V can help you do that by engaging all the users towards you. Slidegeeks experts have put their efforts and expertise into creating these impeccable powerpoint presentations so that you can communicate your ideas clearly. Moreover, all the templates are customizable, and easy-to-edit and downloadable. Use these for both personal and commercial use. This slide shows key performance indicators dashboard which can be used by marketing managers to measure SEO performance. It includes metrics such as health score, domain rating, referring domains, backlinks, etc.
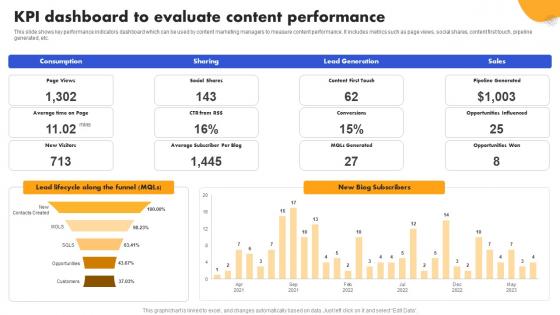
SEO Strategy To Improve ROI KPI Dashboard To Evaluate Content Strategy SS V
This slide shows key performance indicators dashboard which can be used by content marketing managers to measure content performance. It includes metrics such as page views, social shares, content first touch, pipeline generated, etc. Welcome to our selection of the SEO Strategy To Improve ROI KPI Dashboard To Evaluate Content Strategy SS V. These are designed to help you showcase your creativity and bring your sphere to life. Planning and Innovation are essential for any business that is just starting out. This collection contains the designs that you need for your everyday presentations. All of our PowerPoints are 100Percent editable, so you can customize them to suit your needs. This multi-purpose template can be used in various situations. Grab these presentation templates today. This slide shows key performance indicators dashboard which can be used by content marketing managers to measure content performance. It includes metrics such as page views, social shares, content first touch, pipeline generated, etc.
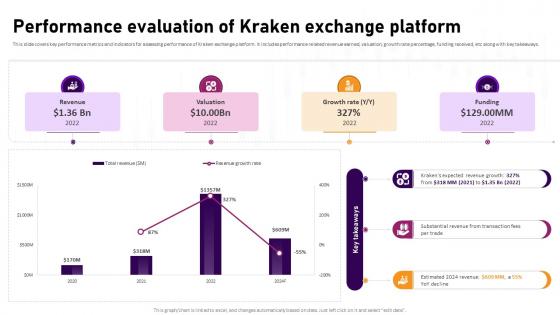
Performance Evaluation Of Kraken Exchange Platform Complete Roadmap To Blockchain BCT SS V
This slide covers key performance metrics and indicators for assessing performance of Kraken exchange platform. It includes performance related revenue earned, valuation, growth rate percentage, funding received, etc along with key takeaways. Find highly impressive Performance Evaluation Of Kraken Exchange Platform Complete Roadmap To Blockchain BCT SS V on Slidegeeks to deliver a meaningful presentation. You can save an ample amount of time using these presentation templates. No need to worry to prepare everything from scratch because Slidegeeks experts have already done a huge research and work for you. You need to download Performance Evaluation Of Kraken Exchange Platform Complete Roadmap To Blockchain BCT SS V for your upcoming presentation. All the presentation templates are 100 percent editable and you can change the color and personalize the content accordingly. Download now This slide covers key performance metrics and indicators for assessing performance of Kraken exchange platform. It includes performance related revenue earned, valuation, growth rate percentage, funding received, etc along with key takeaways.
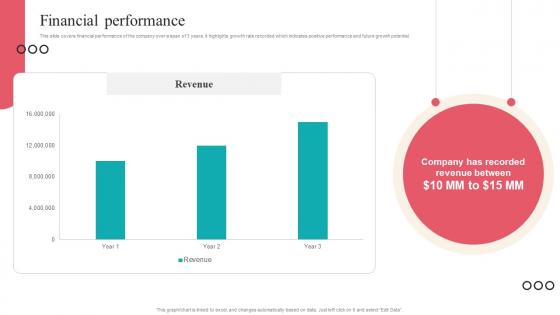
Financial Performance Camera Management Platform Investor Funding Elevator Pitch Deck
This slide covers financial performance of the company over a span of 3 years. It highlights growth rate recorded which indicates positive performance and future growth potential. From laying roadmaps to briefing everything in detail, our templates are perfect for you. You can set the stage with your presentation slides. All you have to do is download these easy-to-edit and customizable templates. Financial Performance Camera Management Platform Investor Funding Elevator Pitch Deck will help you deliver an outstanding performance that everyone would remember and praise you for. Do download this presentation today. This slide covers financial performance of the company over a span of 3 years. It highlights growth rate recorded which indicates positive performance and future growth potential.

Facebook Marketing Plan KPI Dashboard To Monitor Facebook Marketing Strategy SS V
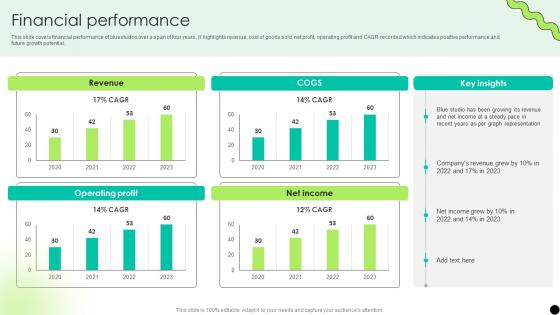
Financial Performance Digital Payment Platform Pitch Deck
This slide covers financial performance of bluestudios over a span of four years. It highlights revenue, cost of goods sold, net profit, operating profit and CAGR recorded which indicates positive performance and future growth potential. From laying roadmaps to briefing everything in detail, our templates are perfect for you. You can set the stage with your presentation slides. All you have to do is download these easy-to-edit and customizable templates. Financial Performance Digital Payment Platform Pitch Deck will help you deliver an outstanding performance that everyone would remember and praise you for. Do download this presentation today. This slide covers financial performance of bluestudios over a span of four years. It highlights revenue, cost of goods sold, net profit, operating profit and CAGR recorded which indicates positive performance and future growth potential.
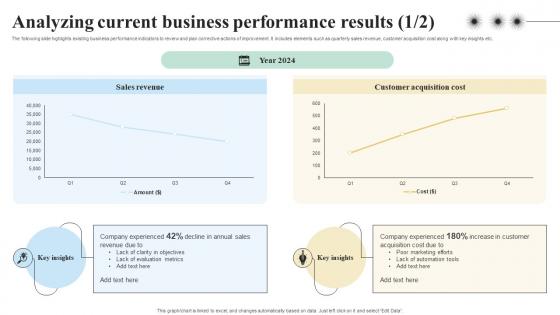
Analyzing Current Business Performance Results Objectives And Key Result Methodology For Business
The following slide highlights existing business performance indicators to review and plan corrective actions of improvement. It includes elements such as quarterly sales revenue, customer acquisition cost along with key insights etc. Slidegeeks is one of the best resources for PowerPoint templates. You can download easily and regulate Analyzing Current Business Performance Results Objectives And Key Result Methodology For Business for your personal presentations from our wonderful collection. A few clicks is all it takes to discover and get the most relevant and appropriate templates. Use our Templates to add a unique zing and appeal to your presentation and meetings. All the slides are easy to edit and you can use them even for advertisement purposes. The following slide highlights existing business performance indicators to review and plan corrective actions of improvement. It includes elements such as quarterly sales revenue, customer acquisition cost along with key insights etc.

Increasing Business Awareness Dashboard To Monitor Pay Per Click Advertising Strategy SS V
This slide represent a search engine marketing KPIs indicating crucial aspects of pay per click advertising. It includes metrics such as cost per conversion by month, overall spend, top keywords, monthly conversion and interaction by day. Get a simple yet stunning designed Increasing Business Awareness Dashboard To Monitor Pay Per Click Advertising Strategy SS V. It is the best one to establish the tone in your meetings. It is an excellent way to make your presentations highly effective. So, download this PPT today from Slidegeeks and see the positive impacts. Our easy-to-edit Increasing Business Awareness Dashboard To Monitor Pay Per Click Advertising Strategy SS V can be your go-to option for all upcoming conferences and meetings. So, what are you waiting for Grab this template today. This slide represent a search engine marketing KPIs indicating crucial aspects of pay per click advertising. It includes metrics such as cost per conversion by month, overall spend, top keywords, monthly conversion and interaction by day.
Cryptocurrency Portfolio Tracking Dashboard Summary Cryptocurrency Management With Blockchain
This slide represents the cryptocurrency performance indicators for the individual. The key components include invested money, profit and loss, rate of investment ROI, current valuation of money, etc.Formulating a presentation can take up a lot of effort and time, so the content and message should always be the primary focus. The visuals of the PowerPoint can enhance the presenters message, so our Cryptocurrency Portfolio Tracking Dashboard Summary Cryptocurrency Management With Blockchain was created to help save time. Instead of worrying about the design, the presenter can concentrate on the message while our designers work on creating the ideal templates for whatever situation is needed. Slidegeeks has experts for everything from amazing designs to valuable content, we have put everything into Cryptocurrency Portfolio Tracking Dashboard Summary Cryptocurrency Management With Blockchain. This slide represents the cryptocurrency performance indicators for the individual. The key components include invested money, profit and loss, rate of investment ROI, current valuation of money, etc.
Managing Technical And Non Various Kpis For Tracking Business Performance
Mentioned slide provide insights into various key performance indicators to determine business performance. It includes KPIs such as business financials, website traffic, customer case, customer engagement, conversion rate, customer retention, customer bounce rate, employee turnover, etc. Make sure to capture your audiences attention in your business displays with our gratis customizable Managing Technical And Non Various Kpis For Tracking Business Performance. These are great for business strategies, office conferences, capital raising or task suggestions. If you desire to acquire more customers for your tech business and ensure they stay satisfied, create your own sales presentation with these plain slides. Mentioned slide provide insights into various key performance indicators to determine business performance. It includes KPIs such as business financials, website traffic, customer case, customer engagement, conversion rate, customer retention, customer bounce rate, employee turnover, etc.
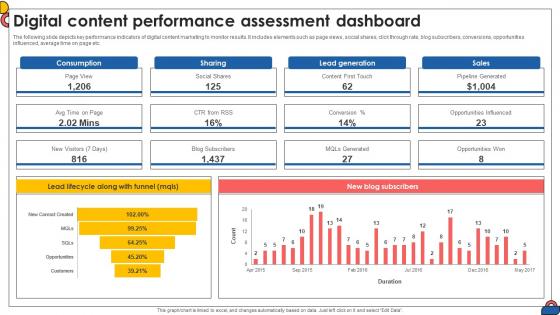
Digital Content Performance Assessment Dashboard Comprehensive Guide To Implement Strategy SS V
The following slide depicts key performance indicators of digital content marketing to monitor results. It includes elements such as page views, social shares, click through rate, blog subscribers, conversions, opportunities influenced, average time on page etc.If your project calls for a presentation, then Slidegeeks is your go-to partner because we have professionally designed, easy-to-edit templates that are perfect for any presentation. After downloading, you can easily edit Digital Content Performance Assessment Dashboard Comprehensive Guide To Implement Strategy SS V and make the changes accordingly. You can rearrange slides or fill them with different images. Check out all the handy templates The following slide depicts key performance indicators of digital content marketing to monitor results. It includes elements such as page views, social shares, click through rate, blog subscribers, conversions, opportunities influenced, average time on page etc.
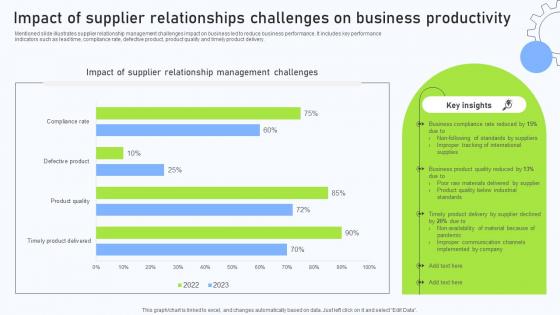
Relationship Management Automation Software Impact Of Supplier Relationships Challenges
Mentioned slide illustrates supplier relationship management challenges impact on business led to reduce business performance. It includes key performance indicators such as lead time, compliance rate, defective product, product quality and timely product delivery. Slidegeeks is one of the best resources for PowerPoint templates. You can download easily and regulate Relationship Management Automation Software Impact Of Supplier Relationships Challenges for your personal presentations from our wonderful collection. A few clicks is all it takes to discover and get the most relevant and appropriate templates. Use our Templates to add a unique zing and appeal to your presentation and meetings. All the slides are easy to edit and you can use them even for advertisement purposes. Mentioned slide illustrates supplier relationship management challenges impact on business led to reduce business performance. It includes key performance indicators such as lead time, compliance rate, defective product, product quality and timely product delivery.
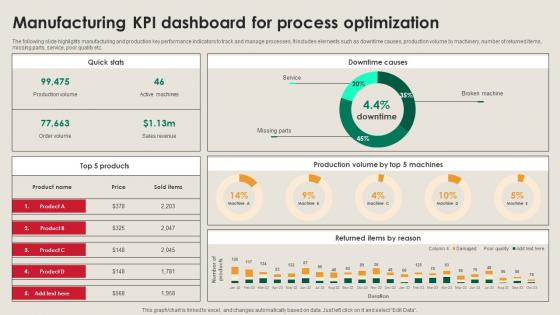
Manufacturing KPI Dashboard For Process Manufacturing Strategy Driving Industry 4 0
The following slide highlights manufacturing and production key performance indicators to track and manage processes. It includes elements such as downtime causes, production volume by machinery, number of returned items, missing parts, service, poor quality etc. Boost your pitch with our creative Manufacturing KPI Dashboard For Process Manufacturing Strategy Driving Industry 4 0. Deliver an awe-inspiring pitch that will mesmerize everyone. Using these presentation templates you will surely catch everyones attention. You can browse the ppts collection on our website. We have researchers who are experts at creating the right content for the templates. So you do not have to invest time in any additional work. Just grab the template now and use them. The following slide highlights manufacturing and production key performance indicators to track and manage processes. It includes elements such as downtime causes, production volume by machinery, number of returned items, missing parts, service, poor quality etc.

Financial Projections Technology Solutions Provider Investor Funding Elevator Pitch Deck
This slide caters to the details related to the forecast of companies future. It highlights revenue, net income, free cash flow, and cash balance recorded which indicates positive performance and future growth potential. Slidegeeks is here to make your presentations a breeze with Financial Projections Technology Solutions Provider Investor Funding Elevator Pitch Deck With our easy-to-use and customizable templates, you can focus on delivering your ideas rather than worrying about formatting. With a variety of designs to choose from, you are sure to find one that suits your needs. And with animations and unique photos, illustrations, and fonts, you can make your presentation pop. So whether you are giving a sales pitch or presenting to the board, make sure to check out Slidegeeks first This slide caters to the details related to the forecast of companies future. It highlights revenue, net income, free cash flow, and cash balance recorded which indicates positive performance and future growth potential.
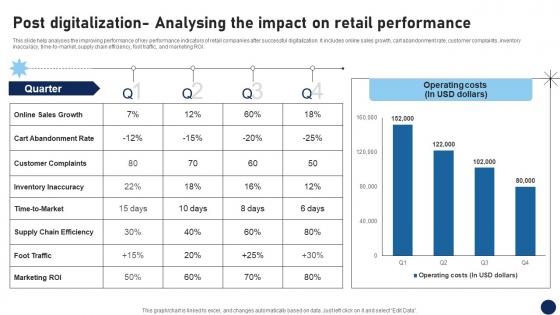
Post Digitalization Analysing The Impact On Retail Performance DT SS V
This slide help analyses the improving performance of key performance indicators of retail companies after successful digitalization. It includes online sales growth, cart abandonment rate, customer complaints, inventory inaccuracy, time-to-market, supply chain efficiency, foot traffic, and marketing ROI. This modern and well-arranged Post Digitalization Analysing The Impact On Retail Performance DT SS V provides lots of creative possibilities. It is very simple to customize and edit with the Powerpoint Software. Just drag and drop your pictures into the shapes. All facets of this template can be edited with Powerpoint, no extra software is necessary. Add your own material, put your images in the places assigned for them, adjust the colors, and then you can show your slides to the world, with an animated slide included. This slide help analyses the improving performance of key performance indicators of retail companies after successful digitalization. It includes online sales growth, cart abandonment rate, customer complaints, inventory inaccuracy, time-to-market, supply chain efficiency, foot traffic, and marketing ROI.

Marketing Growth Strategy KPI Dashboard To Evaluate Sales Performance Strategy SS V
The following slide outlines key performance indicator KPI dashboard to monitor sales performance of company. The key metrics covered in slide are total sales by location, monthly sales trend, average revenue AR by clients, etc. This Marketing Growth Strategy KPI Dashboard To Evaluate Sales Performance Strategy SS V is perfect for any presentation, be it in front of clients or colleagues. It is a versatile and stylish solution for organizing your meetings. The Marketing Growth Strategy KPI Dashboard To Evaluate Sales Performance Strategy SS V features a modern design for your presentation meetings. The adjustable and customizable slides provide unlimited possibilities for acing up your presentation. Slidegeeks has done all the homework before launching the product for you. So, do not wait, grab the presentation templates today The following slide outlines key performance indicator KPI dashboard to monitor sales performance of company. The key metrics covered in slide are total sales by location, monthly sales trend, average revenue AR by clients, etc.

Marketing Growth Strategy Performance Dashboard To Measure Marketing Strategy SS V
The following slide outlines key performance indicator KPI dashboard that can assist digital marketers to evaluate marketing campaign performance. The success metrics outlined in slide are total spend on advertisement, cost per thousand CPM, cost per click CPC, click-through rate CTR, etc. Take your projects to the next level with our ultimate collection of Marketing Growth Strategy Performance Dashboard To Measure Marketing Strategy SS V. Slidegeeks has designed a range of layouts that are perfect for representing task or activity duration, keeping track of all your deadlines at a glance. Tailor these designs to your exact needs and give them a truly corporate look with your own brand colors they will make your projects stand out from the rest The following slide outlines key performance indicator KPI dashboard that can assist digital marketers to evaluate marketing campaign performance. The success metrics outlined in slide are total spend on advertisement, cost per thousand CPM, cost per click CPC, click-through rate CTR, etc.
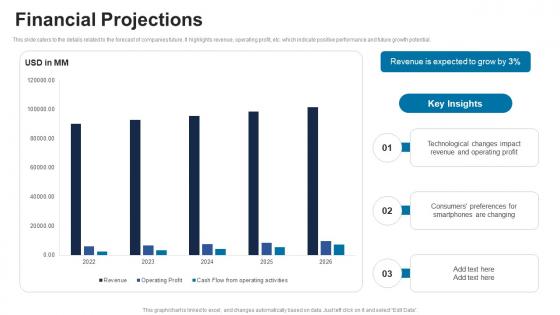
Financial Projections ICT Solutions Provider Investor Funding Elevator Pitch Deck
This slide caters to the details related to the forecast of companies future. It highlights revenue, operating profit, etc. which indicate positive performance and future growth potential. Slidegeeks is here to make your presentations a breeze with Financial Projections ICT Solutions Provider Investor Funding Elevator Pitch Deck With our easy-to-use and customizable templates, you can focus on delivering your ideas rather than worrying about formatting. With a variety of designs to choose from, you are sure to find one that suits your needs. And with animations and unique photos, illustrations, and fonts, you can make your presentation pop. So whether you are giving a sales pitch or presenting to the board, make sure to check out Slidegeeks first This slide caters to the details related to the forecast of companies future. It highlights revenue, operating profit, etc. which indicate positive performance and future growth potential.
Comprehensive Guide For Website Various Kpis For Tracking Business Performance
Mentioned slide provide insights into various key performance indicators to determine business performance. It includes KPIs such as business financials, website traffic, customer case, customer engagement, conversion rate, customer retention, customer bounce rate, employee turnover, etc. Make sure to capture your audiences attention in your business displays with our gratis customizable Comprehensive Guide For Website Various Kpis For Tracking Business Performance. These are great for business strategies, office conferences, capital raising or task suggestions. If you desire to acquire more customers for your tech business and ensure they stay satisfied, create your own sales presentation with these plain slides. Mentioned slide provide insights into various key performance indicators to determine business performance. It includes KPIs such as business financials, website traffic, customer case, customer engagement, conversion rate, customer retention, customer bounce rate, employee turnover, etc.
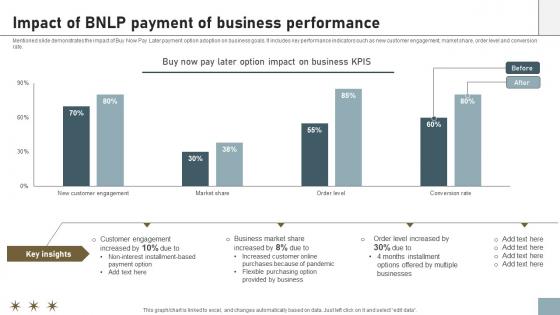
Online Payment Techniques Impact Of BNLP Payment Of Business Performance
Mentioned slide demonstrates the impact of Buy Now Pay Later payment option adoption on business goals. It includes key performance indicators such as new customer engagement, market share, order level and conversion rate. There are so many reasons you need a Online Payment Techniques Impact Of BNLP Payment Of Business Performance. The first reason is you can not spend time making everything from scratch, Thus, Slidegeeks has made presentation templates for you too. You can easily download these templates from our website easily. Mentioned slide demonstrates the impact of Buy Now Pay Later payment option adoption on business goals. It includes key performance indicators such as new customer engagement, market share, order level and conversion rate.
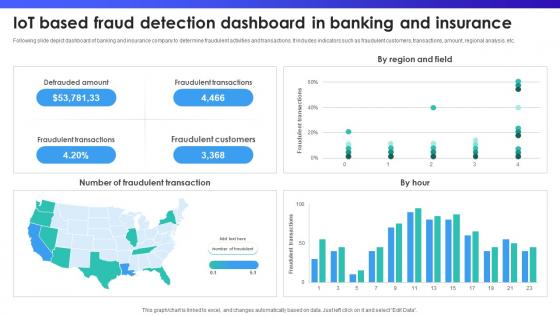
IoT Based Fraud Detection Dashboard In Banking And Insurance IoT In Banking For Digital Future IoT SS V
Following slide depict dashboard of banking and insurance company to determine fraudulent activities and transactions. It includes indicators such as fraudulent customers, transactions, amount, regional analysis, etc. Slidegeeks is here to make your presentations a breeze with IoT Based Fraud Detection Dashboard In Banking And Insurance IoT In Banking For Digital Future IoT SS V With our easy-to-use and customizable templates, you can focus on delivering your ideas rather than worrying about formatting. With a variety of designs to choose from, you are sure to find one that suits your needs. And with animations and unique photos, illustrations, and fonts, you can make your presentation pop. So whether you are giving a sales pitch or presenting to the board, make sure to check out Slidegeeks first Following slide depict dashboard of banking and insurance company to determine fraudulent activities and transactions. It includes indicators such as fraudulent customers, transactions, amount, regional analysis, etc.

Graph Illustrating Impact Of Prescriptive Analytics Data Analytics SS V
This slide showcases graph highlighting impact analysis of prescriptive analytics on businesses via use of major performance indicators. It provides information total revenue, inventory levels and labour costs with key insights.Take your projects to the next level with our ultimate collection of Graph Illustrating Impact Of Prescriptive Analytics Data Analytics SS V. Slidegeeks has designed a range of layouts that are perfect for representing task or activity duration, keeping track of all your deadlines at a glance. Tailor these designs to your exact needs and give them a truly corporate look with your own brand colors they will make your projects stand out from the rest This slide showcases graph highlighting impact analysis of prescriptive analytics on businesses via use of major performance indicators. It provides information total revenue, inventory levels and labour costs with key insights.
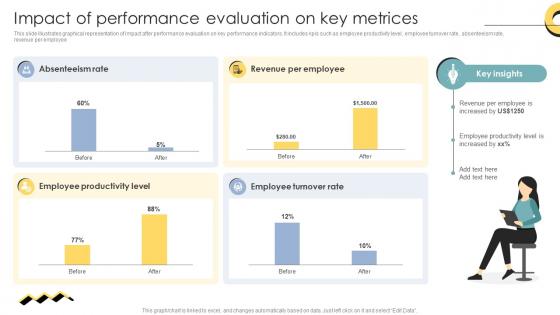
Skill Enhancement Performance Impact Of Performance Evaluation On Key Metrices
This slide illustrates graphical representation of impact after performance evaluation on key performance indicators. It includes kpis such as employee productivity level, employee turnover rate, absenteeism rate, revenue per employee. Do you have to make sure that everyone on your team knows about any specific topic I yes, then you should give Skill Enhancement Performance Impact Of Performance Evaluation On Key Metrices a try. Our experts have put a lot of knowledge and effort into creating this impeccable Skill Enhancement Performance Impact Of Performance Evaluation On Key Metrices. You can use this template for your upcoming presentations, as the slides are perfect to represent even the tiniest detail. You can download these templates from the Slidegeeks website and these are easy to edit. So grab these today This slide illustrates graphical representation of impact after performance evaluation on key performance indicators. It includes kpis such as employee productivity level, employee turnover rate, absenteeism rate, revenue per employee.
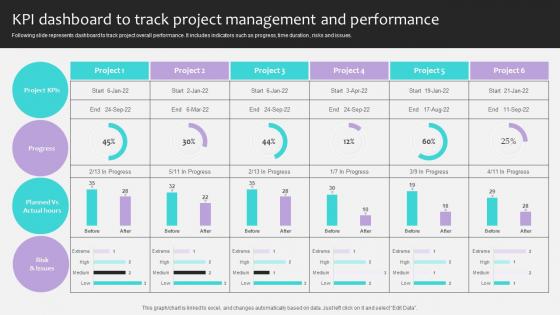
Project Stakeholders Management KPI Dashboard To Track Project Management Ppt Presentation
Following slide represents dashboard to track project overall performance. It includes indicators such as progress, time duration , risks and issues. Slidegeeks has constructed Project Stakeholders Management KPI Dashboard To Track Project Management Ppt Presentation after conducting extensive research and examination. These presentation templates are constantly being generated and modified based on user preferences and critiques from editors. Here, you will find the most attractive templates for a range of purposes while taking into account ratings and remarks from users regarding the content. This is an excellent jumping-off point to explore our content and will give new users an insight into our top-notch PowerPoint Templates. Following slide represents dashboard to track project overall performance. It includes indicators such as progress, time duration , risks and issues.
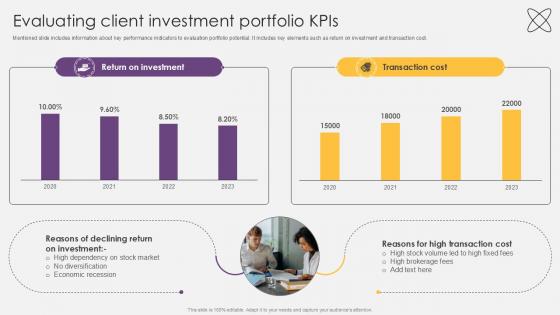
Evaluating Client Investment Portfolio KPIs Investment Fund PPT Presentation
Mentioned slide includes information about key performance indicators to evaluation portfolio potential.It includes key elements such as return on investment and transaction cost. Find highly impressive Evaluating Client Investment Portfolio KPIs Investment Fund PPT Presentation on Slidegeeks to deliver a meaningful presentation. You can save an ample amount of time using these presentation templates. No need to worry to prepare everything from scratch because Slidegeeks experts have already done a huge research and work for you. You need to download Evaluating Client Investment Portfolio KPIs Investment Fund PPT Presentation for your upcoming presentation. All the presentation templates are 100 percent editable and you can change the color and personalize the content accordingly. Download now Mentioned slide includes information about key performance indicators to evaluation portfolio potential.It includes key elements such as return on investment and transaction cost.

Impact Of Portfolio Expansion Of Returns And Cost Investment Fund PPT Example
Mentioned slide includes information about key performance indicators to evaluate portfolio potential.It includes key elements such as return on investment and transaction cost. Formulating a presentation can take up a lot of effort and time, so the content and message should always be the primary focus. The visuals of the PowerPoint can enhance the presenters message, so our Impact Of Portfolio Expansion Of Returns And Cost Investment Fund PPT Example was created to help save time. Instead of worrying about the design, the presenter can concentrate on the message while our designers work on creating the ideal templates for whatever situation is needed. Slidegeeks has experts for everything from amazing designs to valuable content, we have put everything into Impact Of Portfolio Expansion Of Returns And Cost Investment Fund PPT Example Mentioned slide includes information about key performance indicators to evaluate portfolio potential.It includes key elements such as return on investment and transaction cost.
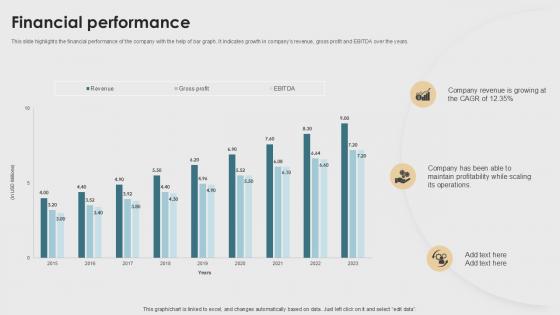
Financial Performance Property Listings Platform Pitch Deck PPT Sample
This slide highlights the financial performance of the company with the help of bar graph. It indicates growth in companys revenue, gross profit and EBITDA over the years. Present like a pro with Financial Performance Property Listings Platform Pitch Deck PPT Sample. Create beautiful presentations together with your team, using our easy to use presentation slides. Share your ideas in real time and make changes on the fly by downloading our templates. So whether you are in the office, on the go, or in a remote location, you can stay in sync with your team and present your ideas with confidence. With Slidegeeks presentation got a whole lot easier. Grab these presentations today. This slide highlights the financial performance of the company with the help of bar graph.It indicates growth in companys revenue, gross profit and EBITDA over the years.
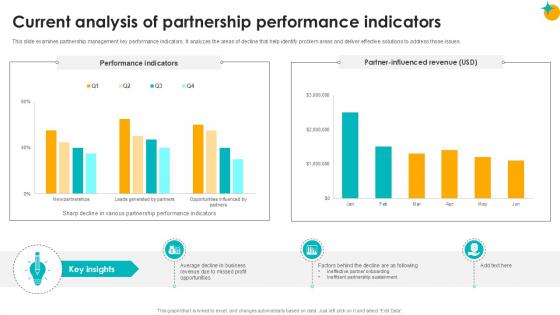
Current Analysis Of Partnership Performance Partner Relationship Ppt Template
This slide examines partnership management key performance indicators. It analyzes the areas of decline that help identify problem areas and deliver effective solutions to address those issues. Create an editable Current Analysis Of Partnership Performance Partner Relationship Ppt Template that communicates your idea and engages your audience. Whether you are presenting a business or an educational presentation, pre-designed presentation templates help save time. Current Analysis Of Partnership Performance Partner Relationship Ppt Template is highly customizable and very easy to edit, covering many different styles from creative to business presentations. Slidegeeks has creative team members who have crafted amazing templates. So, go and get them without any delay. This slide examines partnership management key performance indicators. It analyzes the areas of decline that help identify problem areas and deliver effective solutions to address those issues.
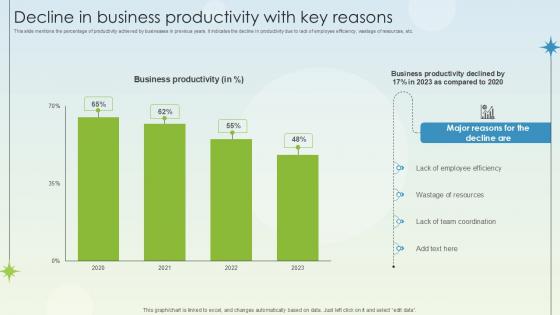
Decline In Business Productivity With Key Reasons Business Growth Ppt Slides
This slide mentions the percentage of productivity achieved by businesses in previous years. it indicates the decline in productivity due to lack of employee efficiency, wastage of resources, etc. Present like a pro with Decline In Business Productivity With Key Reasons Business Growth Ppt Slides. Create beautiful presentations together with your team, using our easy-to-use presentation slides. Share your ideas in real-time and make changes on the fly by downloading our templates. So whether you are in the office, on the go, or in a remote location, you can stay in sync with your team and present your ideas with confidence. With Slidegeeks presentation got a whole lot easier. Grab these presentations today. This slide mentions the percentage of productivity achieved by businesses in previous years. it indicates the decline in productivity due to lack of employee efficiency, wastage of resources, etc.
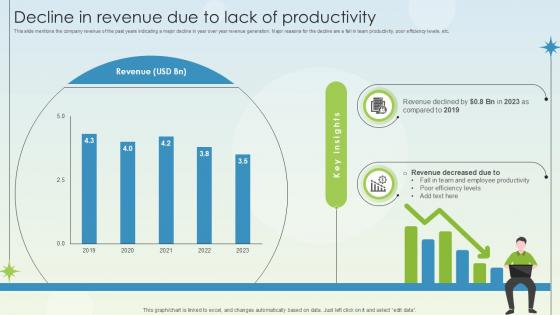
Decline In Revenue Due To Lack Of Productivity Business Growth Ppt Powerpoint
This slide mentions the company revenue of the past years indicating a major decline in year over year revenue generation. Major reasons for the decline are a fall in team productivity, poor efficiency levels, etc. Slidegeeks is here to make your presentations a breeze with Decline In Revenue Due To Lack Of Productivity Business Growth Ppt Powerpoint With our easy-to-use and customizable templates, you can focus on delivering your ideas rather than worrying about formatting. With a variety of designs to choose from, you are sure to find one that suits your needs. And with animations and unique photos, illustrations, and fonts, you can make your presentation pop. So whether you are giving a sales pitch or presenting to the board, make sure to check out Slidegeeks first This slide mentions the company revenue of the past years indicating a major decline in year over year revenue generation. Major reasons for the decline are a fall in team productivity, poor efficiency levels, etc.
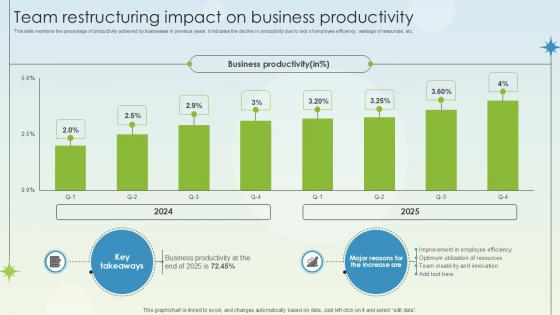
Team Restructuring Impact On Business Productivity Business Growth Ppt Example
This slide mentions the percentage of productivity achieved by businesses in previous years. it indicates the decline in productivity due to lack of employee efficiency, wastage of resources, etc. Get a simple yet stunning designed Team Restructuring Impact On Business Productivity Business Growth Ppt Example. It is the best one to establish the tone in your meetings. It is an excellent way to make your presentations highly effective. So, download this PPT today from Slidegeeks and see the positive impacts. Our easy-to-edit Team Restructuring Impact On Business Productivity Business Growth Ppt Example can be your go-to option for all upcoming conferences and meetings. So, what are you waiting for Grab this template today. This slide mentions the percentage of productivity achieved by businesses in previous years. it indicates the decline in productivity due to lack of employee efficiency, wastage of resources, etc.
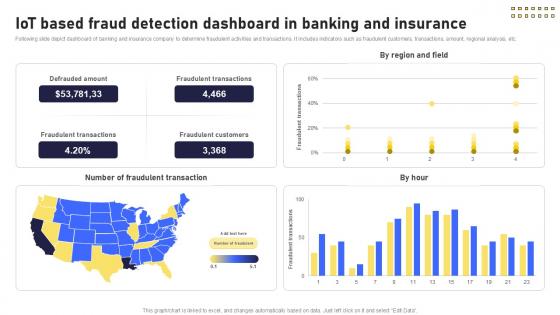
IoT Based Fraud Detection Dashboard Banking Future With IoT Ppt Example IoT SS V
Following slide depict dashboard of banking and insurance company to determine fraudulent activities and transactions. It includes indicators such as fraudulent customers, transactions, amount, regional analysis, etc. Present like a pro with IoT Based Fraud Detection Dashboard Banking Future With IoT Ppt Example IoT SS V. Create beautiful presentations together with your team, using our easy-to-use presentation slides. Share your ideas in real-time and make changes on the fly by downloading our templates. So whether you are in the office, on the go, or in a remote location, you can stay in sync with your team and present your ideas with confidence. With Slidegeeks presentation got a whole lot easier. Grab these presentations today. Following slide depict dashboard of banking and insurance company to determine fraudulent activities and transactions. It includes indicators such as fraudulent customers, transactions, amount, regional analysis, etc.
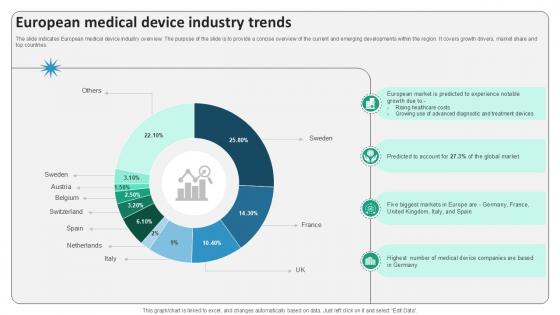
European Medical Device Industry Trends Surgical Devices Ppt Slides IR SS V
The slide indicates European medical device industry overview. The purpose of the slide is to provide a concise overview of the current and emerging developments within the region. It covers growth drivers, market share and top countries. Present like a pro with European Medical Device Industry Trends Surgical Devices Ppt Slides IR SS V. Create beautiful presentations together with your team, using our easy-to-use presentation slides. Share your ideas in real-time and make changes on the fly by downloading our templates. So whether you are in the office, on the go, or in a remote location, you can stay in sync with your team and present your ideas with confidence. With Slidegeeks presentation got a whole lot easier. Grab these presentations today. The slide indicates European medical device industry overview. The purpose of the slide is to provide a concise overview of the current and emerging developments within the region. It covers growth drivers, market share and top countries.
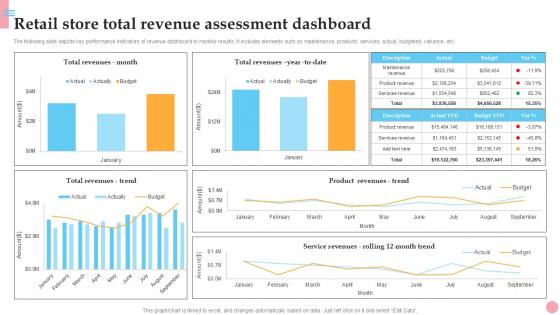
Retail Store Total Revenue Assessment How To Improve Company PPT Presentation Strategy SS V
The following slide depicts key performance indicators of revenue dashboard to monitor results. It includes elements such as maintenance, products, services, actual, budgeted, variance, etc. Take your projects to the next level with our ultimate collection of Retail Store Total Revenue Assessment How To Improve Company PPT Presentation Strategy SS V. Slidegeeks has designed a range of layouts that are perfect for representing task or activity duration, keeping track of all your deadlines at a glance. Tailor these designs to your exact needs and give them a truly corporate look with your own brand colors they will make your projects stand out from the rest The following slide depicts key performance indicators of revenue dashboard to monitor results. It includes elements such as maintenance, products, services, actual, budgeted, variance, etc.
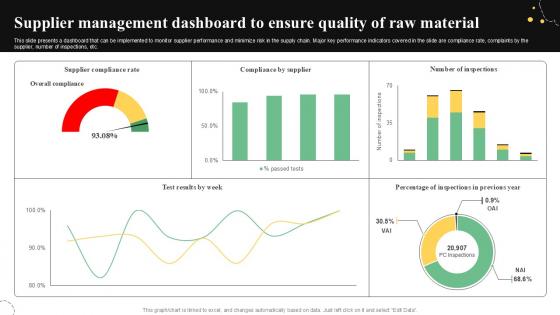
Supplier Management Dashboard Quality Control Guide For Food PPT Sample
This slide presents a dashboard that can be implemented to monitor supplier performance and minimize risk in the supply chain. Major key performance indicators covered in the slide are compliance rate, complaints by the supplier, number of inspections, etc. Present like a pro with Supplier Management Dashboard Quality Control Guide For Food PPT Sample. Create beautiful presentations together with your team, using our easy-to-use presentation slides. Share your ideas in real-time and make changes on the fly by downloading our templates. So whether you are in the office, on the go, or in a remote location, you can stay in sync with your team and present your ideas with confidence. With Slidegeeks presentation got a whole lot easier. Grab these presentations today. This slide presents a dashboard that can be implemented to monitor supplier performance and minimize risk in the supply chain. Major key performance indicators covered in the slide are compliance rate, complaints by the supplier, number of inspections, etc.
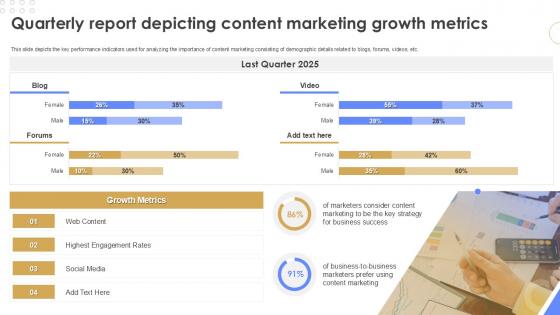
Quarterly Report Depicting Content Marketing Growth Metrics Quarterly Report Ppt Example
This slide depicts the key performance indicators used for analyzing the importance of content marketing consisting of demographic details related to blogs, forums, videos, etc. Slidegeeks is here to make your presentations a breeze with Quarterly Report Depicting Content Marketing Growth Metrics Quarterly Report Ppt Example With our easy-to-use and customizable templates, you can focus on delivering your ideas rather than worrying about formatting. With a variety of designs to choose from, you are sure to find one that suits your needs. And with animations and unique photos, illustrations, and fonts, you can make your presentation pop. So whether you are giving a sales pitch or presenting to the board, make sure to check out Slidegeeks first This slide depicts the key performance indicators used for analyzing the importance of content marketing consisting of demographic details related to blogs, forums, videos, etc.
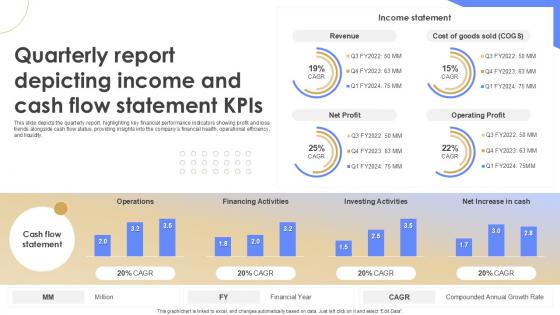
Quarterly Report Depicting Income And Cash Flow Statement KPIS Quarterly Report Ppt Example
This slide depicts the quarterly report, highlighting key financial performance indicators showing profit and loss trends alongside cash flow status, providing insights into the companys financial health, operational efficiency, and liquidity. Do you have an important presentation coming up Are you looking for something that will make your presentation stand out from the rest Look no further than Quarterly Report Depicting Income And Cash Flow Statement KPIS Quarterly Report Ppt Example With our professional designs, you can trust that your presentation will pop and make delivering it a smooth process. And with Slidegeeks, you can trust that your presentation will be unique and memorable. So why wait Grab Quarterly Report Depicting Income And Cash Flow Statement KPIS Quarterly Report Ppt Example today and make your presentation stand out from the rest This slide depicts the quarterly report, highlighting key financial performance indicators showing profit and loss trends alongside cash flow status, providing insights into the companys financial health, operational efficiency, and liquidity.
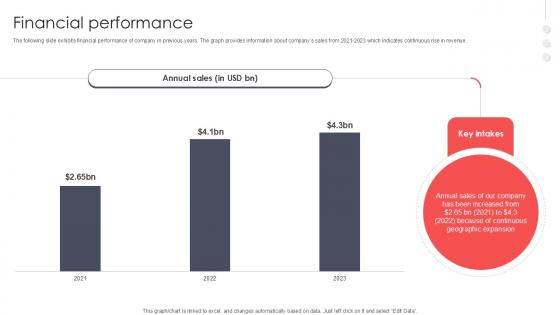
Financial Performance Virtual Meeting Investor Funding Elevator Pitch Deck PPT PowerPoint
The following slide exhibits financial performance of company in previous years. The graph provides information about companys sales from 2021-2023 which indicates continuous rise in revenue. From laying roadmaps to briefing everything in detail, our templates are perfect for you. You can set the stage with your presentation slides. All you have to do is download these easy-to-edit and customizable templates. Financial Performance Virtual Meeting Investor Funding Elevator Pitch Deck PPT PowerPoint will help you deliver an outstanding performance that everyone would remember and praise you for. Do download this presentation today. The following slide exhibits financial performance of company in previous years. The graph provides information about companys sales from 2021-2023 which indicates continuous rise in revenue.
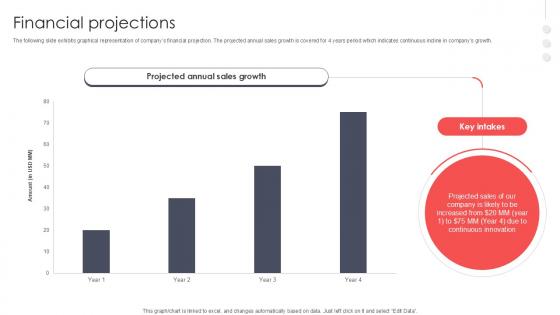
Financial Projections Virtual Meeting Investor Funding Elevator Pitch Deck PPT Sample
The following slide exhibits graphical representation of companys financial projection. The projected annual sales growth is covered for 4 years period which indicates continuous incline in companys growth. Present like a pro with Financial Projections Virtual Meeting Investor Funding Elevator Pitch Deck PPT Sample. Create beautiful presentations together with your team, using our easy-to-use presentation slides. Share your ideas in real-time and make changes on the fly by downloading our templates. So whether you are in the office, on the go, or in a remote location, you can stay in sync with your team and present your ideas with confidence. With Slidegeeks presentation got a whole lot easier. Grab these presentations today. The following slide exhibits graphical representation of companys financial projection. The projected annual sales growth is covered for 4 years period which indicates continuous incline in companys growth.
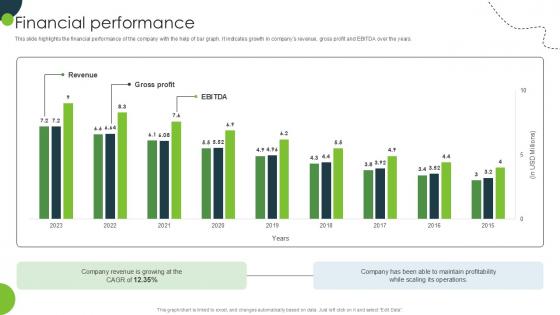
Financial Performance Land And Property Marketplace Pitch Deck PPT Sample
This slide highlights the financial performance of the company with the help of bar graph. It indicates growth in companys revenue, gross profit and EBITDA over the years. Present like a pro with Financial Performance Land And Property Marketplace Pitch Deck PPT Sample. Create beautiful presentations together with your team, using our easy-to-use presentation slides. Share your ideas in real-time and make changes on the fly by downloading our templates. So whether you are in the office, on the go, or in a remote location, you can stay in sync with your team and present your ideas with confidence. With Slidegeeks presentation got a whole lot easier. Grab these presentations today. This slide highlights the financial performance of the company with the help of bar graph. It indicates growth in companys revenue, gross profit and EBITDA over the years.
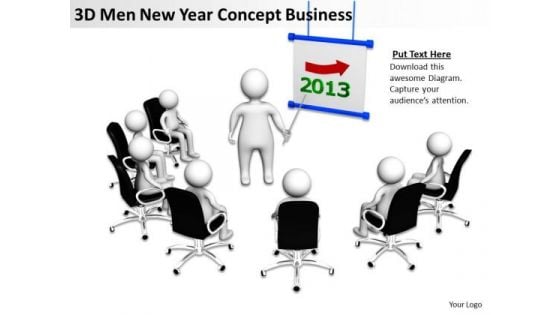
Business Diagrams 3d Men New Year Concept World PowerPoint Templates Slides
We present our business diagrams 3d men new year concept world powerpoint templates Slides.Download and present our People PowerPoint Templates because Our PowerPoint Templates and Slides will give good value for money. They also have respect for the value of your time. Download and present our Arrows PowerPoint Templates because Our PowerPoint Templates and Slides will let you meet your Deadlines. Use our Business PowerPoint Templates because You can Be the star of the show with our PowerPoint Templates and Slides. Rock the stage with your ideas. Use our Communication PowerPoint Templates because You should Bet on your luck with our PowerPoint Templates and Slides. Be assured that you will hit the jackpot. Present our Success PowerPoint Templates because you should Whip up a frenzy with our PowerPoint Templates and Slides. They will fuel the excitement of your team.Use these PowerPoint slides for presentations relating to 3d, achievement, animated, business, calendar, change, concepts,cooperation, curve, date, december, design, eve, future, futuristic, holiday, ideas,illustration, isolated, january, male, marionette, men, month, motivation, moving,new, next, night, number, painting, partnership, pattern, preparation, red,season, shape, shiny, sign, thousand, three-dimensional, time, toward, winter,year. The prominent colors used in the PowerPoint template are Red, Green , Blue . Customers tell us our business diagrams 3d men new year concept world powerpoint templates Slides are readymade to fit into any presentation structure. We assure you our cooperation PowerPoint templates and PPT Slides are incredible easy to use. Customers tell us our business diagrams 3d men new year concept world powerpoint templates Slides are effectively colour coded to prioritise your plans They automatically highlight the sequence of events you desire. Use our calendar PowerPoint templates and PPT Slides effectively help you save your valuable time. PowerPoint presentation experts tell us our business diagrams 3d men new year concept world powerpoint templates Slides are effectively colour coded to prioritise your plans They automatically highlight the sequence of events you desire. You can be sure our animated PowerPoint templates and PPT Slides are the best it can get when it comes to presenting. Be the early bird with our Business Diagrams 3d Men New Year Concept World PowerPoint Templates Slides. Be the first on the block with your thoughts.
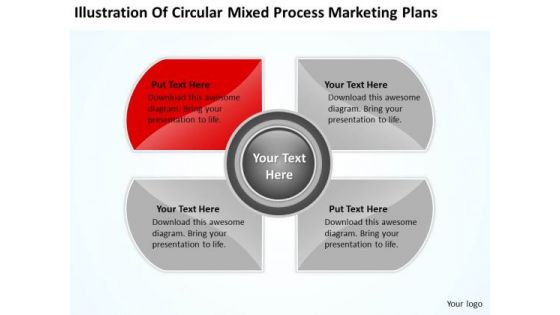
Circular Mixed Process Marketing Plans Ppt Laundromat Business PowerPoint Templates
We present our circular mixed process marketing plans ppt laundromat business PowerPoint templates.Download our Process and Flows PowerPoint Templates because our PowerPoint Templates and Slides will give your ideas the shape. Use our Flow Charts PowerPoint Templates because Our PowerPoint Templates and Slides are effectively colour coded to prioritise your plans They automatically highlight the sequence of events you desire. Download and present our Business PowerPoint Templates because It will get your audience in sync. Present our Marketing PowerPoint Templates because Our PowerPoint Templates and Slides will generate and maintain the level of interest you desire. They will create the impression you want to imprint on your audience. Use our Shapes PowerPoint Templates because you should once Tap the ingenuity of our PowerPoint Templates and Slides. They are programmed to succeed.Use these PowerPoint slides for presentations relating to Flow, process, step, business, concept, vector, success, diagram, circle, graphic, idea, development, management, illustration, circular, system, strategy, round, research, center, direction, method, quality, mix, indicator. The prominent colors used in the PowerPoint template are Red, Gray, White. Meet your audience on equal terms. Level the field with our Circular Mixed Process Marketing Plans Ppt Laundromat Business PowerPoint Templates.
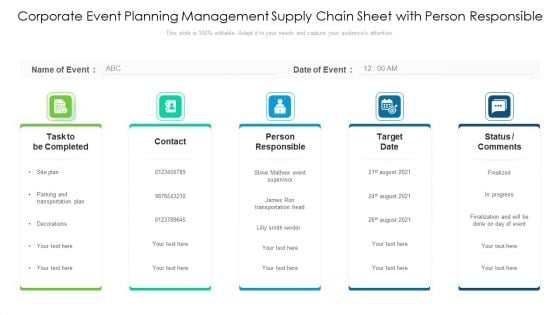
Corporate Event Planning Management Supply Chain Sheet With Person Responsible Ppt PowerPoint Presentation Gallery Graphics Tutorials PDF
Presenting corporate event planning management supply chain sheet with person responsible ppt powerpoint presentation gallery graphics tutorials pdf to dispense important information. This template comprises three stages. It also presents valuable insights into the topics including person responsible, task to be completed, target date. This is a completely customizable PowerPoint theme that can be put to use immediately. So, download it and address the topic impactfully.

School Kids On Earth PowerPoint Slides And Ppt Diagram Templates
School_Kids_On_Earth_PowerPoint_Slides_And_PPT_Diagram_Templates- Our School Kids On Earth PowerPoint Slides And Ppt Diagram Templates will help you save time. Just enter your specific text and see your points hit home.
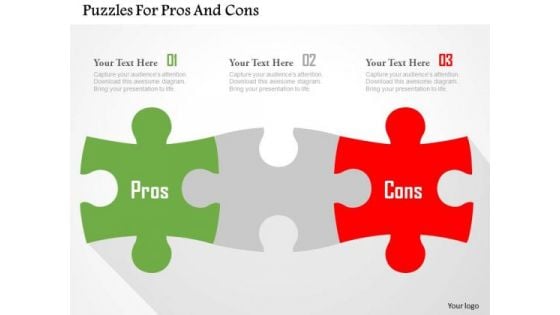
Business Diagram Puzzles For Pros And Cons Presentation Template
This business slide displays puzzles with pros and cons text. Download this diagram to display pros and cons of topics. Enlighten your audience with your breathtaking ideas.
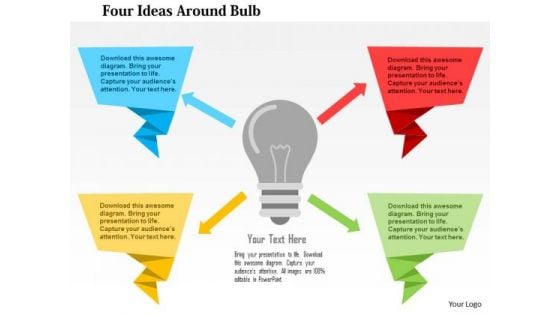
Business Diagram Four Ideas Around Bulb Presentation Template
This business slide displays text boxes around bulb. Download this diagram to represent creative and innovative ideas. Enlighten your audience with your breathtaking ideas.
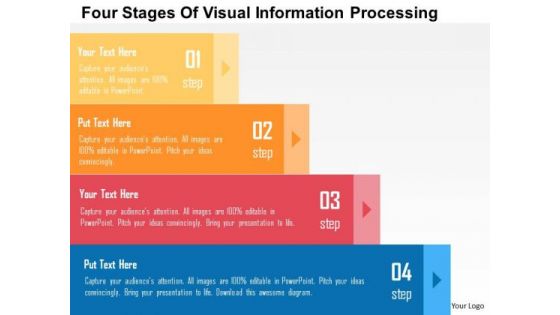
Business Diagram Four Stages Of Visual Information Processing Presentation Template
This business slide displays four text boxes. Download this diagram to display information in visual manner. This template is innovatively designed to highlight your worthy views
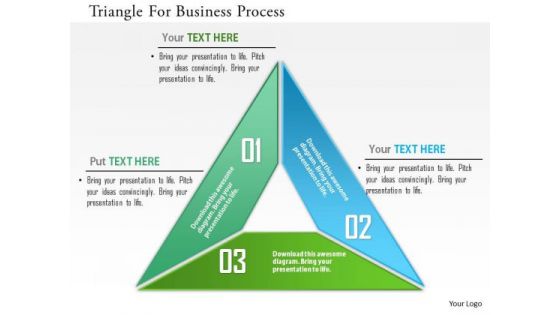
Business Diagram Triangle For Business Process Presentation Template
Use this business slide for data representation. This diagram contains the graphic of triangle text box. Amplify your thoughts via this appropriate business template.
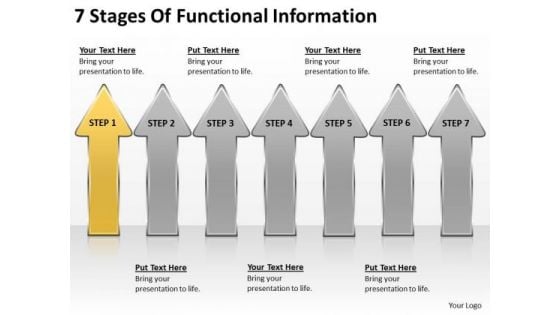
7 Stages Of Functional Information Catering Business Plan Sample PowerPoint Templates
We present our 7 stages of functional information catering business plan sample PowerPoint templates .Download our Business PowerPoint Templates because You canTake a leap off the starting blocks with our PowerPoint Templates and Slides. They will put you ahead of the competition in quick time. Download our Marketing PowerPoint Templates because You can Be the star of the show with our PowerPoint Templates and Slides. Rock the stage with your ideas. Download our Flow Charts PowerPoint Templates because Our PowerPoint Templates and Slides provide you with a vast range of viable options. Select the appropriate ones and just fill in your text. Download our Business PowerPoint Templates because You can Give birth to your ideas with our PowerPoint Templates and Slides. See them grow big and strong in record time. Present our Shapes PowerPoint Templates because Our PowerPoint Templates and Slides are endowed to endure. Ideas conveyed through them will pass the test of time.Use these PowerPoint slides for presentations relating to Advertising, arrow, background, design, flow, illustration, info graphic, instruction, label, layout, manual, marketing, process, product, promotion, step, symbol, template, vector, version, web, website. The prominent colors used in the PowerPoint template are Yellow, White, Gray. Presenters tell us our 7 stages of functional information catering business plan sample PowerPoint templates effectively help you save your valuable time. Customers tell us our design PowerPoint templates and PPT Slides have awesome images to get your point across. Professionals tell us our 7 stages of functional information catering business plan sample PowerPoint templates are readymade to fit into any presentation structure. Professionals tell us our background PowerPoint templates and PPT Slides are effectively colour coded to prioritise your plans They automatically highlight the sequence of events you desire. Presenters tell us our 7 stages of functional information catering business plan sample PowerPoint templates are second to none. People tell us our illustration PowerPoint templates and PPT Slides are visually appealing. Gain approval with our 7 Stages Of Functional Information Catering Business Plan Sample PowerPoint Templates. Just download, type and present.
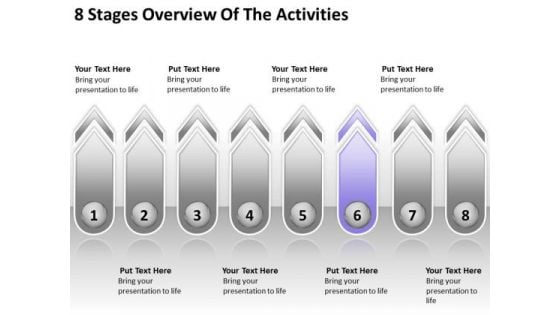
8 Stages Overview Of The Activities Business Plans How To PowerPoint Slides
We present our 8 stages overview of the activities business plans how to PowerPoint Slides .Download our Arrows PowerPoint Templates because They will bring a lot to the table. Their alluring flavours will make your audience salivate. Use our Flow Charts PowerPoint Templates because our PowerPoint Templates and Slides will give your ideas the shape. Download and present our Business PowerPoint Templates because It will get your audience in sync. Use our Process and Flows PowerPoint Templates because Our PowerPoint Templates and Slides are truly out of this world. Even the MIB duo has been keeping tabs on our team. Use our Shapes PowerPoint Templates because You can Be the star of the show with our PowerPoint Templates and Slides. Rock the stage with your ideas.Use these PowerPoint slides for presentations relating to Arrow, assessment, business, concept, consulting, demand, development, graphic, ideas, leader, plan, process, profit, solution, strategy, success, supply, support, team, teamwork, vision. The prominent colors used in the PowerPoint template are Purple, White, Gray. Presenters tell us our 8 stages overview of the activities business plans how to PowerPoint Slides will help them to explain complicated concepts. Customers tell us our concept PowerPoint templates and PPT Slides are effectively colour coded to prioritise your plans They automatically highlight the sequence of events you desire. Professionals tell us our 8 stages overview of the activities business plans how to PowerPoint Slides help you meet deadlines which are an element of today's workplace. Just browse and pick the slides that appeal to your intuitive senses. Professionals tell us our ideas PowerPoint templates and PPT Slides are visually appealing. Presenters tell us our 8 stages overview of the activities business plans how to PowerPoint Slides effectively help you save your valuable time. People tell us our concept PowerPoint templates and PPT Slides provide you with a vast range of viable options. Select the appropriate ones and just fill in your text. Exult in the happiness of your performance. Convey your emotions through our 8 Stages Overview Of The Activities Business Plans How To PowerPoint Slides.
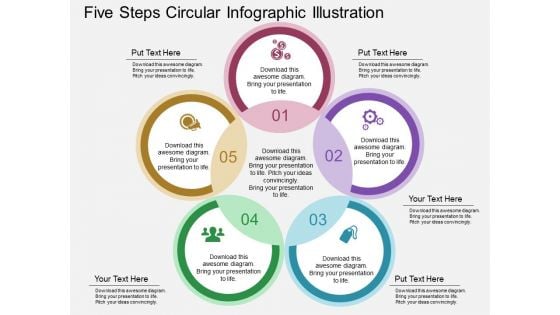
Five Steps Circular Infographic Illustration Powerpoint Template
Download this exclusive business diagram to present progress steps. This PowerPoint template contains the circular process chart. This diagram provides an effective way of displaying information you can edit text, color, shade and style as per you need.
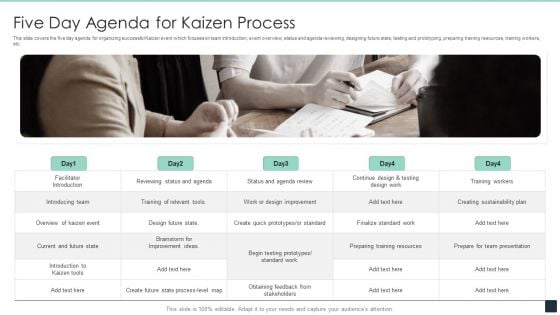
Five Day Agenda For Kaizen Process Ppt PowerPoint Presentation Gallery Themes PDF
This slide covers the five day agenda for organizing successful Kaizen event which focuses on team introduction, event overview, status and agenda reviewing, designing future state, testing and prototyping, preparing training resources, training workers, etc. Persuade your audience using this Five Day Agenda For Kaizen Process Ppt PowerPoint Presentation Gallery Themes PDF. This PPT design covers five stages, thus making it a great tool to use. It also caters to a variety of topics including Introducing Team, Training Workers, Introduction, Kaizen Tools. Download this PPT design now to present a convincing pitch that not only emphasizes the topic but also showcases your presentation skills.
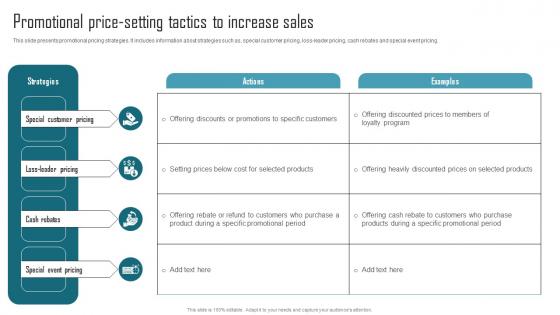
Effective Product Adaptation Promotional Price Setting Tactics To Increase Sales Themes Pdf
This slide presents promotional pricing strategies. It includes information about strategies such as, special customer pricing, loss-leader pricing, cash rebates and special event pricing. There are so many reasons you need a Effective Product Adaptation Promotional Price Setting Tactics To Increase Sales Themes Pdf The first reason is you can not spend time making everything from scratch, Thus, Slidegeeks has made presentation templates for you too. You can easily download these templates from our website easily. This slide presents promotional pricing strategies. It includes information about strategies such as, special customer pricing, loss-leader pricing, cash rebates and special event pricing.
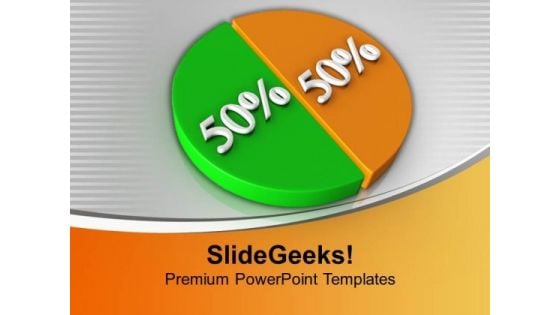
Pie Chart Showing 50 50 Factors Growth PowerPoint Templates Ppt Backgrounds For Slides 0213
We present our Pie Chart Showing 50 50 Factors Growth PowerPoint Templates PPT Backgrounds For Slides 0213.Download and present our Business PowerPoint Templates because Our PowerPoint Templates and Slides are specially created by a professional team with vast experience. They diligently strive to come up with the right vehicle for your brilliant Ideas. Present our Finance PowerPoint Templates because Our PowerPoint Templates and Slides offer you the widest possible range of options. Download and present our Signs PowerPoint Templates because You should Press the right buttons with our PowerPoint Templates and Slides. They will take your ideas down the perfect channel. Download and present our Circle Charts PowerPoint Templates because You are working at that stage with an air of royalty. Let our PowerPoint Templates and Slides be the jewels in your crown. Present our Marketing PowerPoint Templates because You can Create a matrix with our PowerPoint Templates and Slides. Feel the strength of your ideas click into place.Use these PowerPoint slides for presentations relating to Pie chart with fifty fifty percent, business, finance, marketing, circle charts, signs. The prominent colors used in the PowerPoint template are Green, Orange, White. Our Pie Chart Showing 50 50 Factors Growth PowerPoint Templates Ppt Backgrounds For Slides 0213 are like field glasses. Get a clearer view of events in the distance.
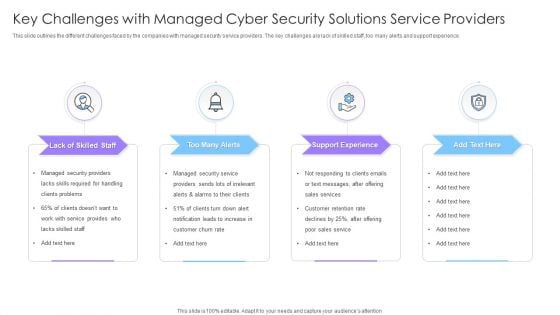
Key Challenges With Managed Cyber Security Solutions Service Providers Ppt Pictures Visual Aids PDF
This slide outlines the different challenges faced by the companies with managed security service providers. The key challenges are lack of skilled staff, too many alerts and support experience. Presenting Key Challenges With Managed Cyber Security Solutions Service Providers Ppt Pictures Visual Aids PDF to dispense important information. This template comprises four stages. It also presents valuable insights into the topics including Too Many Alerts, Support Experience, Lack Skilled Staff. This is a completely customizable PowerPoint theme that can be put to use immediately. So, download it and address the topic impactfully.
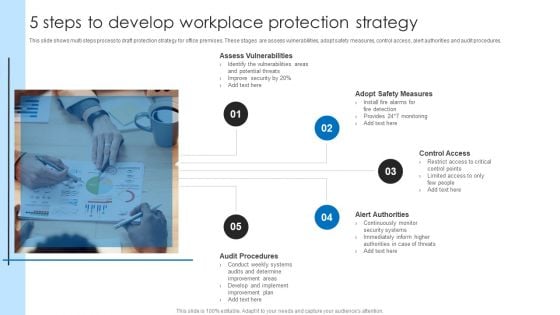
5 Steps To Develop Workplace Protection Strategy Sample PDF
This slide shows multi steps process to draft protection strategy for office premises. These stages are assess vulnerabilities, adopt safety measures, control access, alert authorities and audit procedures. Presenting 5 Steps To Develop Workplace Protection Strategy Sample PDF to dispense important information. This template comprises five stages. It also presents valuable insights into the topics including Assess Vulnerabilities, Control Access, Alert Authorities. This is a completely customizable PowerPoint theme that can be put to use immediately. So, download it and address the topic impactfully.
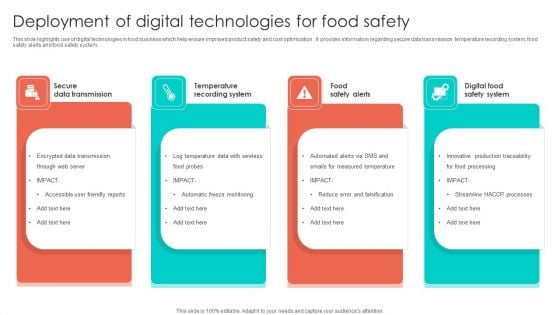
Deployment Of Digital Technologies For Food Safety Information PDF
This slide highlights use of digital technologies in food business which help ensure improved product safety and cost optimization . It provides information regarding secure data transmission, temperature recording system, food safety alerts and food safety system. Presenting Deployment Of Digital Technologies For Food Safety Information PDF to dispense important information. This template comprises four stages. It also presents valuable insights into the topics including Temperature Recording System, Food Safety Alerts, Digital Food Safety System. This is a completely customizable PowerPoint theme that can be put to use immediately. So, download it and address the topic impactfully.
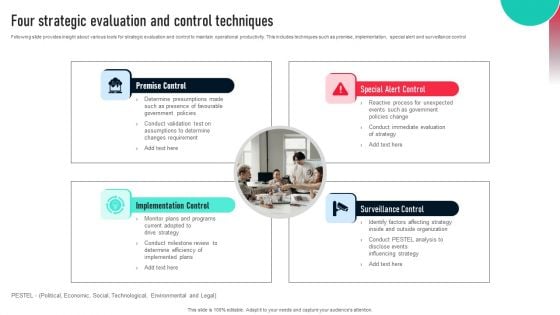
Four Strategic Evaluation And Control Techniques Brochure PDF
Following slide provides insight about various tools for strategic evaluation and control to maintain operational productivity. This includes techniques such as premise, implementation, special alert and surveillance control Presenting Four Strategic Evaluation And Control Techniques Brochure PDF to dispense important information. This template comprises four stages. It also presents valuable insights into the topics including Premise Control, Special Alert Control, Implementation Control. This is a completely customizable PowerPoint theme that can be put to use immediately. So, download it and address the topic impactfully.
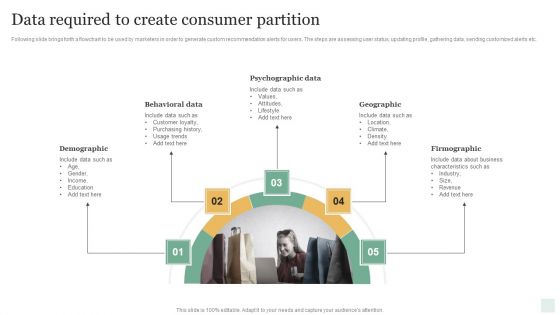
Data Required To Create Consumer Partition Summary PDF
Following slide brings forth a flowchart to be used by marketers in order to generate custom recommendation alerts for users. The steps are assessing user status, updating profile, gathering data, sending customized alerts etc. Presenting Data Required To Create Consumer Partition Summary PDF to dispense important information. This template comprises five stages. It also presents valuable insights into the topics including Demographic, Behavioral Data, Psychographic Data, Geographic, Firmographic. This is a completely customizable PowerPoint theme that can be put to use immediately. So, download it and address the topic impactfully.

Iot And Digital Twin To Reduce Costs Post Covid Healthcare Dashboard Showing Analytical Data Elements PDF
This slide shows the healthcare dashboard that presents analytical data such as occupancy, patient turnover, efficiency and costs, satisfaction and service indicators. Deliver and pitch your topic in the best possible manner with this iot and digital twin to reduce costs post covid healthcare dashboard showing analytical data elements pdf. Use them to share invaluable insights on occupancy, patient turnover, efficiency and costs, satisfaction and service indicators and impress your audience. This template can be altered and modified as per your expectations. So, grab it now.

Financial Fundamental Metrics Infrastructure Unit Costs Vs Target Benchmarks Ppt Professional Example PDF
These indicators assist IT leaders in stewarding technology expenditures and investments, and they are essential to managing the IT company. These measures aid in the management of the departments financial health and may indicate levers for cost reduction, improved resource allocation, and enhanced accountability. Deliver and pitch your topic in the best possible manner with this financial fundamental metrics infrastructure unit costs vs target benchmarks ppt professional example pdf. Use them to share invaluable insights on outsourcing, organizations, budget and impress your audience. This template can be altered and modified as per your expectations. So, grab it now.
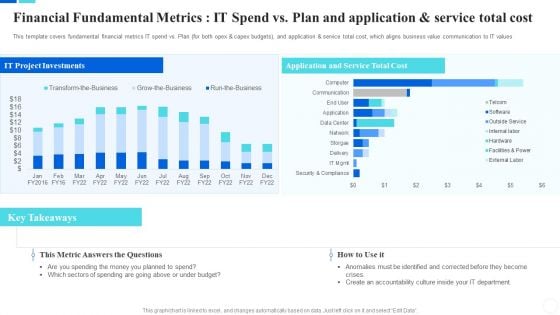
Communicate Company Value To Your Stakeholders Financial Fundamental Metrics Graphics PDF
These indicators assist IT leaders in stewarding technology expenditures and investments, and they are essential to managing the IT company. These measures aid in the management of the departments financial health and may indicate levers for cost reduction, improved resource allocation, and enhanced accountability. Deliver and pitch your topic in the best possible manner with this communicate company value to your stakeholders financial fundamental metrics graphics pdf. Use them to share invaluable insights on organizations, budget, protect and impress your audience. This template can be altered and modified as per your expectations. So, grab it now.

How To Evaluate And Develop The Organizational Value Of IT Service Financial Fundamental Metrics Slides PDF
These indicators assist IT leaders in stewarding technology expenditures and investments, and they are essential to managing the IT company. These measures aid in the management of the departments financial health and may indicate levers for cost reduction, improved resource allocation, and enhanced accountability. Deliver and pitch your topic in the best possible manner with this how to evaluate and develop the organizational value of it service financial fundamental metrics slides pdf. Use them to share invaluable insights on organizations, budget, business, efficiency and impress your audience. This template can be altered and modified as per your expectations. So, grab it now.
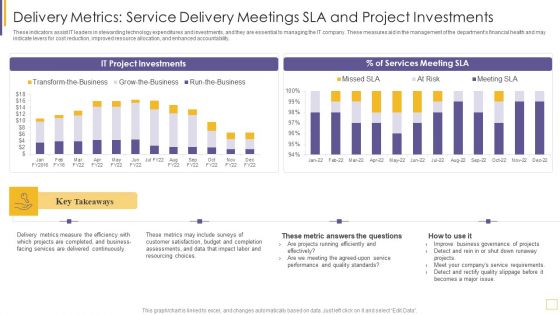
Guidelines For Exhibiting Business Value Of Information And Technology Delivery Metrics Service Portrait PDF
These indicators assist IT leaders in stewarding technology expenditures and investments, and they are essential to managing the IT company. These measures aid in the management of the departments financial health and may indicate levers for cost reduction, improved resource allocation, and enhanced accountability. Deliver and pitch your topic in the best possible manner with this guidelines for exhibiting business value of information and technology delivery metrics service portrait pdf. Use them to share invaluable insights on metrics measure, services, budget, resourcing and impress your audience. This template can be altered and modified as per your expectations. So, grab it now.
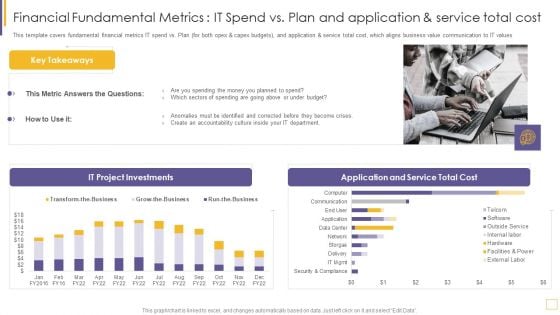
Guidelines For Exhibiting Business Value Of Information And Technology Financial Fundamental Metrics IT Spend Mockup PDF
These indicators assist IT leaders in stewarding technology expenditures and investments, and they are essential to managing the IT company. These measures aid in the management of the departments financial health and may indicate levers for cost reduction, improved resource allocation, and enhanced accountability. Deliver an awe inspiring pitch with this creative guidelines for exhibiting business value of information and technology financial fundamental metrics it spend mockup pdf bundle. Topics like metric, organizations, budget, demonstrate can be discussed with this completely editable template. It is available for immediate download depending on the needs and requirements of the user.
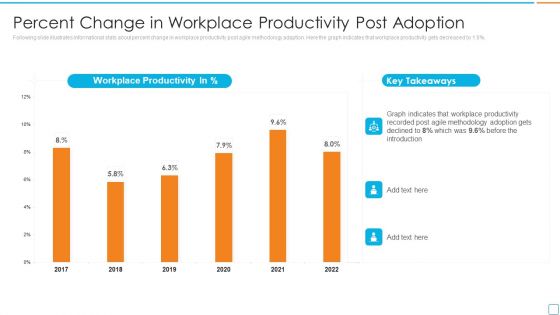
Professional Scrum Master Certification Percent Change In Workplace Productivity Post Adoption Infographics PDF
Following slide illustrates informational stats about percent change in workplace productivity post agile methodology adaption. Here the graph indicates that workplace productivity gets decreased by 1.6 percent. Deliver and pitch your topic in the best possible manner with this professional scrum master certification percent change in workplace productivity post adoption infographics pdf. Use them to share invaluable insights on workplace productivity, 2017 to 2022, graph indicates and impress your audience. This template can be altered and modified as per your expectations. So, grab it now.
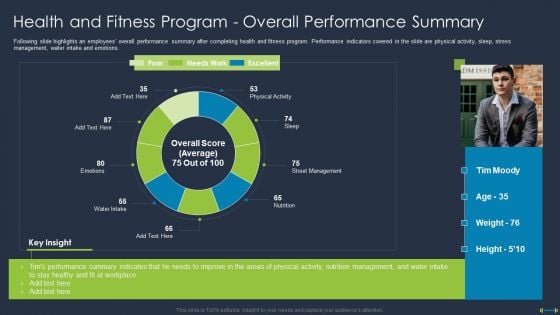
Corporate Physical Health And Fitness Culture Playbook Health And Fitness Program Overall Portrait PDF
Following slide highlights an employees overall performance summary after completing health and fitness program. Performance indicators covered in the slide are physical activity, sleep, stress management, water intake and emotions. Deliver an awe inspiring pitch with this creative corporate physical health and fitness culture playbook health and fitness program overall portrait pdf bundle. Topics like tims performance summary indicates, physical activity, nutrition management can be discussed with this completely editable template. It is available for immediate download depending on the needs and requirements of the user.
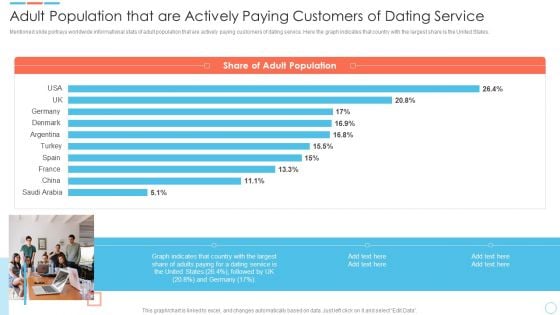
Elevator Online Dating Software Adult Population That Are Actively Paying Customers Guidelines PDF
Mentioned slide portrays worldwide informational stats of adult population that are actively paying customers of dating service. Here the graph indicates that country with the largest share is the United States. Deliver an awe inspiring pitch with this creative Elevator Online Dating Software Adult Population That Are Actively Paying Customers Guidelines PDF bundle. Topics like Share Adult Population, Graph indicates, Customers can be discussed with this completely editable template. It is available for immediate download depending on the needs and requirements of the user.
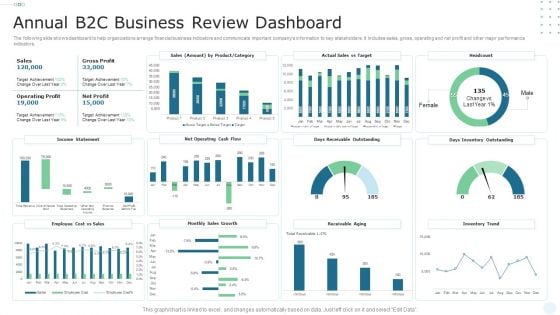
Annual B2C Business Review Dashboard Microsoft PDF
The following slide shows dashboard to help organizations arrange financial business indicators and communicate important companys information to key stakeholders. It includes sales, gross, operating and net profit and other major performance indicators. Showcasing this set of slides titled Annual B2C Business Review Dashboard Microsoft PDF. The topics addressed in these templates are Gross Profit, Sales, Operating Profit. All the content presented in this PPT design is completely editable. Download it and make adjustments in color, background, font etc. as per your unique business setting.
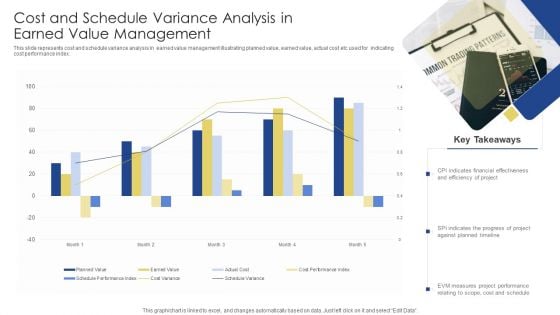
Cost And Schedule Variance Analysis In Earned Value Management Ppt Pictures Design Ideas PDF
This slide represents cost and schedule variance analysis in earned value management illustrating planned value, earned value, actual cost etc used for indicating cost performance index. Showcasing this set of slides titled Cost And Schedule Variance Analysis In Earned Value Management Ppt Pictures Design Ideas PDF. The topics addressed in these templates are CPI Indicates, Financial Effectiveness, Efficiency Project. All the content presented in this PPT design is completely editable. Download it and make adjustments in color, background, font etc. as per your unique business setting.
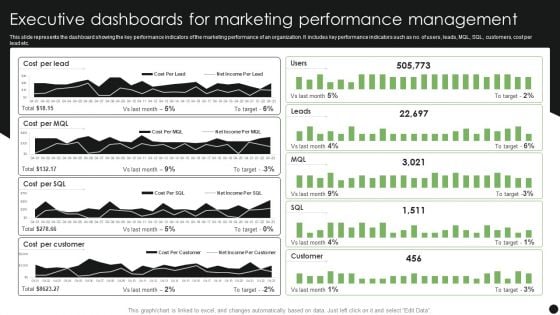
Executive Dashboards For Marketing Performance Management Slides PDF
This slide represents the dashboard showing the key performance indicators of the marketing performance of an organization. It includes key performance indicators such as no. of users, leads, MQL, SQL, customers, cost per lead etc. Pitch your topic with ease and precision using this Executive Dashboards For Marketing Performance Management Slides PDF. This layout presents information on Cost Per Lead, Cost Per Customer. It is also available for immediate download and adjustment. So, changes can be made in the color, design, graphics or any other component to create a unique layout.
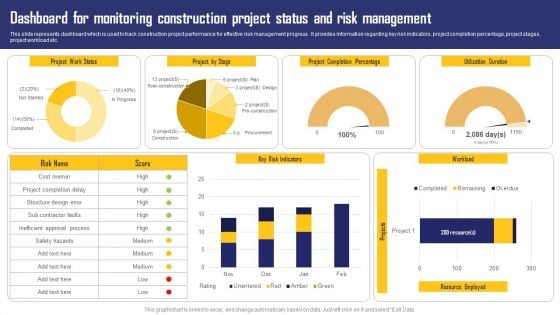
Dashboard For Monitoring Construction Project Status And Risk Management Ideas PDF
This slide represents dashboard which is used to track construction project performance for effective risk management progress . It provides information regarding key risk indicators, project completion percentage, project stages, project workload etc. Pitch your topic with ease and precision using this Dashboard For Monitoring Construction Project Status And Risk Management Ideas PDF. This layout presents information on Project Completion Percentage, Key Risk Indicators, Project By Stage. It is also available for immediate download and adjustment. So, changes can be made in the color, design, graphics or any other component to create a unique layout.
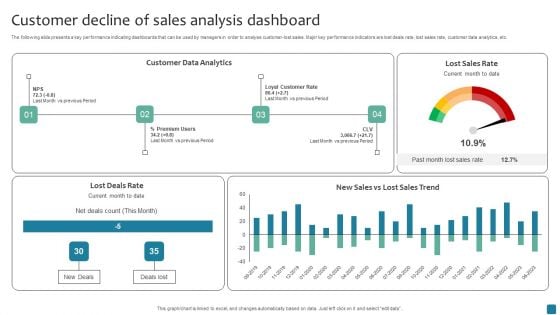
Customer Decline Of Sales Analysis Dashboard Rules PDF
The following slide presents a key performance indicating dashboards that can be used by managers in order to analyse customer-lost sales. Major key performance indicators are lost deals rate, lost sales rate, customer data analytics, etc. Pitch your topic with ease and precision using this Customer Decline Of Sales Analysis Dashboard Rules PDF. This layout presents information on Customer Data Analytics. It is also available for immediate download and adjustment. So, changes can be made in the color, design, graphics or any other component to create a unique layout.
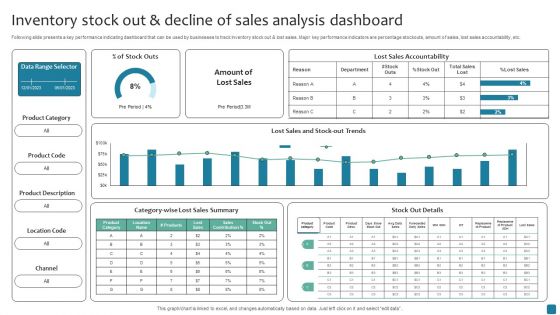
Inventory Stock Out And Decline Of Sales Analysis Dashboard Inspiration PDF
Following slide presents a key performance indicating dashboard that can be used by businesses to track Inventory stock out and lost sales. Major key performance indicators are percentage stockouts, amount of sales, lost sales accountability, etc. Pitch your topic with ease and precision using this Inventory Stock Out And Decline Of Sales Analysis Dashboard Inspiration PDF. This layout presents information on Lost Sales Summary, Stock Out Details It is also available for immediate download and adjustment. So, changes can be made in the color, design, graphics or any other component to create a unique layout.
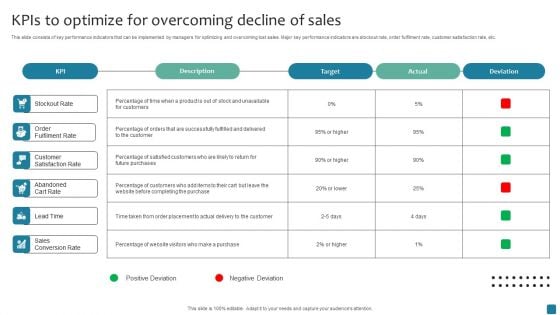
Kpis To Optimize For Overcoming Decline Of Sales Mockup PDF
This slide consists of key performance indicators that can be implemented by managers for optimizing and overcoming lost sales. Major key performance indicators are stockout rate, order fulfilment rate, customer satisfaction rate, etc. Showcasing this set of slides titled Kpis To Optimize For Overcoming Decline Of Sales Mockup PDF. The topics addressed in these templates are Target, Actual, Deviation. All the content presented in this PPT design is completely editable. Download it and make adjustments in color, background, font etc. as per your unique business setting.
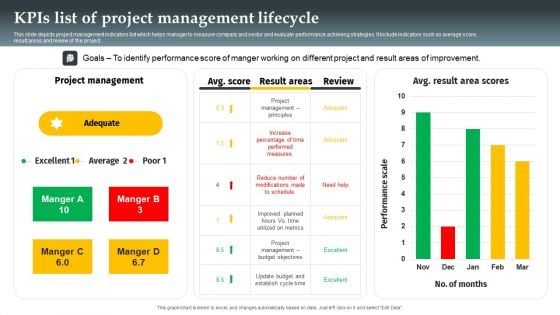
Kpis List Of Project Management Lifecycle Formats PDF
This slide depicts project management indicators list which helps manager to measure company and sector and evaluate performance achieving strategies. It include indicators such as average score, result areas and review of the project. Pitch your topic with ease and precision using this Kpis List Of Project Management Lifecycle Formats PDF. This layout presents information on Project Management, Performance Score, Average. It is also available for immediate download and adjustment. So, changes can be made in the color, design, graphics or any other component to create a unique layout.
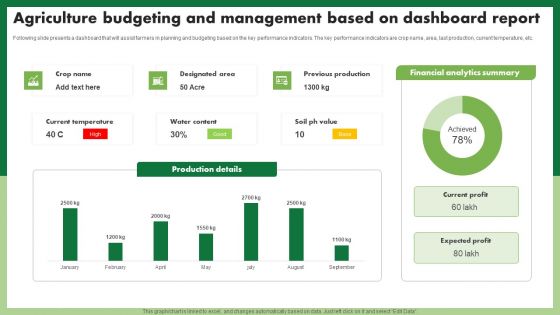
Agriculture Budgeting And Management Based On Dashboard Report Topics PDF
Following slide presents a dashboard that will assist farmers in planning and budgeting based on the key performance indicators. The key performance indicators are crop name, area, last production, current temperature, etc. Showcasing this set of slides titled Agriculture Budgeting And Management Based On Dashboard Report Topics PDF. The topics addressed in these templates are Production Details. All the content presented in this PPT design is completely editable. Download it and make adjustments in color, background, font etc. as per your unique business setting.
Ppt Series Of Continual Free Custom Presentation PowerPoint Charts Plan 4 Image
We present our PPT series of continual free custom presentation PowerPoint charts plan 4 Image. Use our Symbol PowerPoint Templates because, Brilliant ideas are your forte. Use our Shapes PowerPoint Templates because, Focus on each one and investigate which one would be the best fit for your needs. Use our Signs PowerPoint Templates because; Focus the light on the path to sure shot success. Use our Business PowerPoint Templates because; now imprint them on the minds of your audience via our slides. Use our Arrows PowerPoint Templates because; educate your staff on the means to provide the required support for speedy recovery. Use these PowerPoint slides for presentations relating to arrow, arrowheads, badge, banner, cerulean, colored, colorful, connection, design element, designator, directional, download, emblem, indicator, interface, internet, magenta, marker, matted, menu tool, navigation panel, next, orientation, page site, pictogram, pointer, sign. The prominent colors used in the PowerPoint template are Yellow, Gray, and White Subscribe to our Ppt Series Of Continual Free Custom Presentation PowerPoint Charts Plan 4 Image and receive success. Be assured of finding the best projection to highlight your words.
Puzzle Diagram For 2015 Year Diagram With Numeric Puzzles Around Presentation Template
Celebration of new year can be more joyful with our new collection of PPT. this PPT contain the graphic of puzzles and 2015 text. Use this exclusive PPT for your business and marketing related presentation.
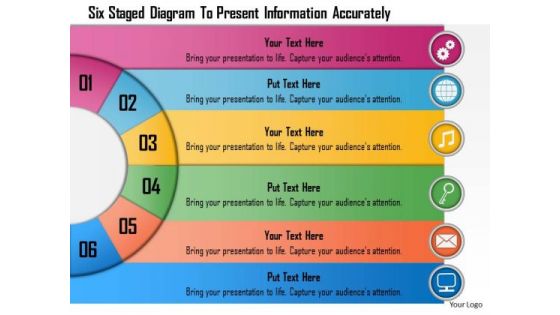
Business Diagram Six Staged Diagram To Present Information Accurately Presentation Template
Six staged semicircular text boxes are used to craft this power point template. This PPT contains the concept of data representation. Use this PPT for your business and sales related data representation in any presentation.
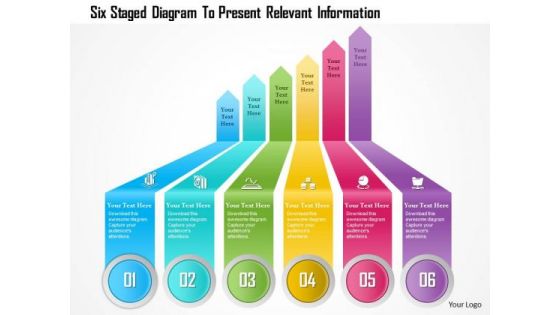
Business Diagram Six Staged Diagram To Present Relevant Information Presentation Template
Six staged colorful ribbon text boxes has been used to craft this power point template. This PPT contains the concept of data representation. This PPT is suitable for your data related topics in any business and marketing presentation.
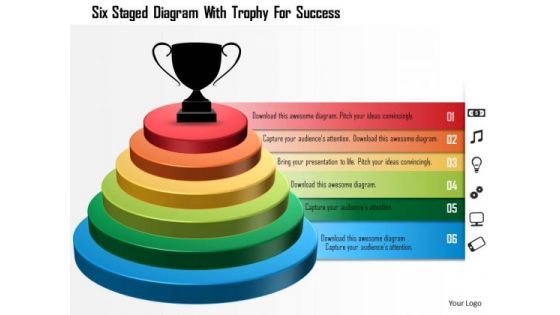
Business Diagram Six Staged Diagram With Trophy For Success Presentation Template
Six staged colorful ribbon text boxes has been used to craft this power point template. This PPT contains the concept of data representation. This PPT is suitable for your data related topics in any business and marketing presentation.
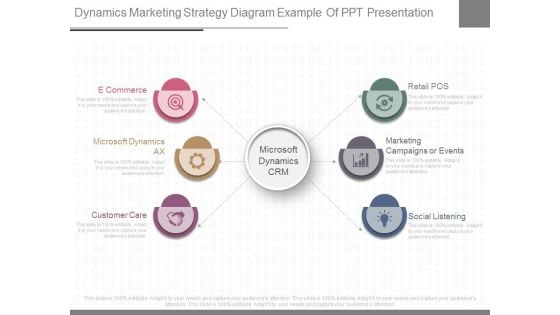
Dynamics Marketing Strategy Diagram Example Of Ppt Presentation
This is a dynamics marketing strategy diagram example of ppt presentation. This is a six stage process. The stages in this process are e commerce, microsoft dynamics ax, customer care, retail pos, marketing campaigns or events, social listening, microsoft dynamics crm.
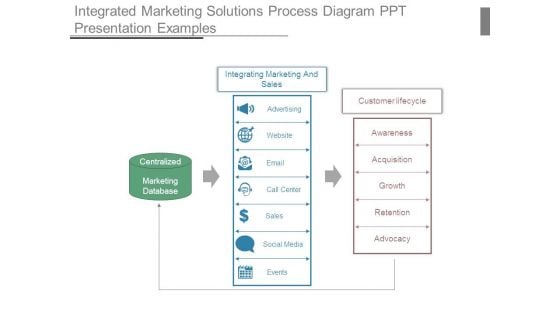
Integrated Marketing Solutions Process Diagram Ppt Presentation Examples
This is a integrated marketing solutions process diagram ppt presentation examples. This is a three stage process. The stages in this process are centralized, marketing database, integrating marketing and sales, advertising, website, email, call center, sales, social media, events, customer lifecycle, awareness, acquisition, growth, retention, advocacy.
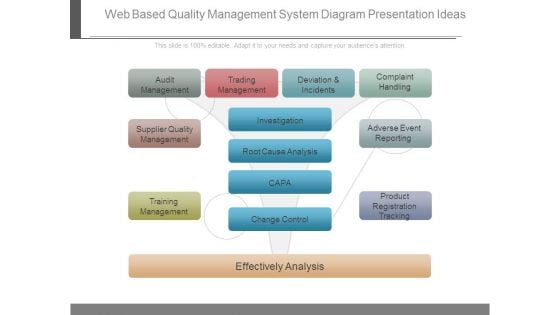
Web Based Quality Management System Diagram Presentation Ideas
This is a web based quality management system diagram presentation ideas. This is a six stage process. The stages in this process are audit management, trading management, deviation and incidents, complaint handling, supplier quality management, training management, effectively analysis, investigation, root cause analysis, capa, change control, adverse event reporting, product registration tracking.
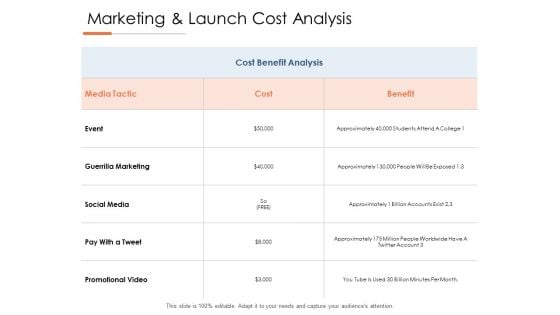
Marketing And Launch Cost Analysis Ppt PowerPoint Presentation Summary Diagrams
Presenting this set of slides with name marketing and launch cost analysis ppt powerpoint presentation summary diagrams. The topics discussed in these slides are event, guerrilla marketing, social media, pay with a tweet, promotional video. This is a completely editable PowerPoint presentation and is available for immediate download. Download now and impress your audience.
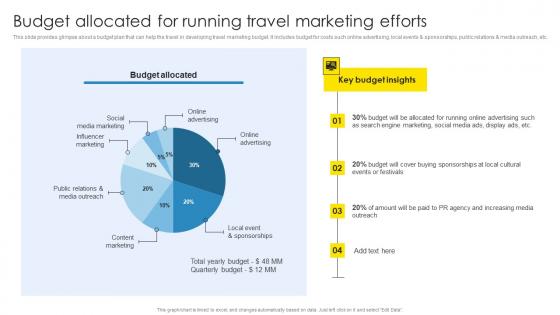
Strategic Marketing Plan Budget Allocated For Running Travel Marketing Efforts Topics Pdf
This slide provides glimpse about a budget plan that can help the travel in developing travel marketing budget. It includes budget for costs such online advertising, local events and sponsorships, public relations and media outreach, etc. Whether you have daily or monthly meetings, a brilliant presentation is necessary. Strategic Marketing Plan Assessing Multiple Business Marketing Channels Themes Pdf can be your best option for delivering a presentation. Represent everything in detail using Strategic Marketing Plan Assessing Multiple Business Marketing Channels Themes Pdf and make yourself stand out in meetings. The template is versatile and follows a structure that will cater to your requirements. All the templates prepared by Slidegeeks are easy to download and edit. Our research experts have taken care of the corporate themes as well. So, give it a try and see the results. This slide provides glimpse about a budget plan that can help the travel in developing travel marketing budget. It includes budget for costs such online advertising, local events and sponsorships, public relations and media outreach, etc.
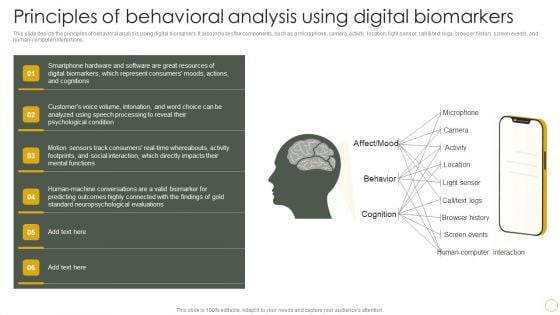
Digital Resilience Biomarker Technologies IT Principles Of Behavioral Analysis Using Digital Biomarkers Themes PDF
This slide depicts the principles of behavioral analysis using digital biomarkers. It also includes the components, such as a microphone, camera, activity, location, light sensor, call And text logs, browser history, screen events, and human-computer interactions. Whether you have daily or monthly meetings, a brilliant presentation is necessary. Digital Resilience Biomarker Technologies IT Principles Of Behavioral Analysis Using Digital Biomarkers Themes PDF can be your best option for delivering a presentation. Represent everything in detail using Digital Resilience Biomarker Technologies IT Principles Of Behavioral Analysis Using Digital Biomarkers Themes PDF and make yourself stand out in meetings. The template is versatile and follows a structure that will cater to your requirements. All the templates prepared by Slidegeeks are easy to download and edit. Our research experts have taken care of the corporate themes as well. So, give it a try and see the results.
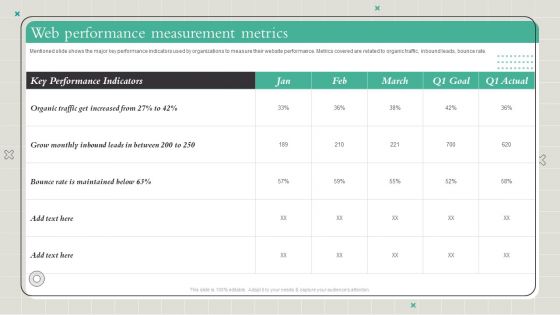
Playbook To Formulate Efficient Web Performance Measurement Metrics Diagrams PDF
Mentioned slide shows the major key performance indicators used by organizations to measure their website performance. Metrics covered are related to organic traffic, inbound leads, bounce rate. Slidegeeks has constructed Playbook To Formulate Efficient Web Performance Measurement Metrics Diagrams PDF after conducting extensive research and examination. These presentation templates are constantly being generated and modified based on user preferences and critiques from editors. Here, you will find the most attractive templates for a range of purposes while taking into account ratings and remarks from users regarding the content. This is an excellent jumping-off point to explore our content and will give new users an insight into our top-notch PowerPoint Templates.
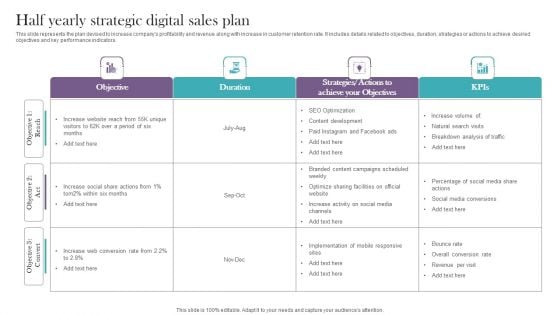
Half Yearly Strategic Digital Sales Plan Diagrams PDF
This slide represents the plan devised to increase companys profitability and revenue along with increase in customer retention rate. It includes details related to objectives, duration, strategies or actions to achieve desired objectives and key performance indicators. Showcasing this set of slides titled Half Yearly Strategic Digital Sales Plan Diagrams PDF. The topics addressed in these templates are Natural Search Visits, Breakdown Analysis Traffic. All the content presented in this PPT design is completely editable. Download it and make adjustments in color, background, font etc. as per your unique business setting.
Booting Brand Image By Tracking KPI Metrics Diagrams PDF
This slide consists of key performance indicators to be used by mangers to track the brand awareness . Key metrices covered are content reach, brand mention, blog shares, search volume data, repeat purchase and organic traffic. Showcasing this set of slides titled Booting Brand Image By Tracking KPI Metrics Diagrams PDF. The topics addressed in these templates are Content Reach, Brand Mentions, Blog Shares. All the content presented in this PPT design is completely editable. Download it and make adjustments in color, background, font etc. as per your unique business setting.
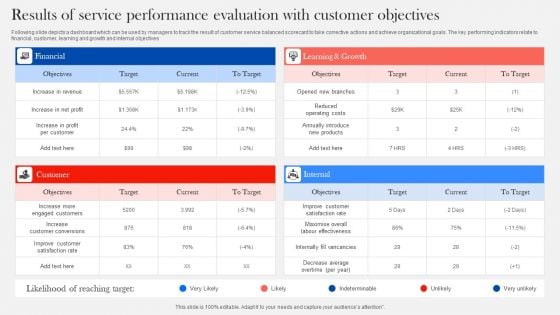
Results Of Service Performance Evaluation With Customer Objectives Diagrams PDF
Following slide depicts a dashboard which can be used by managers to track the result of customer service balanced scorecard to take corrective actions and achieve organizational goals. The key performing indicators relate to financial, customer, learning and growth and internal objectives. Showcasing this set of slides titled Results Of Service Performance Evaluation With Customer Objectives Diagrams PDF. The topics addressed in these templates are Financial, Customer, Internal. All the content presented in this PPT design is completely editable. Download it and make adjustments in color, background, font etc. as per your unique business setting.
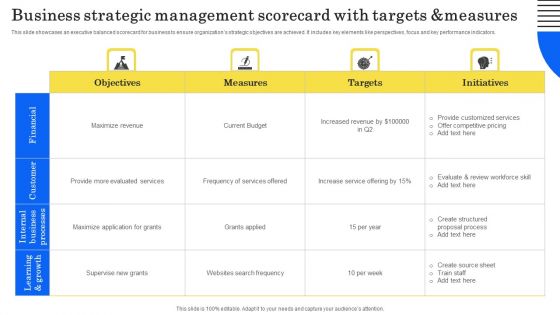
Business Strategic Management Scorecard With Targets And Measures Diagrams PDF
This slide showcases an executive balanced scorecard for business to ensure organizations strategic objectives are achieved. It includes key elements like perspectives, focus and key performance indicators. Showcasing this set of slides titled Business Strategic Management Scorecard With Targets And Measures Diagrams PDF. The topics addressed in these templates are Provide Customized Services, Offer Competitive Pricing, Grants Applied. All the content presented in this PPT design is completely editable. Download it and make adjustments in color, background, font etc. as per your unique business setting.
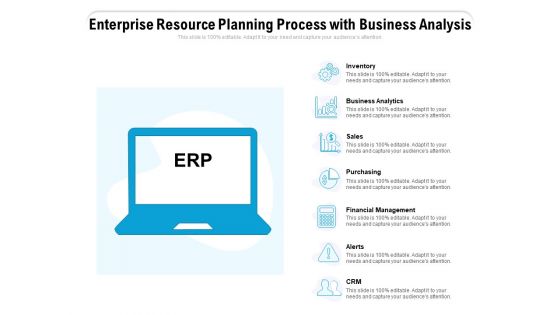
Enterprise Resource Planning Process With Business Analysis Ppt Powerpoint Presentation Styles Portfolio Pdf
Presenting enterprise resource planning process with business analysis ppt powerpoint presentation styles portfolio pdf to dispense important information. This template comprises seven stages. It also presents valuable insights into the topics including crm, alerts, financial management, purchasing, sales, business analytics, inventory. This is a completely customizable PowerPoint theme that can be put to use immediately. So, download it and address the topic impactfully
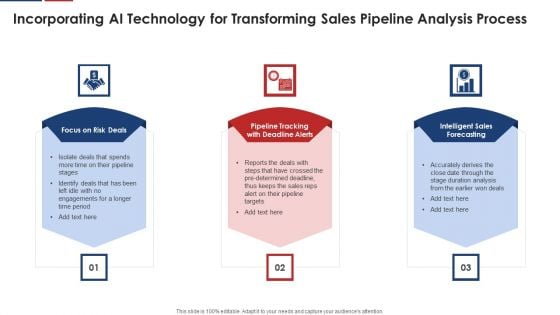
Incorporating Ai Technology For Transforming Sales Pipeline Analysis Process Mockup PDF
Presenting incorporating ai technology for transforming sales pipeline analysis process mockup pdf to dispense important information. This template comprises three stages. It also presents valuable insights into the topics including focus on risk deals, tracking with deadline alerts, intelligent sales forecasting. This is a completely customizable PowerPoint theme that can be put to use immediately. So, download it and address the topic impactfully.
Famous Business People 3d Men Lifting Graph Piece PowerPoint Theme Slides
We present our famous business people 3d men lifting graph piece powerpoint theme Slides.Use our Business PowerPoint Templates because Our PowerPoint Templates and Slides help you meet the demand of the Market. Just browse and pick the slides that appeal to your intuitive senses. Download and present our People PowerPoint Templates because They will Put your wonderful verbal artistry on display. Our PowerPoint Templates and Slides will provide you the necessary glam and glitter. Download our Teamwork PowerPoint Templates because It will Raise the bar of your Thoughts. They are programmed to take you to the next level. Use our Success PowerPoint Templates because Our PowerPoint Templates and Slides provide you with a vast range of viable options. Select the appropriate ones and just fill in your text. Use our Shapes PowerPoint Templates because Our PowerPoint Templates and Slides are specially created by a professional team with vast experience. They diligently strive to come up with the right vehicle for your brilliant Ideas. Use these PowerPoint slides for presentations relating to 3d, achievement, bar, business, businessman, cartoon, chart, concept, diagram, finance, graph, growth, holding, illustration, investment, moving, progress, puppets, green, rendering, report, standing, teamwork, up, wealth, white. The prominent colors used in the PowerPoint template are Red, Gray, Yellow. Fade in our Famous Business People 3d Men Lifting Graph Piece PowerPoint Theme Slides with your thoughts. Your ideas will sound even better.
Process Steps In Organized Manner 6 Sample Business Plan Pdf PowerPoint Templates
We present our process steps in organized manner 6 sample business plan pdf PowerPoint templates.Use our Process and Flows PowerPoint Templates because motivating your team will cross all barriers. Download our Flow charts PowerPoint Templates because you should explain the process by which you intend to right it. Use our Business PowerPoint Templates because The foundation of the structure of your business is resilient and dependable. Convey this confidence to your colleagues and assure them of a great and enduring future. Use our Arrows PowerPoint Templates because by using this slide you can Heighten the anticipation of your audience listing . Present our Shapes PowerPoint Templates because you are the star of your enlightened team.Use these PowerPoint slides for presentations relating to Access, arrows, background, banner, yellow, bright, business, chart, color, colorful, concept, conceptual, connection, corporate, creative, cycle, design, different, element, empty, form, frame, graphic, green, group, idea, illustration, match, order, part, piece, place, process, shape, solution, special, speech, strategy, symbol. The prominent colors used in the PowerPoint template are Green, Gray, White. The feedback we get is that our process steps in organized manner 6 sample business plan pdf PowerPoint templates are designed to make your presentations professional. The feedback we get is that our bright PowerPoint templates and PPT Slides are Stunning. People tell us our process steps in organized manner 6 sample business plan pdf PowerPoint templates are Luxurious. We assure you our banner PowerPoint templates and PPT Slides are Vintage. We assure you our process steps in organized manner 6 sample business plan pdf PowerPoint templates are effectively colour coded to prioritise your plans They automatically highlight the sequence of events you desire. The feedback we get is that our banner PowerPoint templates and PPT Slides are Fashionable. with our Process Steps In Organized Manner 6 Sample Business Plan Pdf PowerPoint Templates. Dont pass up this opportunity to shine.
PowerPoint Template Business Leadership 3d Circle Chart Process Ppt Presentation Designs
PowerPoint Template Business Leadership 3d Circle chart process PPT Presentation Designs-These high quality powerpoint pre-designed slides and powerpoint templates have been carefully created by our professional team to help you impress your audience. All slides have been created and are 100% editable in powerpoint. Each and every property of any graphic - color, size, orientation, shading, outline etc. can be modified to help you build an effective powerpoint presentation. Any text can be entered at any point in the powerpoint template or slide. Simply DOWNLOAD, TYPE and PRESENT! Lead your attack with our PowerPoint Template Business Leadership 3d Circle Chart Process Ppt Presentation Designs. You will come out on top.
PowerPoint Template Company Strategy 3d Circular Chart Process Ppt Presentation Designs
PowerPoint Template Company Strategy 3d Circular Chart process PPT Presentation Designs-These high quality powerpoint pre-designed slides and powerpoint templates have been carefully created by our professional team to help you impress your audience. All slides have been created and are 100% editable in powerpoint. Each and every property of any graphic - color, size, orientation, shading, outline etc. can be modified to help you build an effective powerpoint presentation. Any text can be entered at any point in the powerpoint template or slide. Simply DOWNLOAD, TYPE and PRESENT! Our PowerPoint Template Company Strategy 3d Circular Chart Process Ppt Presentation Designs are aces at conflict control. Convert divergence into convergence.
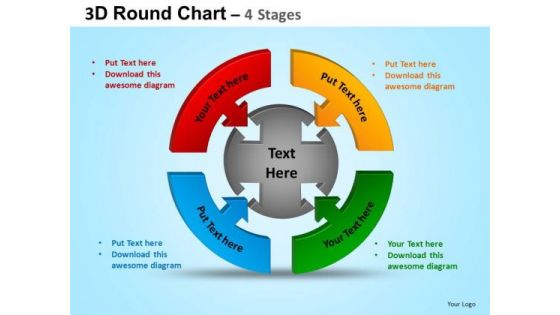
PowerPoint Design Slides Graphic Round Process Flow Chart Ppt Slide Designs
PowerPoint Design Slides Graphic Round Process Flow Chart PPT Slide Designs-These amazing PowerPoint pre-designed slides and PowerPoint templates have been carefully created by our team of experts to help you impress your audience. Our stunning collection of Powerpoint slides are 100% editable and can easily fit in any PowerPoint presentations. By using these animations and graphics in PowerPoint and you can easily make professional presentations. Any text can be entered at any point in the PowerPoint template or slide. Just DOWNLOAD our awesome PowerPoint templates and you are ready to go. Examine every deatail with our PowerPoint Design Slides Graphic Round Process Flow Chart Ppt Slide Designs. Put each element to the test.
Bar Graph Pie Chart Business Growth PowerPoint Templates Ppt Backgrounds For Slides 0413
We present our Bar Graph Pie Chart Business Growth PowerPoint Templates PPT Backgrounds For Slides 0413.Present our Pie charts PowerPoint Templates because It can be used to Set your controls for the heart of the sun. Our PowerPoint Templates and Slides will be the propellant to get you there. Use our Business PowerPoint Templates because Our PowerPoint Templates and Slides are effectively colour coded to prioritise your plans They automatically highlight the sequence of events you desire. Use our Shapes PowerPoint Templates because Our PowerPoint Templates and Slides will Embellish your thoughts. They will help you illustrate the brilliance of your ideas. Use our Signs PowerPoint Templates because Our PowerPoint Templates and Slides will let you Clearly mark the path for others to follow. Use our Process and Flows PowerPoint Templates because Our PowerPoint Templates and Slides will let your ideas bloom. Create a bed of roses for your audience.Use these PowerPoint slides for presentations relating to Bar graph and pie chart, pie charts, shapes, signs, business, process and flows. The prominent colors used in the PowerPoint template are Red, Green, Blue. Cull any confusion with our Bar Graph Pie Chart Business Growth PowerPoint Templates Ppt Backgrounds For Slides 0413. Your thoughtswill be consistent and cogent.
Bar And X Y Chart For Financial Growth PowerPoint Templates Ppt Backgrounds For Slides 0413
We present our Bar And X Y Chart For Financial Growth PowerPoint Templates PPT Backgrounds For Slides 0413.Download and present our Business PowerPoint Templates because You are working at that stage with an air of royalty. Let our PowerPoint Templates and Slides be the jewels in your crown. Download our Pie charts PowerPoint Templates because Our PowerPoint Templates and Slides are effectively colour coded to prioritise your plans They automatically highlight the sequence of events you desire. Use our Shapes PowerPoint Templates because It will Strengthen your hand with your thoughts. They have all the aces you need to win the day. Use our Signs PowerPoint Templates because You are working at that stage with an air of royalty. Let our PowerPoint Templates and Slides be the jewels in your crown. Present our Process and Flows PowerPoint Templates because Our PowerPoint Templates and Slides are innately eco-friendly. Their high recall value negate the need for paper handouts.Use these PowerPoint slides for presentations relating to Bar graph and pie chart, pie charts, shapes, signs, business, process and flows. The prominent colors used in the PowerPoint template are Blue, Red, Green. Our Bar And X Y Chart For Financial Growth PowerPoint Templates Ppt Backgrounds For Slides 0413 will never fight shy. They are confident of addressing any and every issue.
3d Man Presenting Pie Chart Business PowerPoint Templates Ppt Backgrounds For Slides 0413
We present our 3d Man Presenting Pie Chart Business PowerPoint Templates PPT Backgrounds For Slides 0413.Present our People PowerPoint Templates because They will Put the wind in your sails. Skim smoothly over the choppy waters of the market. Use our Pie Charts PowerPoint Templates because Our PowerPoint Templates and Slides are effectively colour coded to prioritise your plans They automatically highlight the sequence of events you desire. Download and present our Business PowerPoint Templates because They will Put your wonderful verbal artistry on display. Our PowerPoint Templates and Slides will provide you the necessary glam and glitter. Use our Success PowerPoint Templates because You are well armed with penetrative ideas. Our PowerPoint Templates and Slides will provide the gunpowder you need. Download and present our Marketing PowerPoint Templates because You can Create a matrix with our PowerPoint Templates and Slides. Feel the strength of your ideas click into place.Use these PowerPoint slides for presentations relating to Character presenting bar chart, people, pie charts, business, success, marketing. The prominent colors used in the PowerPoint template are Red, White, Green. Take the plunge with our 3d Man Presenting Pie Chart Business PowerPoint Templates Ppt Backgrounds For Slides 0413. Success will surely ensue.
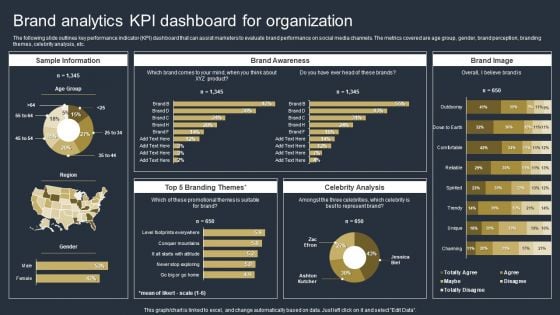
Comprehensive Market Research Guide Brand Analytics Kpi Dashboard For Organization Brochure PDF
The following slide outlines key performance indicator KPI dashboard that can assist marketers to evaluate brand performance on social media channels. The metrics covered are age group, gender, brand perception, branding themes, celebrity analysis, etc. From laying roadmaps to briefing everything in detail, our templates are perfect for you. You can set the stage with your presentation slides. All you have to do is download these easy-to-edit and customizable templates. Comprehensive Market Research Guide Brand Analytics Kpi Dashboard For Organization Brochure PDF will help you deliver an outstanding performance that everyone would remember and praise you for. Do download this presentation today.
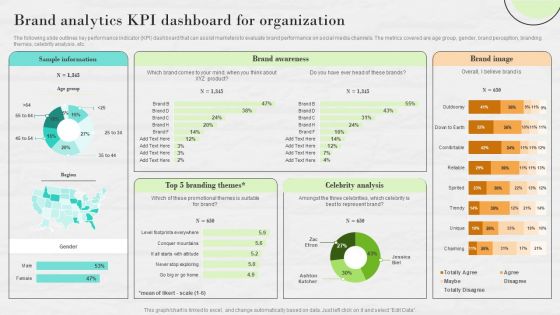
Market Research To Determine Business Opportunities Brand Analytics KPI Dashboard For Organization Inspiration PDF
The following slide outlines key performance indicator KPI dashboard that can assist marketers to evaluate brand performance on social media channels. The metrics covered are age group, gender, brand perception, branding themes, celebrity analysis, etc. There are so many reasons you need a Market Research To Determine Business Opportunities Brand Analytics KPI Dashboard For Organization Inspiration PDF. The first reason is you cannot spend time making everything from scratch, Thus, Slidegeeks has made presentation templates for you too. You can easily download these templates from our website easily.

PowerPoint Slide Designs Leadership Arrows In Circle Ppt Design
PowerPoint Slide Designs Leadership Arrows In Circle PPT Design-The arrows indicate the progression of the process. Constant monitoring of the processes provides you with opportunities to concentrate on the core competencies in your business and improve the standards for more effective results.-PowerPoint Slide Designs Leadership Arrows In Circle PPT Design Embarrass your brother with our PowerPoint Slide Designs Leadership Arrows In Circle Ppt Design. Just download, type and present.
PowerPoint Templates Business Multicolor Puzzle Diagram Ppt Slides
PowerPoint Templates Business Multicolor Puzzle Diagram PPT Slides-This PowerPoint slide shows 3 multicolor puzzles diagram. There is a lot of space available for writing your text. You can easily edit the size, position, text, color. \n\n-PowerPoint Templates Business Multicolor Puzzle Diagram PPT Slides Affiliate our PowerPoint Templates Business Multicolor Puzzle Diagram Ppt Slides to your thoughts. They will develop an affinity for them.

White And Yellow Bar Graph Business Shapes PowerPoint Templates And PowerPoint Themes 1012
White And Yellow Bar Graph Business Shapes PowerPoint Templates And PowerPoint Themes 1012-Use this Above PowerPoint Template Displaying the Bar Graph in Circular Manner. It indicates beefing up, boost, buildup, crop, cultivation, enlargement, evolution, gain, heightening, hike, improvement, increase. Original thinking is the need of the hour. We provide the means to project your views.-White And Yellow Bar Graph Business Shapes PowerPoint Templates And PowerPoint Themes 1012-This PowerPoint template can be used for presentations relating to-Bar graph showing the growth, business, finance, success, marketing, shapes The environment deserves constant attention. Keep an eye through our White And Yellow Bar Graph Business Shapes PowerPoint Templates And PowerPoint Themes 1012.
Five Colors Piggy Bank Finance PowerPoint Templates And PowerPoint Themes 1012
Five Colors Piggy Bank Finance PowerPoint Templates And PowerPoint Themes 1012-Use this Graphical PowerPoint Template showing colorful Piggy banks. It indicates Savings, investments, reserves, nest egg, funds, hoard, stash, money etc. Clear thinking is your strength. Transmit your thoughts to your eager team. Adjust the above image in your PPT presentations to visually support your content in your Investment PPT slideshows.-Five Colors Piggy Bank Finance PowerPoint Templates And PowerPoint Themes 1012-This PowerPoint template can be used for presentations relating to-Five piggy bank in different colors, money, business, success, finance, symbol Correct wrongs with our Five Colors Piggy Bank Finance PowerPoint Templates And PowerPoint Themes 1012. Download without worries with our money back guaranteee.

 Home
Home