Number Infographic
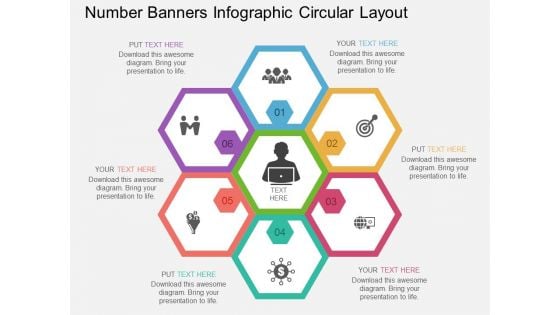
Number Banners Infographic Circular Layout Powerpoint Template
This business diagram contains business Infographic. Our professionally designed business diagram helps to depict business analysis. Enlighten your audience with your breathtaking ideas.
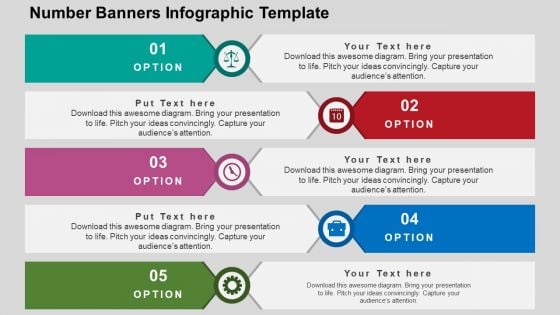
Number Banners Infographic Template PowerPoint Templates
This PPT template is often used in the business presentations or even otherwise. It has simple basic structure. Given are the four multicolored optional banners and attached with them are the non-colored banners. You can easily use them in giving or showing your options. You can put questions or can give them choices to choose from those four options. Again a multipurpose slide that can be used to put in any way you want. It can easily be rearranged. This PowerPoint template is simple yet elegant and is a perfect slide for your presentation. Choose this slide and leave an impression on your customers.
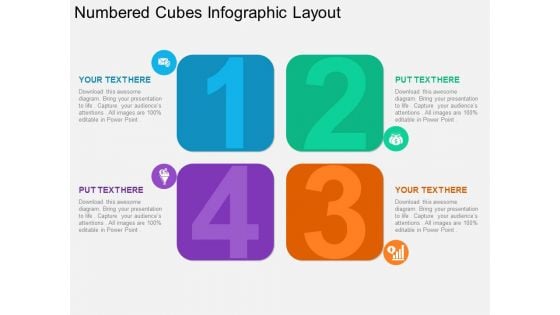
Numbered Cubes Infographic Layout Powerpoint Template
Deliver amazing presentations with our above template showing numbered cubes infographic. You may download this slide to display steps of planning process. Capture the attention of your audience using this diagram.
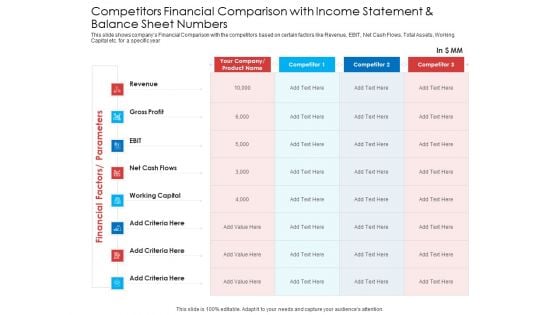
Competitors Financial Comparison With Income Statement And Balance Sheet Numbers Infographics PDF
This slide shows companys Financial Comparison with the competitors based on certain factors like Revenue, EBIT, Net Cash Flows, Total Assets, Working Capital etc. for a specific year. Deliver an awe-inspiring pitch with this creative competitors financial comparison with income statement and balance sheet numbers infographics pdf bundle. Topics like revenue, gross profit, net cash flows, working capital, competitor can be discussed with this completely editable template. It is available for immediate download depending on the needs and requirements of the user.
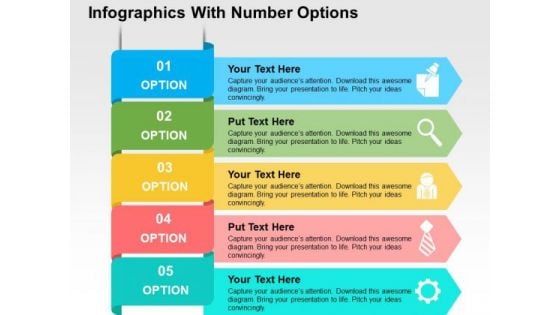
Infographics With Number Options PowerPoint Templates
This PowerPoint template has been designed with numbered list of options. This Infographics template useful for text display. Accelerate the impact of your ideas using this template.
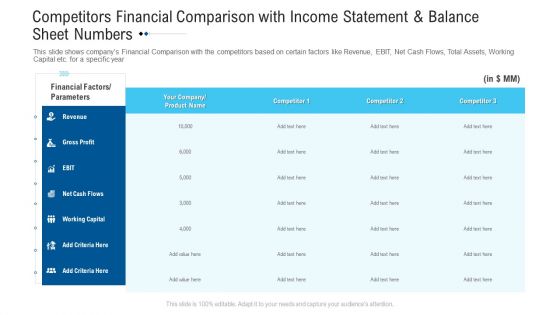
Funding Deck Raise Grant Funds Public Organizations Competitors Financial Comparison With Income Statement And Balance Sheet Numbers Infographics PDF
This slide shows companys Financial Comparison with the competitors based on certain factors like Revenue, EBIT, Net Cash Flows, Total Assets, Working Capital etc. for a specific year. Deliver and pitch your topic in the best possible manner with this funding deck raise grant funds public organizations competitors financial comparison with income statement and balance sheet numbers infographics pdf. Use them to share invaluable insights on financial factors parameters, competitor, revenue, net cash flows, gross profit and impress your audience. This template can be altered and modified as per your expectations. So, grab it now.
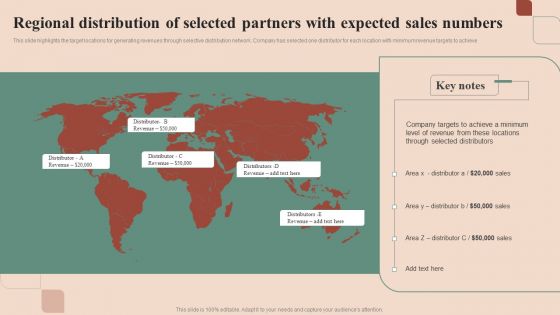
Maximizing Profit Returns With Right Distribution Source Regional Distribution Of Selected Partners With Expected Sales Numbers Infographics PDF
This slide shows improvement in return on investment with the implementation of new distribution strategies. These are in the form of increase in customer base, improved margins, improved brand image etc. Retrieve professionally designed Maximizing Profit Returns With Right Distribution Source Regional Distribution Of Selected Partners With Expected Sales Numbers Infographics PDF to effectively convey your message and captivate your listeners. Save time by selecting pre-made slideshows that are appropriate for various topics, from business to educational purposes. These themes come in many different styles, from creative to corporate, and all of them are easily adjustable and can be edited quickly. Access them as PowerPoint templates or as Google Slides themes. You dont have to go on a hunt for the perfect presentation because Slidegeeks got you covered from everywhere.
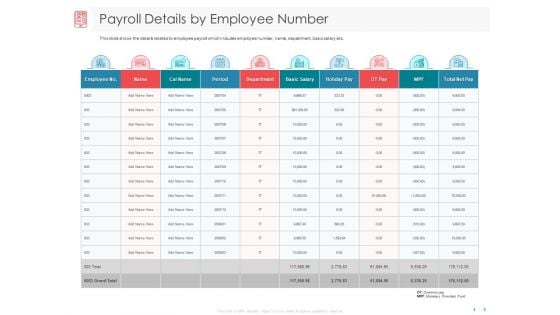
Managing CFO Services Payroll Details By Employee Number Ppt Infographic Template Clipart Images PDF
Presenting this set of slides with name managing cfo services payroll details by employee number ppt infographic template clipart images pdf. The topics discussed in these slides are employee no., name, call name, period, department, basic salary, holiday pay, ot pay, mpf, total net pay. This is a completely editable PowerPoint presentation and is available for immediate download. Download now and impress your audience.
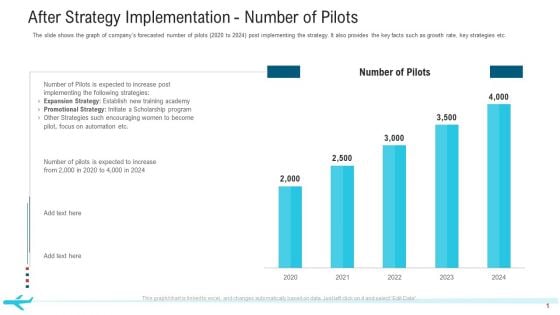
After Strategy Implementation Number Of Pilots Infographics PDF
The slide shows the graph of companys forecasted number of pilots 2020 to 2024 post implementing the strategy. It also provides the key facts such as growth rate, key strategies etc. Deliver an awe-inspiring pitch with this creative after strategy implementation number of pilots infographics pdf. bundle. Topics like after strategy implementation number of pilots. 2020 to 2024 can be discussed with this completely editable template. It is available for immediate download depending on the needs and requirements of the user.
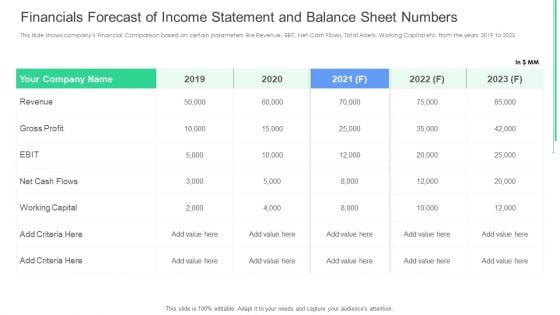
Financials Forecast Of Income Statement And Balance Sheet Numbers Ppt Infographic Template Template PDF
This slide shows companys Financial Comparison based on certain parameters like Revenue, EBIT, Net Cash Flows, Total Assets, Working Capital etc. from the years 2019 to 2023. Deliver and pitch your topic in the best possible manner with this financials forecast of income statement and balance sheet numbers ppt infographic template template pdf. Use them to share invaluable insights on revenue, gross profit, net cash flows, working capital, value and impress your audience. This template can be altered and modified as per your expectations. So, grab it now.
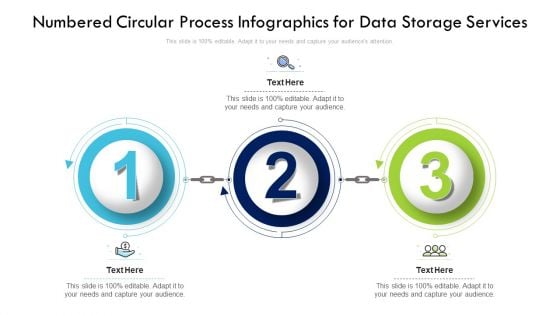
Numbered Circular Process Infographics For Data Storage Services Structure PDF
Presenting numbered circular process infographics for data storage services structure pdf to dispense important information. This template comprises three stages. It also presents valuable insights into the topics including numbered circular process infographics for data storage services. This is a completely customizable PowerPoint theme that can be put to use immediately. So, download it and address the topic impactfully.
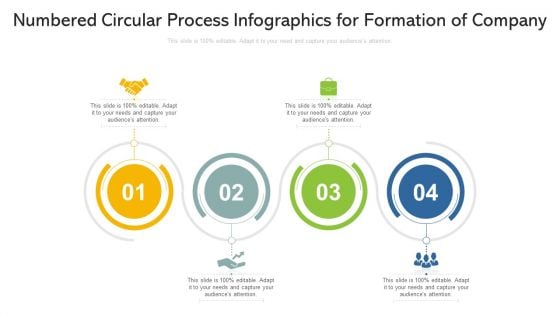
Numbered Circular Process Infographics For Formation Of Company Slides PDF
Persuade your audience using this numbered circular process infographics for formation of company slides pdf. This PPT design covers four stages, thus making it a great tool to use. It also caters to a variety of topics including numbered circular process infographics for formation of company. Download this PPT design now to present a convincing pitch that not only emphasizes the topic but also showcases your presentation skills.

Multinational Financial Crisis 2008 Financial Crisis Impact Explained In Numbers Ppt Infographics Example File PDF
Deliver and pitch your topic in the best possible manner with this multinational financial crisis 2008 financial crisis impact explained in numbers ppt infographics example file pdf. Use them to share invaluable insights on prices, treasury, market, unemployment, federal and impress your audience. This template can be altered and modified as per your expectations. So, grab it now.
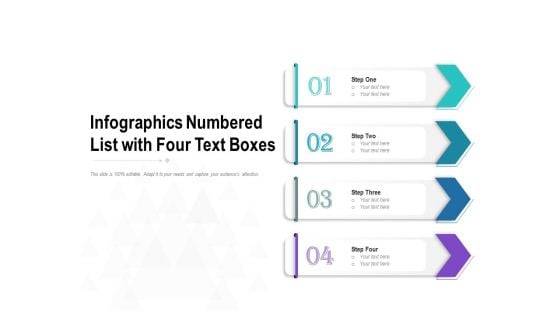
Infographics Numbered List With Four Text Boxes Ppt PowerPoint Presentation Infographics Deck
Presenting this set of slides with name infographics numbered list with four text boxes ppt powerpoint presentation infographics deck. This is a four stage process. The stages in this process are infographics numbered list with four text boxes. This is a completely editable PowerPoint presentation and is available for immediate download. Download now and impress your audience.
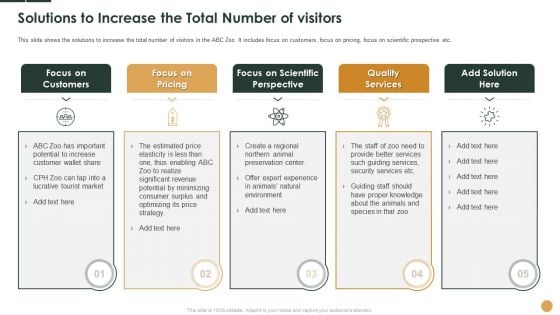
Solutions To Increase The Total Number Of Visitors Ppt Infographic Template Sample PDF
This slide shows the solutions to increase the total number of visitors in the ABC Zoo. It includes focus on customers, focus on pricing, focus on scientific prospective etc.Presenting solutions to increase the total number of visitors ppt infographic template sample pdf. to provide visual cues and insights. Share and navigate important information on five stages that need your due attention. This template can be used to pitch topics like focus on customers, focus on scientific perspective, quality services In addtion, this PPT design contains high resolution images, graphics, etc, that are easily editable and available for immediate download.

Business Team Standing In Shape Of Number One Ppt PowerPoint Presentation Infographic Template Styles PDF
Presenting business team standing in shape of number one ppt powerpoint presentation infographic template styles pdf to dispense important information. This template comprises three stages. It also presents valuable insights into the topics including business team, standing in shape of number one. This is a completely customizable PowerPoint theme that can be put to use immediately. So, download it and address the topic impactfully.
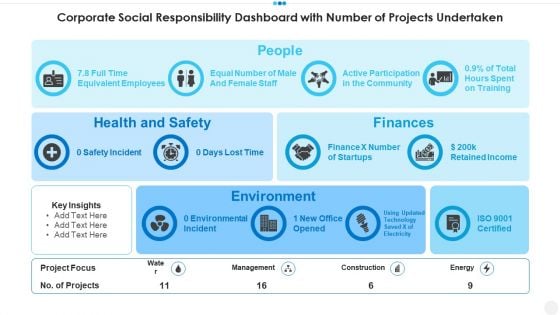
Corporate Social Responsibility Dashboard With Number Of Projects Undertaken Infographics PDF
Showcasing this set of slides titled corporate social responsibility dashboard with number of projects undertaken infographics pdf. The topics addressed in these templates are people, finances, environment, health and safety . All the content presented in this PPT design is completely editable. Download it and make adjustments in color, background, font etc. as per your unique business setting.
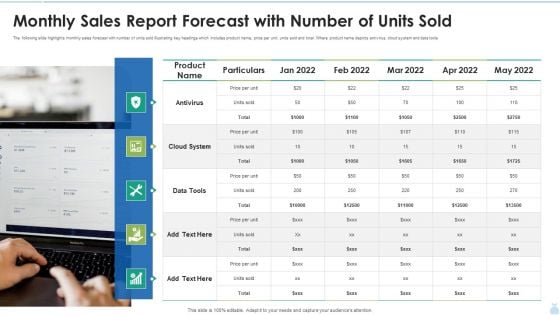
Monthly Sales Report Forecast With Number Of Units Sold Infographics PDF
The following slide highlights monthly sales forecast with number of units sold illustrating key headings which includes product name, price per unit, units sold and total. Where product name depicts antivirus, cloud system and data tools. Presenting Monthly Sales Report Forecast With Number Of Units Sold Infographics PDF to provide visual cues and insights. Share and navigate important information on five stages that need your due attention. This template can be used to pitch topics like Monthly Sales Report, Units Sold, Cloud System. In addtion, this PPT design contains high resolution images, graphics, etc, that are easily editable and available for immediate download.
Number Bullet List Vector Icon Ppt Powerpoint Presentation Infographics Clipart
Presenting this set of slides with name number bullet list vector icon ppt powerpoint presentation infographics clipart. The topics discussed in these slides are number icon, mathematical, number bar vector. This is a completely editable PowerPoint presentation and is available for immediate download. Download now and impress your audience.

Gold Medal For Number One Position Ppt PowerPoint Presentation Infographic Template Infographics
This is a gold medal for number one position ppt powerpoint presentation infographic template infographics. This is a one stage process. The stages in this process are award, prize, trophy.
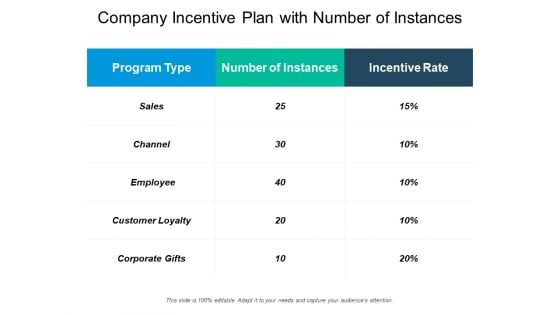
Company Incentive Plan With Number Of Instances Ppt PowerPoint Presentation Infographics Samples PDF
Presenting this set of slides with name company incentive plan with number of instances ppt powerpoint presentation infographics samples pdf. The topics discussed in these slides are program type, number instances, incentive rate, sales, channel, employee, customer loyalty, corporate gifts. This is a completely editable PowerPoint presentation and is available for immediate download. Download now and impress your audience.
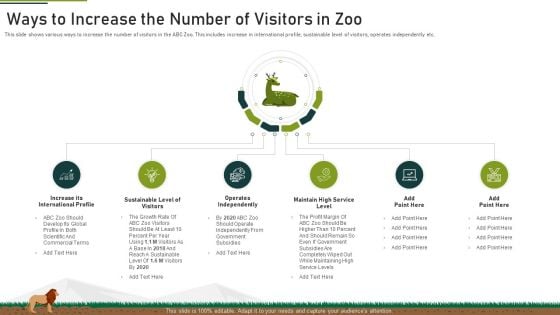
Ways To Increase The Number Of Visitors In Zoo Ppt Infographics Layouts PDF
This slide shows the various competitors of ABC Zoo which includes their logos, details, total revenue, total visitors base etc. Deliver an awe-inspiring pitch with this creative ways to increase the number of visitors in zoo ppt infographics layouts pdf. bundle. Topics like top competitors details with their logo and financials can be discussed with this completely editable template. It is available for immediate download depending on the needs and requirements of the user.
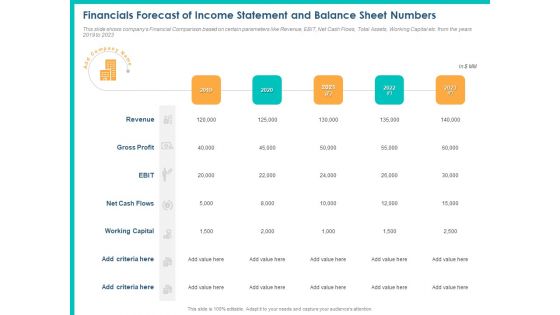
PPM Private Equity Financials Forecast Of Income Statement And Balance Sheet Numbers Ppt PowerPoint Presentation Infographic Template Example 2015 PDF
This slide shows companys Financial Comparison based on certain parameters like Revenue, EBIT, Net Cash Flows, Total Assets, Working Capital etc. from the years 2019 to 2023. Deliver an awe-inspiring pitch with this creative ppm private equity financials forecast of income statement and balance sheet numbers ppt powerpoint presentation infographic template example 2015 pdf bundle. Topics like revenue, gross profit, ebit, net cash flows, working capital, 2019 to 2023 can be discussed with this completely editable template. It is available for immediate download depending on the needs and requirements of the user.
Red Arrow With Numbers Vector Icon Ppt Powerpoint Presentation Layouts Infographic Template
Presenting this set of slides with name red arrow with numbers vector icon ppt powerpoint presentation layouts infographic template. The topics discussed in these slides are number icon, mathematical, number bar vector. This is a completely editable PowerPoint presentation and is available for immediate download. Download now and impress your audience.
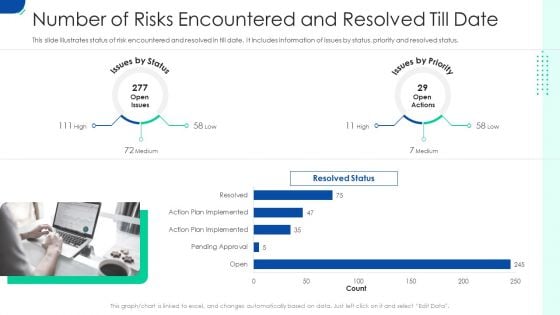
Initiating Hazard Managing Structure Firm Number Of Risks Encountered And Resolved Till Date Infographics PDF
This slide illustrates status of risk encountered and resolved in till date. It includes information of issues by status, priority and resolved status. Deliver and pitch your topic in the best possible manner with this initiating hazard managing structure firm number of risks encountered and resolved till date infographics pdf. Use them to share invaluable insights on number of risks encountered and resolved till date and impress your audience. This template can be altered and modified as per your expectations. So, grab it now.
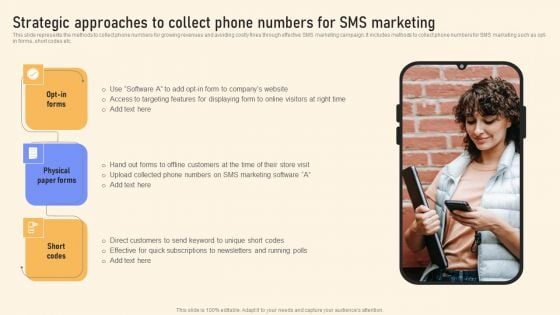
Strategic Approaches To Collect Phone Numbers For SMS Marketing Ppt PowerPoint Presentation File Infographic Template PDF
This slide represents the methods to collect phone numbers for growing revenues and avoiding costly fines through effective SMS marketing campaign. It includes methods to collect phone numbers for SMS marketing such as opt-in forms, short codes etc. Boost your pitch with our creative Strategic Approaches To Collect Phone Numbers For SMS Marketing Ppt PowerPoint Presentation File Infographic Template PDF. Deliver an awe inspiring pitch that will mesmerize everyone. Using these presentation templates you will surely catch everyones attention. You can browse the ppts collection on our website. We have researchers who are experts at creating the right content for the templates. So you do not have to invest time in any additional work. Just grab the template now and use them.

Investor Pitch Deck To Generate Capital From Initial Currency Offering Number Of Subscribers Historical And Forecasted Infographics PDF
The slide provides the table of End Subscribers historical and forecasted on the basis of various factors including churn rate, new addition of subscribers, cancelled subscription etc. Deliver and pitch your topic in the best possible manner with this investor pitch deck to generate capital from initial currency offering number of subscribers historical and forecasted infographics pdf. Use them to share invaluable insights on cancelled subscriptions, retention rate, end subscribers and impress your audience. This template can be altered and modified as per your expectations. So, grab it now.
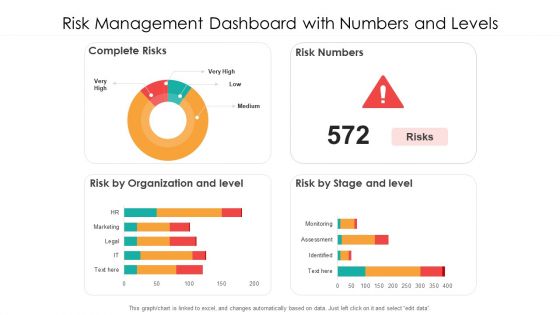
Risk Management Dashboard With Numbers And Levels Ppt PowerPoint Presentation Infographics Picture PDF
Pitch your topic with ease and precision using this risk management dashboard with numbers and levels ppt powerpoint presentation infographics picture pdf. This layout presents information on complete risks, risk numbers, risk by organization and level. It is also available for immediate download and adjustment. So, changes can be made in the color, design, graphics or any other component to create a unique layout.
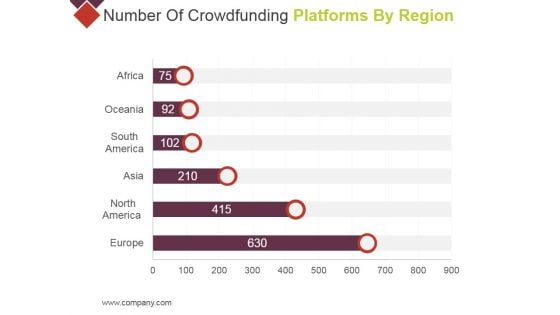
Number Of Crowdfunding Platforms By Region Ppt PowerPoint Presentation Infographics Pictures
This is a number of crowdfunding platforms by region ppt powerpoint presentation infographics pictures. This is a six stage process. The stages in this process are africa, oceania, south america, asia, north america.
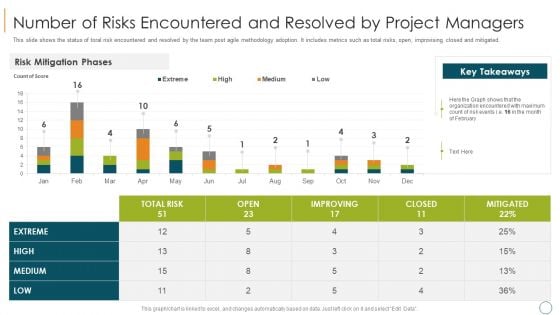
Professional Scrum Master Training IT Number Of Risks Encountered And Resolved By Project Managers Infographics PDF
This slide shows the status of toral risk encountered and resolved by the team post agile methodology adoption. It includes metrics such as total risks, open, improvising closed and mitigated. Deliver an awe inspiring pitch with this creative professional scrum master training it number of risks encountered and resolved by project managers infographics pdf bundle. Topics like number of risks encountered and resolved by project managers can be discussed with this completely editable template. It is available for immediate download depending on the needs and requirements of the user.
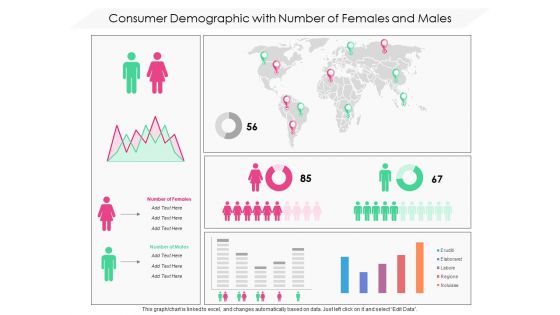
Consumer Demographic With Number Of Females And Males Ppt PowerPoint Presentation File Infographics PDF
Presenting this set of slides with name consumer demographic with number of females and males ppt powerpoint presentation file infographics pdf. The topics discussed in these slide is consumer demographic with number of females and males. This is a completely editable PowerPoint presentation and is available for immediate download. Download now and impress your audience.
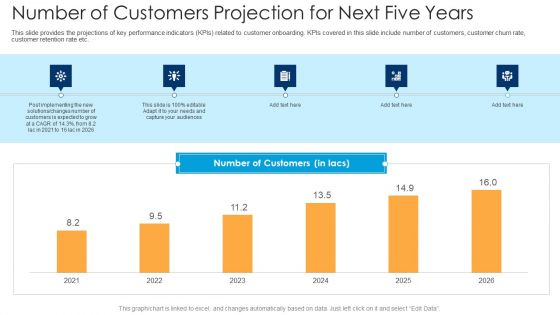
Number Of Customers Projection For Next Five Years Ppt Infographics Format PDF
This slide provides the projections of key performance indicators KPIs related to customer onboarding. KPIs covered in this slide include number of customers, customer churn rate, customer retention rate etc. Deliver and pitch your topic in the best possible manner with this number of customers projection for next five years ppt infographics format pdf. Use them to share invaluable insights on number of customers projection for next five years and impress your audience. This template can be altered and modified as per your expectations. So, grab it now.
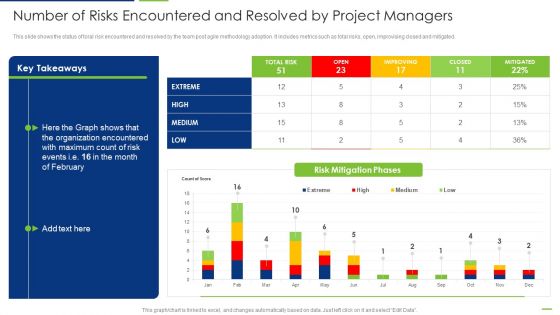
Professional Scrum Master Number Of Risks Encountered And Resolved By Project Managers Infographics PDF
This slide shows the status of toral risk encountered and resolved by the team post agile methodology adoption. It includes metrics such as total risks, open, improvising closed and mitigated. Deliver an awe inspiring pitch with this creative Professional Scrum Master Number Of Risks Encountered And Resolved By Project Managers Infographics PDF bundle. Topics like Risk Mitigation Phases, Organization Encountered, High, Low, Medium can be discussed with this completely editable template. It is available for immediate download depending on the needs and requirements of the user.

Numbers And Letters Blocks Lying On Floor Ppt PowerPoint Presentation Infographic Template Model
Presenting this set of slides with name numbers and letters blocks lying on floor ppt powerpoint presentation infographic template model. The topics discussed in these slides are block letter, colorful alphabets, literacy activities. This is a completely editable PowerPoint presentation and is available for immediate download. Download now and impress your audience.
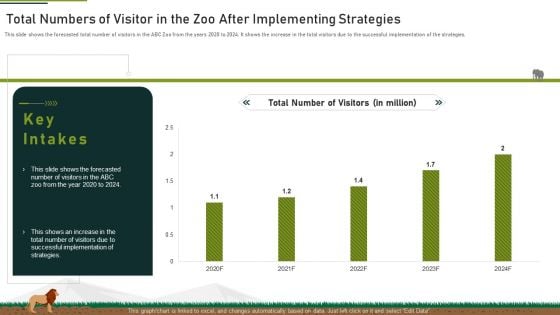
Total Numbers Of Visitor In The Zoo After Implementing Strategies Ppt Infographic Template Outfit PDF
This slide shows the forecasted total number of visitors in the ABC Zoo from the years 2020 to 2024. It shows the increase in the total visitors due to the successful implementation of the strategies.Deliver and pitch your topic in the best possible manner with this total numbers of visitor in the zoo after implementing strategies ppt infographic template outfit pdf. Use them to share invaluable insights on total numbers of visitor in the zoo after implementing strategies and impress your audience. This template can be altered and modified as per your expectations. So, grab it now.
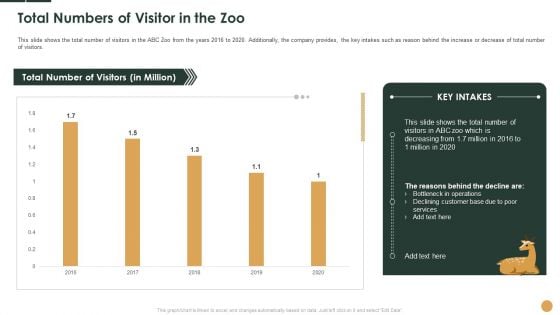
Total Numbers Of Visitor In The Zoo Ppt Infographics Show PDF
This slide shows the total number of visitors in the ABC Zoo from the years 2016 to 2020. Additionally, the company provides, the key intakes such as reason behind the increase or decrease of total number of visitors.Deliver and pitch your topic in the best possible manner with this total numbers of visitor in the zoo ppt infographics show pdf. Use them to share invaluable insights on total number of visitors, 2018 to 2020 and impress your audience. This template can be altered and modified as per your expectations. So, grab it now.
Six Numbers List And Text Boxes Ppt PowerPoint Presentation Infographics Graphic Tips
This is a six numbers list and text boxes ppt powerpoint presentation infographics graphic tips. This is a six stage process. The stages in this process are 6 text boxes, marketing, business.

Five Numbers List With Text Boxes Ppt PowerPoint Presentation Infographics Tips
This is a five numbers list with text boxes ppt powerpoint presentation infographics tips. This is a five stage process. The stages in this process are 12 bullet points, 12 points, 12 points checklist.
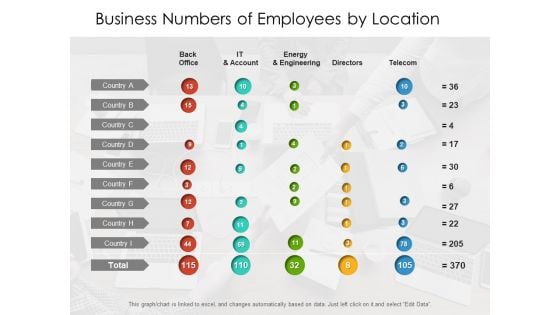
Business Numbers Of Employees By Location Ppt PowerPoint Presentation Infographics Master Slide PDF
Presenting this set of slides with name business numbers of employees by location ppt powerpoint presentation infographics master slide pdf. The topics discussed in these slides are back office, it and account, energy and engineering, directors, telecom. This is a completely editable PowerPoint presentation and is available for immediate download. Download now and impress your audience

COVID 19 Pandemic Disease Graph Showing Number Of Days Coronavirus Can Last On Multiple Surface Infographics PDF
Presenting this set of slides with name covid 19 pandemic disease graph showing number of days coronavirus can last on multiple surface infographics pdf. The topics discussed in these slides are copper, cardboard, plastic, stainless steel. This is a completely editable PowerPoint presentation and is available for immediate download. Download now and impress your audience.
Number Banners For Website Layout PowerPoint Templates
This PowerPoint template has been designed with numbered list of options. This Infographics template useful for text display. Accelerate the impact of your ideas using this template.
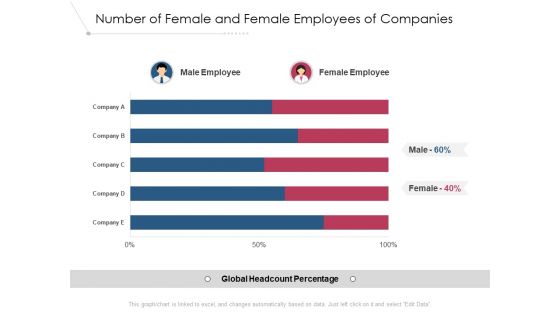
Number Of Female And Female Employees Of Companies Ppt PowerPoint Presentation Layouts Infographic Template PDF
Presenting this set of slides with name number of female and female employees of companies ppt powerpoint presentation layouts infographic template pdf. The topics discussed in these slides are male employee, female employee, global headcount percentage. This is a completely editable PowerPoint presentation and is available for immediate download. Download now and impress your audience
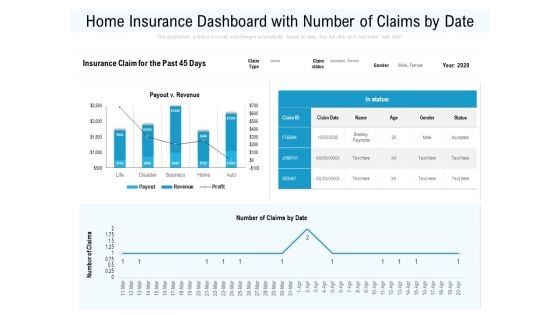
Home Insurance Dashboard With Number Of Claims By Date Ppt PowerPoint Presentation Professional Samples PDF
Showcasing this set of slides titled home insurance dashboard with number of claims by date ppt powerpoint presentation infographics aids pdf. The topics addressed in these templates are business, disaster, profit, revenue, payout. All the content presented in this PPT design is completely editable. Download it and make adjustments in color, background, font etc. as per your unique business setting.
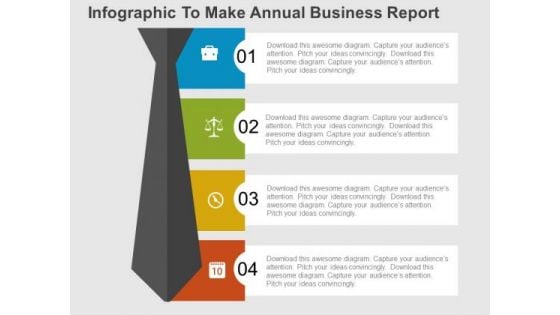
Infographic To Make Annual Business Report PowerPoint Templates
This PowerPoint template has been designed with numbered list of options. This infographic template to make annual business report. Accelerate the impact of your ideas using this template.
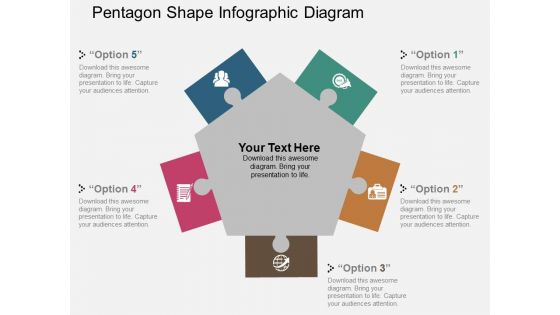
Pentagon Shape Infographic Diagram Powerpoint Template
Our above business diagram has been designed with number banners and record and file icons. This slide is suitable to present steps of book keeping. Use this business diagram to present your work in a more smart and precise manner.
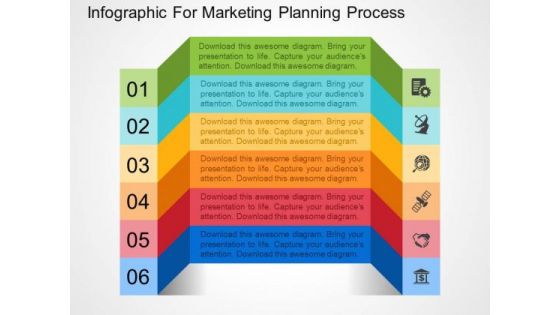
Infographic For Marketing Planning Process PowerPoint Templates
Our above business slide has been designed with numbered list of steps and icons. This slide is suitable to present marketing planning process. Use this business diagram to present your work in a more smart and precise manner.

Four Numeric Banners Infographic PowerPoint Template
This PowerPoint slide is perfect for the description of various steps. This template can be used to give details about various departments of the organization. Four steps can easily be represented with the help of this diagram. This PPT design also help you to show process description with the help of banners. This slide being customized can assist you to change colors, icons and numbers to make it look impressive.
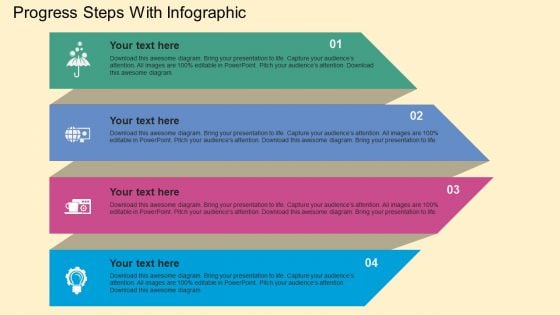
Progress Steps With Infographic Powerpoint Templates
This colorful PowerPoint template can be used for various purposes irrespective of whether it?s a professional or casual presentation. The slide has a very modern and attractive design. The 4 shapes can be used for index and numbering purposes. Because of their nature of size, they can hold good amount of text within them. The slide can be used for denoting various steps of a process. They can also be used to describe a ?moving forward? strategy of a business or an organization. With the perfect placement of icons next to the text, this slide can surely be understood without any assistance of any kind. This slide has been created keeping professional colors and designs in mind but they are 100% customizable and can be modified as per needs and requirements.
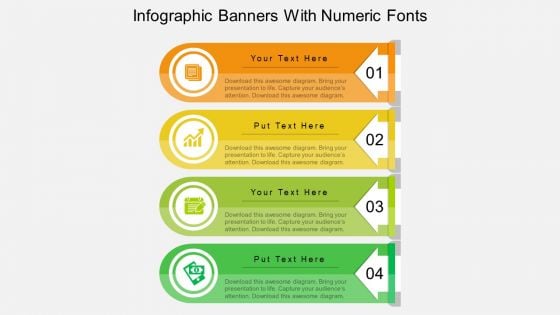
Infographic Banners With Numeric Fonts PowerPoint Template
This colorful slide is the perfect combination of formal and casual presentation. The slide has been creatively designed to give it a formal and organized look but the colors don?t make it look very boring or monotonous. You can use this slide for various purposes. This can effectively explain the role of various departments in an organization. It can also be used to share the product range of a company or the available variant line of a product. Their arrows, numbering, colors of banner or tags and icons are editable and can be used appropriately to suit the presentation as per the requirement.
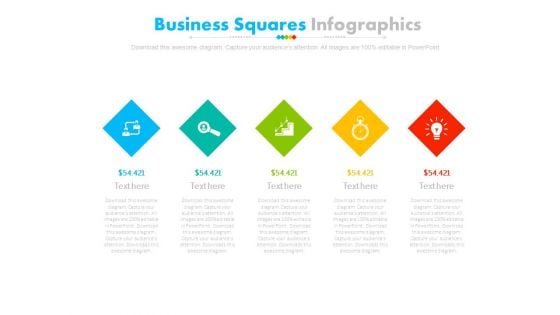
Five Steps Diamond Infographic Diagram Powerpoint Slides
This PowerPoint template has been designed with alphabet steps with icons. This PPT slide may be used to display financial strategy analysis. Make outstanding business presentation with this template.
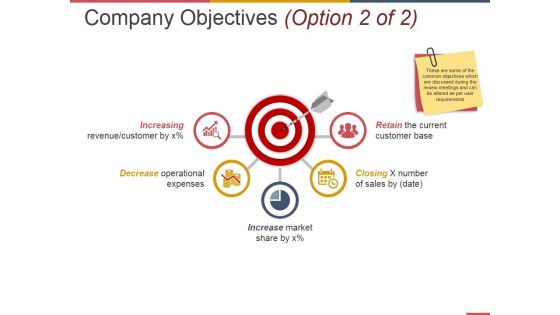
Company Objectives Template 2 Ppt PowerPoint Presentation Infographic Template Show
This is a company objectives template 2 ppt powerpoint presentation infographic template show. This is a five stage process. The stages in this process are current customer base, number of sales by, market share, operational expenses.
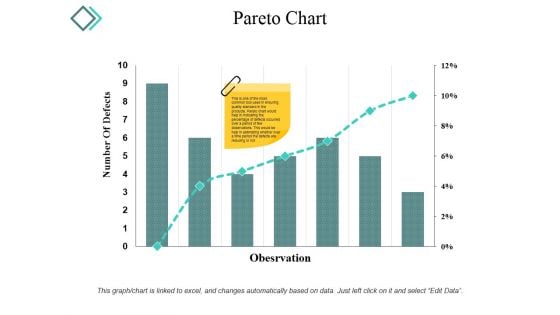
Pareto Chart Ppt PowerPoint Presentation Infographic Template Microsoft
This is a pareto chart ppt powerpoint presentation infographic template microsoft. This is a seven stage process. The stages in this process are number of defects, observation, graph, percentage, business.
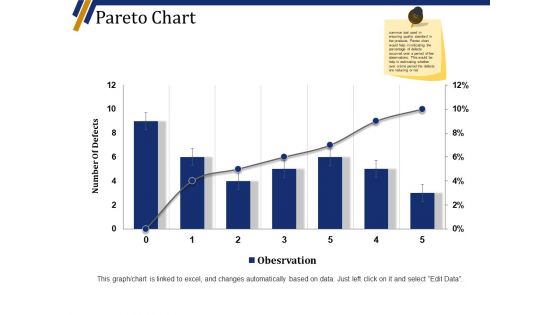
Pareto Chart Ppt PowerPoint Presentation File Infographic Template
This is a pareto chart ppt powerpoint presentation file infographic template. This is a six stage process. The stages in this process are number of defects, business, marketing, graph.
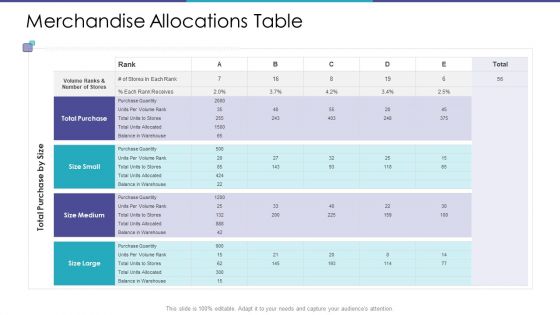
Merchandise Allocations Table Ppt Infographic Template Samples PDF
Deliver and pitch your topic in the best possible manner with this merchandise allocations table ppt infographic template samples pdf. Use them to share invaluable insights on total purchase, volume ranks and number of stores, purchase quantity and impress your audience. This template can be altered and modified as per your expectations. So, grab it now.
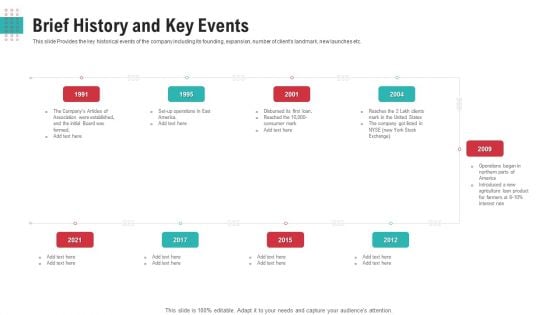
Brief History And Key Events Ppt Infographic Template Information PDF
This slide Provides the key historical events of the company including its founding, expansion, number of clients landmark, new launches etc.Presenting brief history and key events ppt infographic template information pdf. to provide visual cues and insights. Share and navigate important information on nine stages that need your due attention. This template can be used to pitch topics like 1991 to 2021. In addtion, this PPT design contains high resolution images, graphics, etc, that are easily editable and available for immediate download.
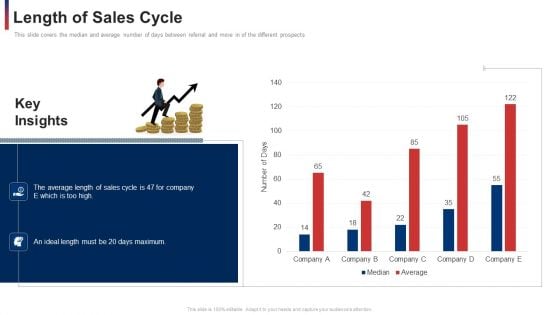
Length Of Sales Cycle Maximum Ppt Infographic Template Introduction PDF
This slide covers the median and average number of days between referral and move in of the different prospects. Deliver an awe-inspiring pitch with this creative length of sales cycle maximum ppt infographic template introduction pdf. bundle. Topics like length of sales cycle can be discussed with this completely editable template. It is available for immediate download depending on the needs and requirements of the user.
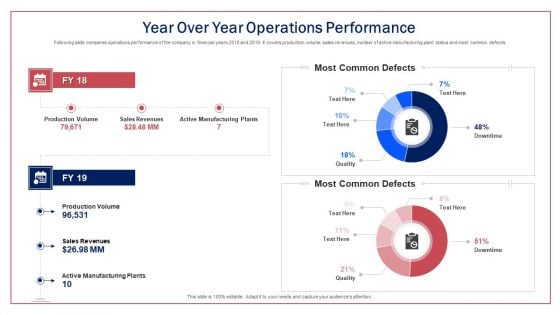
Year Over Year Operations Performance Ppt Infographic Template Shapes PDF
Following slide compares operations performance of the company in financial years 2018 and 2019. It covers production volume, sales revenues, number of active manufacturing plant status and most common defects.Deliver and pitch your topic in the best possible manner with this year over year operations performance ppt infographic template shapes pdf. Use them to share invaluable insights on most common defects, most common defects, active manufacturing plants, production volume and impress your audience. This template can be altered and modified as per your expectations. So, grab it now.
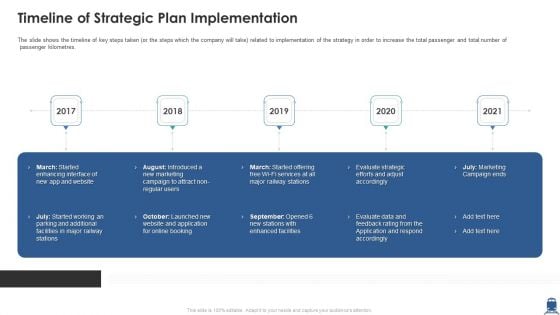
Timeline Of Strategic Plan Implementation Ppt Infographic Template Format PDF
The slide shows the timeline of key steps taken or the steps which the company will take related to implementation of the strategy in order to increase the total passenger and total number of passenger kilometres. This is a timeline of strategic plan implementation ppt infographic template format pdf template with various stages. Focus and dispense information on five stages using this creative set, that comes with editable features. It contains large content boxes to add your information on topics like timeline of strategic plan implementation. You can also showcase facts, figures, and other relevant content using this PPT layout. Grab it now.
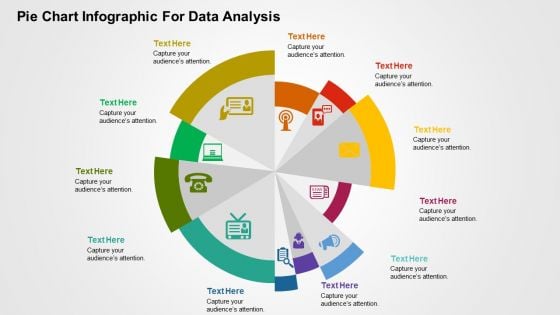
Pie Chart Infographic For Data Analysis PowerPoint Templates
This is one of the most downloaded PowerPoint template. This slide can be used for various purposes and to explain a number of processes. This can be included in your presentation to explain each step of a process and even include its relevance and importance in a single diagram. Using the uneven circular structure of the pie chart, the presenter can also explain random steps or highlight particular steps of process or parts of an organization or business that need special attention of any kind to the audience. Additionally, you can use this slide to show a transformation process or highlight key features of a product.
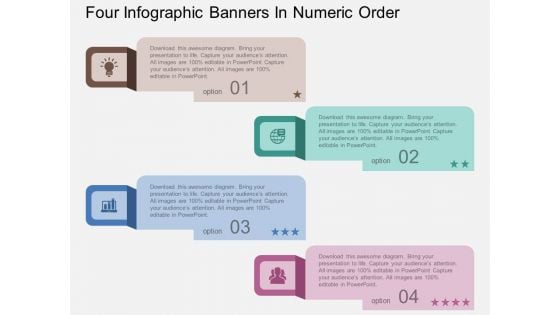
Four Infographic Banners In Numeric Order Powerpoint Template
Deliver amazing presentations with our above template showing graphics of numbered tags. You may download this PPT slide to display process steps in numeric order. Capture the attention of your audience using this PPT diagram slide.


 Continue with Email

 Home
Home


