Occurrence Management
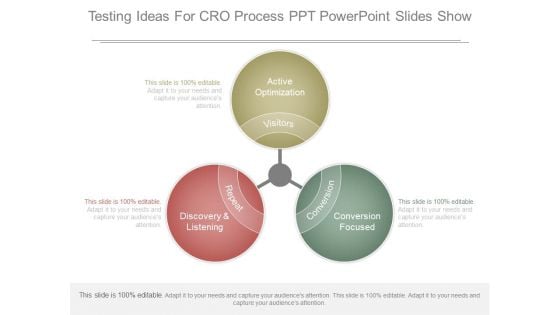
Testing Ideas For Cro Process Ppt Powerpoint Slides Show
This is a testing ideas for cro process ppt powerpoint slides show. This is a three stage process. The stages in this process are visitors, repeat, conversion, active optimization, conversion focused, discovery and listening.
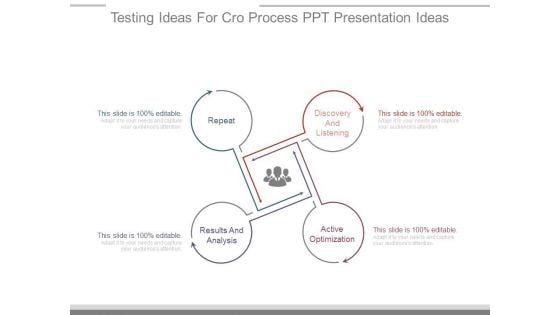
Testing Ideas For Cro Process Ppt Presentation Ideas
This is a testing ideas for cro process ppt presentation ideas. This is a four stage process. The stages in this process are discovery and listening, active optimization, results and analysis, repeat.
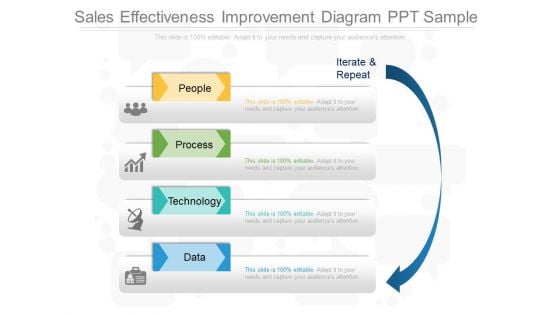
Sales Effectiveness Improvement Diagram Ppt Sample
This is a sales effectiveness improvement diagram ppt sample. This is a four stage process. The stages in this process are people, process, technology, data, iterate and repeat.
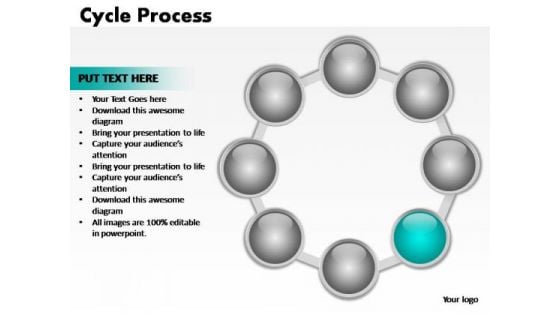
PowerPoint Themes Teamwork Cycle Process Ppt Design
PowerPoint Themes Teamwork Cycle Process PPT Design-Cycle Diagrams are a type of graphics that shows how items are related to one another in a repeating cycle. In a cycle diagram, you can explain the main events in the cycle, how they interact, and how the cycle repeats. These Diagrams can be used to interact visually and logically with audiences. -PowerPoint Themes Teamwork Cycle Process PPT Design Command your way to success with our PowerPoint Themes Teamwork Cycle Process Ppt Design. You will come out on top.
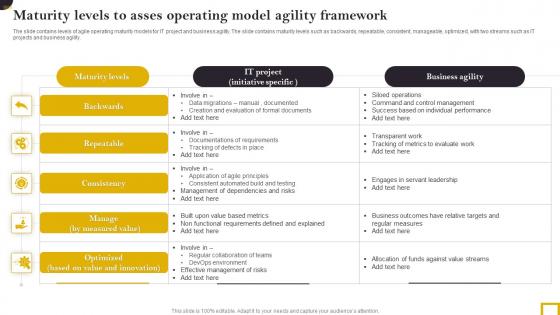
Maturity Levels To Asses Operating Model Agility Framework Mockup Pdf
The slide contains levels of agile operating maturity models for IT project and business agility. The slide contains maturity levels such as backwards, repeatable, consistent, manageable, optimized, with two streams such as IT projects and business agility. Showcasing this set of slides titled Maturity Levels To Asses Operating Model Agility Framework Mockup Pdf. The topics addressed in these templates are Repeatable, Consistent, Manageable, Optimized. All the content presented in this PPT design is completely editable. Download it and make adjustments in color, background, font etc. as per your unique business setting. The slide contains levels of agile operating maturity models for IT project and business agility. The slide contains maturity levels such as backwards, repeatable, consistent, manageable, optimized, with two streams such as IT projects and business agility.
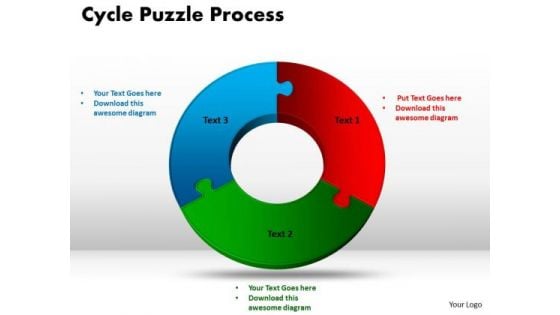
PowerPoint Slides Cycle Puzzle Process Strategy Ppt Slide Designs
PowerPoint Slides Cycle Puzzle Process Strategy PPT Slide Designs-Cycle Diagrams are a type of graphics that shows how items are related to one another in a repeating cycle. In a cycle diagram, you can explain the main events in the cycle, how they interact, and how the cycle repeats-PowerPoint Slides Cycle Puzzle Process Strategy PPT Slide Designs Our PowerPoint Slides Cycle Puzzle Process Strategy Ppt Slide Designs team exert themselves. They put in all the effort for you.
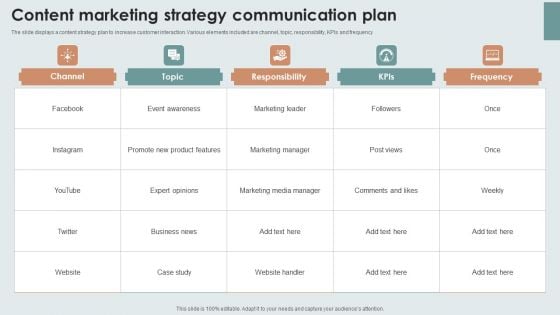
Content Marketing Strategy Communication Plan Themes PDF
The slide displays a content strategy plan to increase customer interaction. Various elements included are channel, topic, responsibility, KPIs and frequency. Pitch your topic with ease and precision using this Content Marketing Strategy Communication Plan Themes PDF. This layout presents information on Event Awareness, Marketing Manager, Marketing Media Manager. It is also available for immediate download and adjustment. So, changes can be made in the color, design, graphics or any other component to create a unique layout.
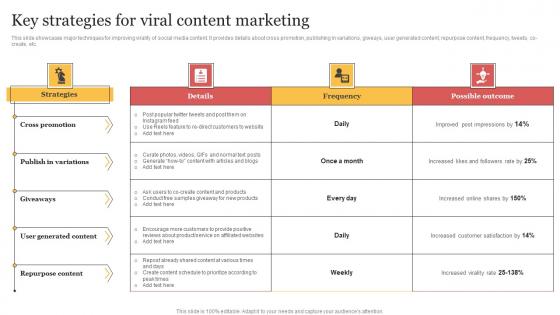
Key Strategies For Viral Content Marketing Organizing Buzzworthy Social Topics Pdf
This slide showcases major techniques for improving virality of social media content. It provides details about cross promotion, publishing in variations, giweays, user generated content, repurpose content, frequency, tweets, co-create, etc. Are you in need of a template that can accommodate all of your creative concepts This one is crafted professionally and can be altered to fit any style. Use it with Google Slides or PowerPoint. Include striking photographs, symbols, depictions, and other visuals. Fill, move around, or remove text boxes as desired. Test out color palettes and font mixtures. Edit and save your work, or work with colleagues. Download Key Strategies For Viral Content Marketing Organizing Buzzworthy Social Topics Pdf and observe how to make your presentation outstanding. Give an impeccable presentation to your group and make your presentation unforgettable. This slide showcases major techniques for improving virality of social media content. It provides details about cross promotion, publishing in variations, giweays, user generated content, repurpose content, frequency, tweets, co-create, etc.

First Call Resolution Diagram Ppt Example
This is a first call resolution diagram ppt example. This is a three stage process. The stages in this process are satisfied customers, no repeat calls, cost savings.
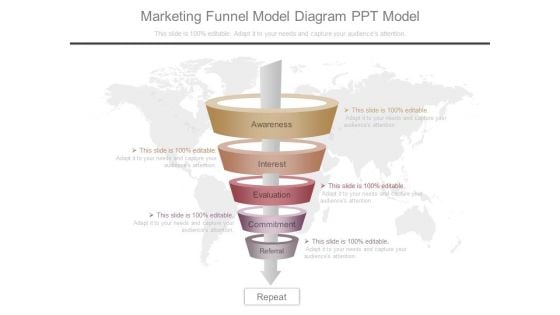
Marketing Funnel Model Diagram Ppt Model
This is a marketing funnel model diagram ppt model. This is a five stage process. The stages in this process are awareness, interest, evaluation, commitment, referral, repeat.\n\n\n\n\n\n\n\n
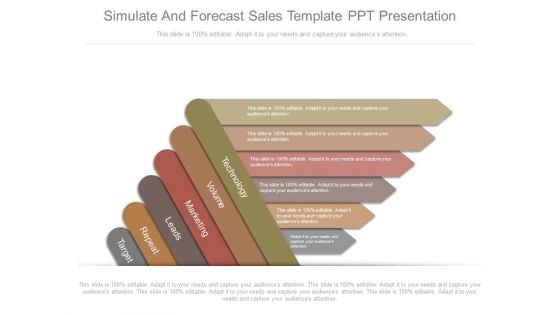
Simulate And Forecast Sales Template Ppt Presentation
This is a simulate and forecast sales template ppt presentation. This is a six stage process. The stages in this process are technology, volume, marketing, leads, repeat, target.

Calculation Model Analysis Diagram Ppt Sample Download
This is a calculation model analysis diagram ppt sample download. This is a five stage process. The stages in this process are precision, accuracy, bias, repeatability, linearity.
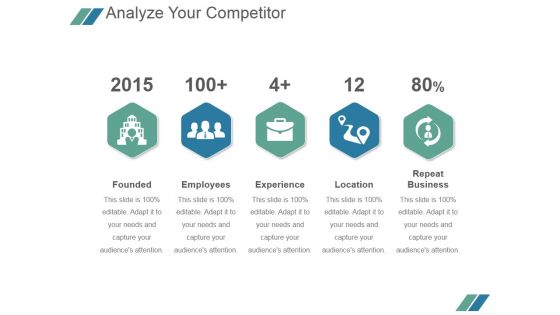
Analyze Your Competitor Ppt PowerPoint Presentation Deck
This is a analyze your competitor ppt powerpoint presentation deck. This is a five stage process. The stages in this process are founded, employees, experience, location, repeat business.
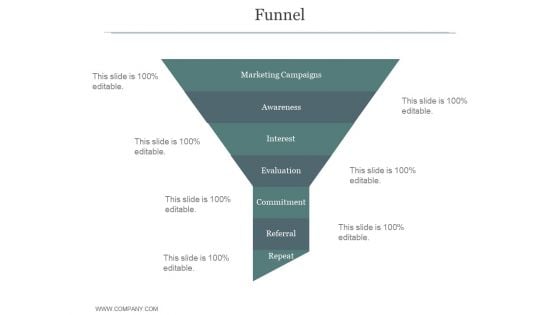
Funnel Ppt PowerPoint Presentation Tips
This is a funnel ppt powerpoint presentation tips. This is a seven stage process. The stages in this process are marketing campaigns, awareness, interest, evaluation, commitment, referral, repeat.
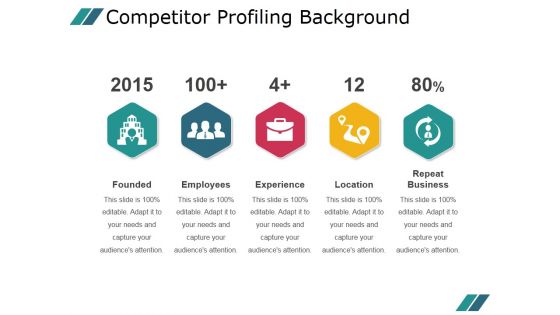
Competitor Profiling Background Ppt PowerPoint Presentation Deck
This is a competitor profiling background ppt powerpoint presentation deck. This is a five stage process. The stages in this process are founded, employees, experience, location, repeat business.
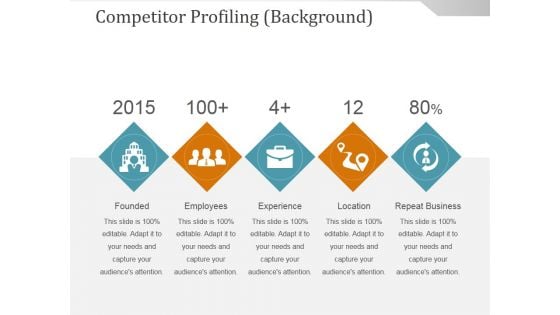
Competitor Profiling Background Ppt PowerPoint Presentation Professional
This is a competitor profiling background ppt powerpoint presentation professional. This is a five stage process. The stages in this process are founded, employees, experience, location, repeat business.
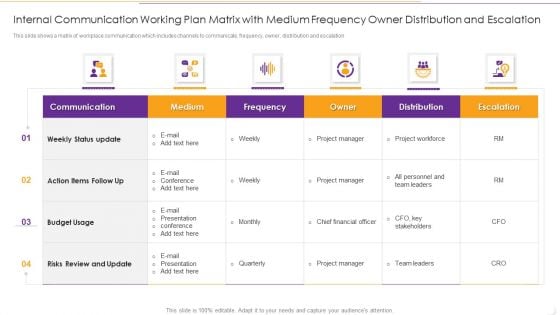
Internal Communication Working Plan Matrix With Medium Frequency Owner Distribution And Escalation Pictures PDF
Pitch your topic with ease and precision using this Internal Communication Working Plan Matrix With Medium Frequency Owner Distribution And Escalation Pictures PDF This layout presents information on Communication, Risks Review And Update, Presentation Conference It is also available for immediate download and adjustment. So, changes can be made in the color, design, graphics or any other component to create a unique layout.
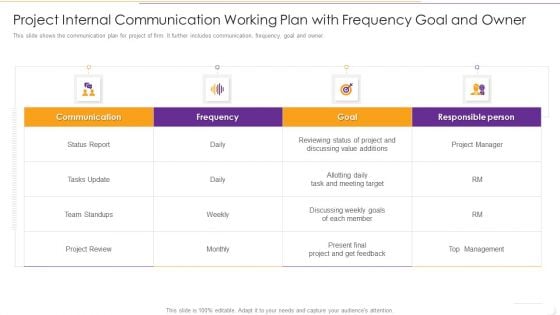
Project Internal Communication Working Plan With Frequency Goal And Owner Infographics PDF
Showcasing this set of slides titled Project Internal Communication Working Plan With Frequency Goal And Owner Infographics PDF The topics addressed in these templates are Communication, Discussing Value Additions, Responsible Person All the content presented in this PPT design is completely editable. Download it and make adjustments in color, background, font etc. as per your unique business setting.
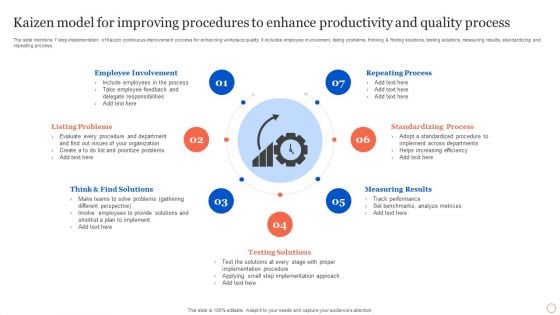
Kaizen Model For Improving Procedures To Enhance Productivity And Quality Process Rules PDF
The slide mentions 7 step implementation of kaizen continuous improvement process for enhancing workplace quality. it includes employee involvement, listing problems, thinking and finding solutions, testing solutions, measuring results, standardizing and repeating process. Persuade your audience using this Kaizen Model For Improving Procedures To Enhance Productivity And Quality Process Rules PDF. This PPT design covers seven stages, thus making it a great tool to use. It also caters to a variety of topics including Employee Involvement, Listing Problems, Repeating Process, Standardizing Process. Download this PPT design now to present a convincing pitch that not only emphasizes the topic but also showcases your presentation skills.
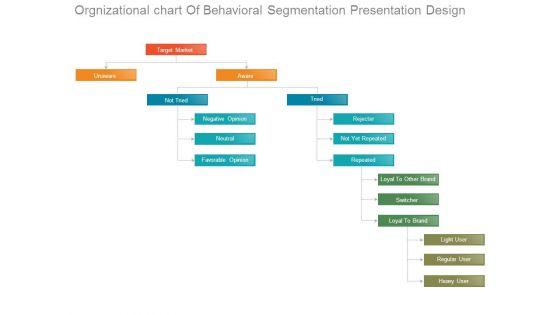
Orgnizational Chart Of Behavioral Segmentation Presentation Design
This is a orgnizational chart of behavioral segmentation presentation design. This is a four stage process. The stages in this process are unaware, target market, aware, not tried, negative opinion, favorable opinion, tried, rejecter, not yet repeated, repeated, loyal to other brand, switcher, loyal to brand, light user, regular user, heavy user.
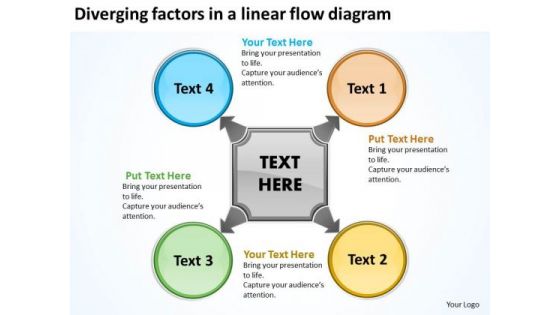
Diverging Factors Linear Flow Diagram Cycle Chart PowerPoint Slides
We present our diverging factors linear flow diagram Cycle Chart PowerPoint Slides.Download our Circle Charts PowerPoint Templates because you have the ideas to develop the teams vision of where they need to be in the future. Download and present our Arrows PowerPoint Templates because you have the basic goal in mind. Present our Business PowerPoint Templates because you have analysed many global markets and come up with possibilities. Highlight the pros and cons of other likely business oppurtunities. Present our Shapes PowerPoint Templates because you can Unravel the desired and essential elements of your overall strategy. Present our Flow Charts PowerPoint Templates because there is a crucial aspect that requires extra attention.Use these PowerPoint slides for presentations relating to action, around, arrow, business, button, cartoon, catalyzing, center, chart, circle, circuits, clipart, comic, commerce, concept, conceptual, continue, corporate, cycle, diagram, guide, guidelines, illustration, line, manage, management, map, marketing, mentoring, messenger, mind, mind mapping, mindmap, organization, performance, plans, procedure, process, project, public, repeat, representation, sketch, steps, topic, vector, web, weblogs, website. The prominent colors used in the PowerPoint template are Yellow, Green, Blue. Customers tell us our diverging factors linear flow diagram Cycle Chart PowerPoint Slides are Amazing. PowerPoint presentation experts tell us our business PowerPoint templates and PPT Slides are Lush. People tell us our diverging factors linear flow diagram Cycle Chart PowerPoint Slides will make the presenter successul in his career/life. People tell us our catalyzing PowerPoint templates and PPT Slides are Magical. Customers tell us our diverging factors linear flow diagram Cycle Chart PowerPoint Slides are Striking. People tell us our chart PowerPoint templates and PPT Slides are Clever. Your factory produces desirable commodities. Our Diverging Factors Linear Flow Diagram Cycle Chart PowerPoint Slides are designed to advertise.
Evaluation Metrics For Tracking Business Frauds Graphics Pdf
This slide showcases the assessment metrics for tracking business frauds which helps them to indicate risk impact levels as a factor of potential impacts on operations. It include details such as likelihood, elevated, mitigate, monitor, etc. Pitch your topic with ease and precision using this Evaluation Metrics For Tracking Business Frauds Graphics Pdf This layout presents information on Senior Management, Observed Frequency, Occur Occasionally It is also available for immediate download and adjustment. So, changes can be made in the color, design, graphics or any other component to create a unique layout. This slide showcases the assessment metrics for tracking business frauds which helps them to indicate risk impact levels as a factor of potential impacts on operations. It include details such as likelihood, elevated, mitigate, monitor, etc.
Circular Arrows Around Globe For Continuous Process Icon Ppt PowerPoint Presentation Infographics Infographic Template
This is a circular arrows around globe for continuous process icon ppt powerpoint presentation infographics infographic template. This is a three stage process. The stages in this process are continuous icon, repeating icon, unbroken icon.
Continuous Business Process Circular Arrows Vector Icon Ppt PowerPoint Presentation Infographic Template Background Images
This is a continuous business process circular arrows vector icon ppt powerpoint presentation infographic template background images. This is a four stage process. The stages in this process are continuous icon, repeating icon, unbroken icon.
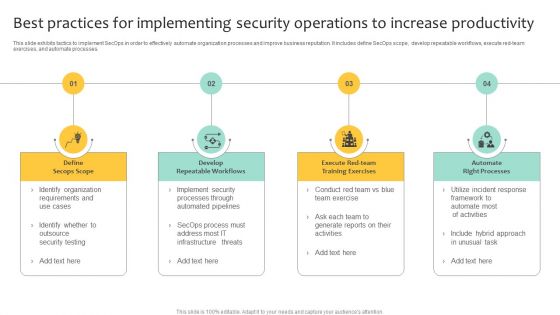
Best Practices For Implementing Security Operations To Increase Productivity Clipart PDF
This slide exhibits tactics to implement SecOps in order to effectively automate organization processes and improve business reputation. It includes define SecOps scope, develop repeatable workflows, execute red-team exercises, and automate processes. Presenting Best Practices For Implementing Security Operations To Increase Productivity Clipart PDF to dispense important information. This template comprises four stages. It also presents valuable insights into the topics including Develop Repeatable Workflows, Automate Right Processes, Define Secops Scope. This is a completely customizable PowerPoint theme that can be put to use immediately. So, download it and address the topic impactfully.
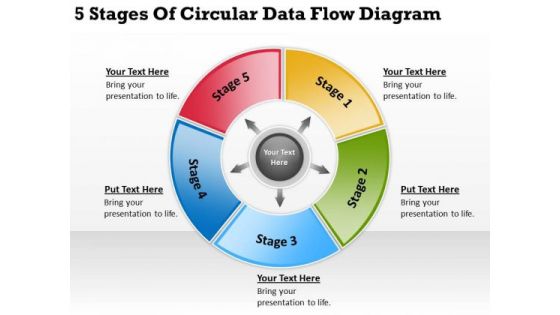
5 Stages Of Circular Data Flow Diagram Simple Business Plan PowerPoint Slides
We present our 5 stages of circular data flow diagram simple business plan PowerPoint Slides.Present our Marketing PowerPoint Templates because Our PowerPoint Templates and Slides will steer your racing mind. Hit the right buttons and spur on your audience. Use our Leadership PowerPoint Templates because Our PowerPoint Templates and Slides come in all colours, shades and hues. They help highlight every nuance of your views. Use our Arrows PowerPoint Templates because Our PowerPoint Templates and Slides come in all colours, shades and hues. They help highlight every nuance of your views. Present our Business PowerPoint Templates because Our PowerPoint Templates and Slides will let you Hit the target. Go the full distance with ease and elan. Download and present our Circle Charts PowerPoint Templates because You should Bet on your luck with our PowerPoint Templates and Slides. Be assured that you will hit the jackpot.Use these PowerPoint slides for presentations relating to Flow, process, arrow, chart, adding, business, vector, symbol, flowchart, graph, network, conservation, sign, rotation, recycling, value, graphic, element, repeat, management, wheel, cycle, circulation, connection, strategy, orientation, planning, direction, design, group, return, repetition, communication. The prominent colors used in the PowerPoint template are Red, Green, Yellow. Awards will be the feathers in your cap. Accumulate accolades with our 5 Stages Of Circular Data Flow Diagram Simple Business Plan PowerPoint Slides.
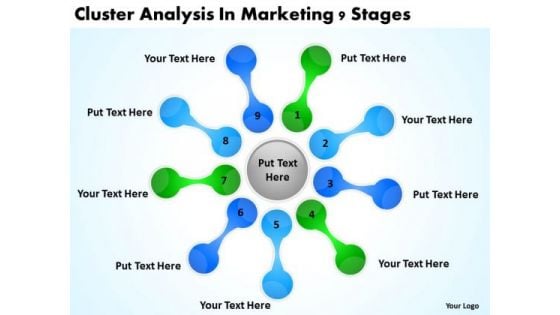
Cluster Analysis In Marketing 9 Stages Business Plan PowerPoint Slides
We present our cluster analysis in marketing 9 stages business plan PowerPoint Slides.Use our Marketing PowerPoint Templates because Your audience will believe you are the cats whiskers. Use our Leadership PowerPoint Templates because Our PowerPoint Templates and Slides offer you the needful to organise your thoughts. Use them to list out your views in a logical sequence. Use our Arrows PowerPoint Templates because Our PowerPoint Templates and Slides will provide you the cutting edge. Slice through the doubts in the minds of your listeners. Download our Business PowerPoint Templates because Our PowerPoint Templates and Slides have the Brilliant backdrops. Guaranteed to illuminate the minds of your audience. Use our Circle Charts PowerPoint Templates because Our PowerPoint Templates and Slides are aesthetically designed to attract attention. We gaurantee that they will grab all the eyeballs you need.Use these PowerPoint slides for presentations relating to Flow, process, arrow, chart, adding, business, vector, symbol, flowchart, graph, network, conservation, sign, rotation, recycling, value, graphic, element, repeat, management, wheel, cycle, circulation, connection, strategy, orientation, planning, direction, design, group, return, repetition, communication. The prominent colors used in the PowerPoint template are Purple, Green, Yellow. Our Cluster Analysis In Marketing 9 Stages Business Plan PowerPoint Slides are exemplary contributors. They go all out to achieve the common goal.
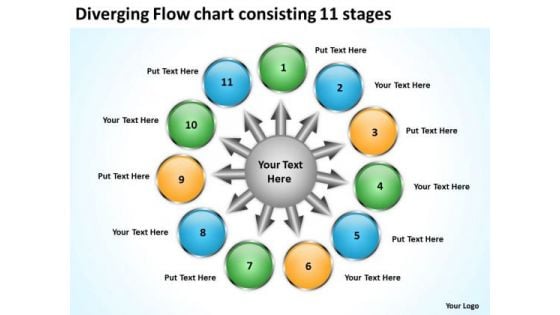
Flow Chart Consisting 11 Stages Ppt Relative Circular Arrow Diagram PowerPoint Templates
We present our flow chart consisting 11 stages ppt Relative Circular Arrow Diagram PowerPoint templates.Present our Circle Charts PowerPoint Templates because you can Help your viewers automatically emphathise with your thoughts. Present our Arrows PowerPoint Templates because that was the well known Musketeers call. Use our Business PowerPoint Templates because the great Bald headed Eagle embodies your personality. the eagle eye to seize upon the smallest of opportunities. Download our Shapes PowerPoint Templates because you know your business and have a vision for it. Use our Flow Charts PowerPoint Templates because using this Ideas will roll along in your mind like billiard balls.Use these PowerPoint slides for presentations relating to action, around, arrow, business, button, cartoon, catalyzing, center, chart, circle, circuits, clipart, comic, commerce, concept, conceptual, continue, corporate, cycle, diagram, guide, guidelines, illustration, line, manage, management, map, marketing, mentoring, messenger, mind, mind mapping, mindmap, organization, performance, plans, procedure, process, project, public, repeat, representation, sketch, steps, topic, vector, web, weblogs, website. The prominent colors used in the PowerPoint template are Green, Blue, Yellow. Customers tell us our flow chart consisting 11 stages ppt Relative Circular Arrow Diagram PowerPoint templates are Attractive. PowerPoint presentation experts tell us our button PowerPoint templates and PPT Slides will save the presenter time. People tell us our flow chart consisting 11 stages ppt Relative Circular Arrow Diagram PowerPoint templates are Multicolored. People tell us our button PowerPoint templates and PPT Slides are Striking. Customers tell us our flow chart consisting 11 stages ppt Relative Circular Arrow Diagram PowerPoint templates are Pretty. People tell us our button PowerPoint templates and PPT Slides will generate and maintain the level of interest you desire. They will create the impression you want to imprint on your audience. Our Flow Chart Consisting 11 Stages Ppt Relative Circular Arrow Diagram PowerPoint Templates are ever evolving. They absorb new concepts with complete ease.
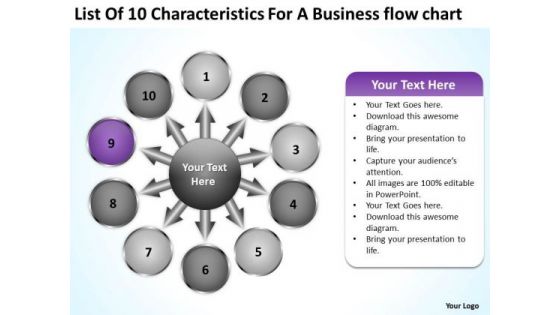
For A Business PowerPoint Templates Download Flow Chart Ppt Cycle Arrow Diagram Slides
We present our for a business powerpoint templates download flow chart ppt Cycle Arrow Diagram Slides.Download our Circle charts PowerPoint Templates because watching them will strengthen your companys sinews. Use our Arrows PowerPoint Templates because you have a great training programme in mind to upgrade the skills of your staff. Download our Flow charts PowerPoint Templates because you can Set out the goals and your plan of action for teamwork. Download our Business PowerPoint Templates because you have selected your team man for man. Download our Shapes PowerPoint Templates because you can Place them where they need to be.Use these PowerPoint slides for presentations relating to action, around, arrow, business, button, cartoon, catalyzing, center, chart, circle circuits, clipart, comic, commerce, concept, conceptual, continue, corporate, cycle diagram, guide, guidelines, illustration, line, manage, management, map, marketing mentoring, messenger, mind, mind, mapping, mind map, organization, performance plans, procedure, process, project, public, repeat, representation, sketch, steps, topic vector, web, weblogs, website. The prominent colors used in the PowerPoint template are Purple, Gray, Black. You can be sure our for a business powerpoint templates download flow chart ppt Cycle Arrow Diagram Slides will make the presenter successul in his career/life. The feedback we get is that our cartoon PowerPoint templates and PPT Slides are topically designed to provide an attractive backdrop to any subject. Customers tell us our for a business powerpoint templates download flow chart ppt Cycle Arrow Diagram Slides look good visually. You can be sure our cartoon PowerPoint templates and PPT Slides are Luxurious. The feedback we get is that our for a business powerpoint templates download flow chart ppt Cycle Arrow Diagram Slides will impress their bosses and teams. You can be sure our button PowerPoint templates and PPT Slides are Nostalgic. Calculate your growing success with our For A Business PowerPoint Templates Download Flow Chart Ppt Cycle Arrow Diagram Slides. You will come out on top.
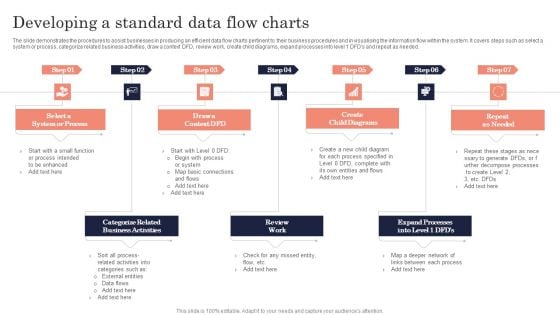
Developing A Standard Data Flow Charts Ppt PowerPoint Presentation File Clipart PDF
The slide demonstrates the procedures to assist businesses in producing an efficient data flow chartspertinent to their business procedures and in visualising the information flow within the system. it covers steps such as select a system or process, categorize related business activities, draw a context dfd, review work, create child diagrams, expand processes into level 1 dfds and repeat as needed. Persuade your audience using this Developing A Standard Data Flow Charts Ppt PowerPoint Presentation File Clipart PDF. This PPT design covers seven stages, thus making it a great tool to use. It also caters to a variety of topics including Create Child Diagrams, Repeat As Needed, Review Work. Download this PPT design now to present a convincing pitch that not only emphasizes the topic but also showcases your presentation skills.
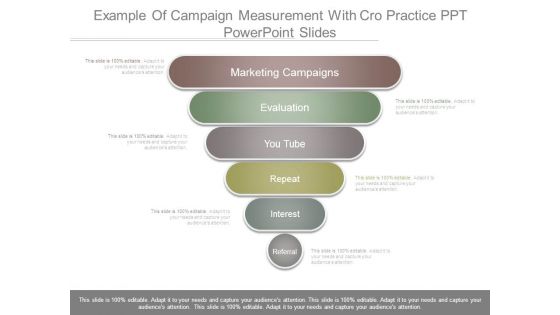
Example Of Campaign Measurement With Cro Practice Ppt Powerpoint Slides
This is a example of campaign measurement with cro practice ppt powerpoint slides. This is a six stage process. The stages in this process are marketing campaigns, evaluation, you tube, repeat, interest, referral.
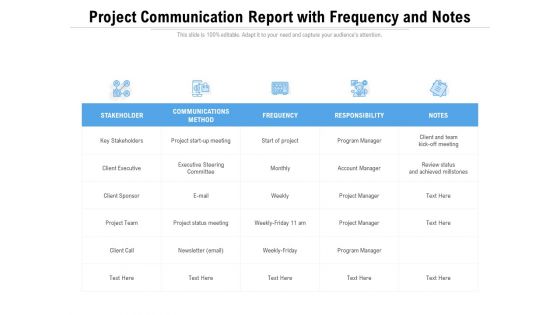
Project Communication Report With Frequency And Notes Ppt PowerPoint Presentation Outline Design Templates PDF
Pitch your topic with ease and precision using this project communication report with frequency and notes ppt powerpoint presentation outline design templates pdf. This layout presents information on key stakeholders, client executive, client sponsor, project team, client call. It is also available for immediate download and adjustment. So, changes can be made in the color, design, graphics or any other component to create a unique layout.
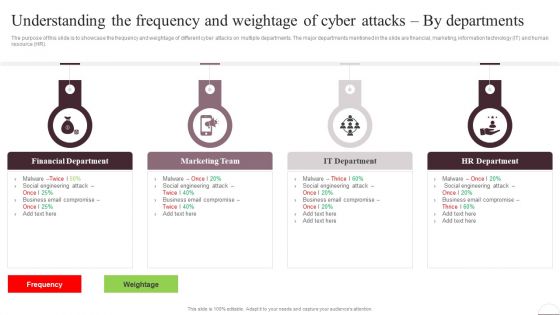
Prevention Of Information Understanding The Frequency And Weightage Of Cyber Attacks Professional PDF
The purpose of this slide is to showcase the frequency and weightage of different cyber attacks on multiple departments. The major departments mentioned in the slide are financial, marketing, information technology IT and human resource HR. Present like a pro with Prevention Of Information Understanding The Frequency And Weightage Of Cyber Attacks Professional PDF Create beautiful presentations together with your team, using our easy-to-use presentation slides. Share your ideas in real-time and make changes on the fly by downloading our templates. So whether youre in the office, on the go, or in a remote location, you can stay in sync with your team and present your ideas with confidence. With Slidegeeks presentation got a whole lot easier. Grab these presentations today.
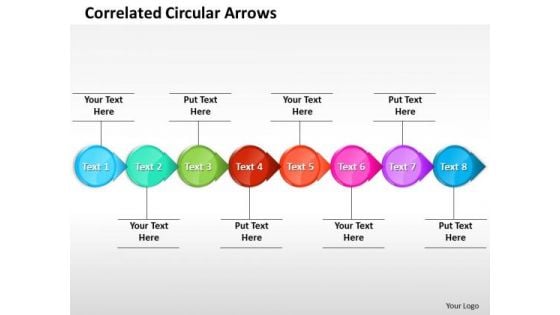
Ppt Correlated Circular Arrows PowerPoint Templates Horizontal Line 8 Stages
PPT correlated circular arrows powerpoint templates horizontal line 8 stages-This PowerPoint Diagram shows you Correlated Circular Arrows in Horizontal Line which signifies step by step Execution, inter-related approaches etc.-PPT correlated circular arrows powerpoint templates horizontal line 8 stages-8 Steps, 8 Steps Diagram, Arrow, Artfulness, Chart, Circle, Circular, Circulation, Concept, Connection, Continuity, Correlate, Course, Diagram, Direction, Duplicate, Flow, Four, Iterate, Manage, Method, Order, Phase, Presentation, Procedure, Process, React, Recycle, Refresh, Relate, Repeat, Repetition, Report, Review, Section, Sequence, Simple, Stage, Step, Strategy, Success, Swirl, System, Work Flow Ideas come alive with our Ppt Correlated Circular Arrows PowerPoint Templates Horizontal Line 8 Stages. Your thoughts will get animated.
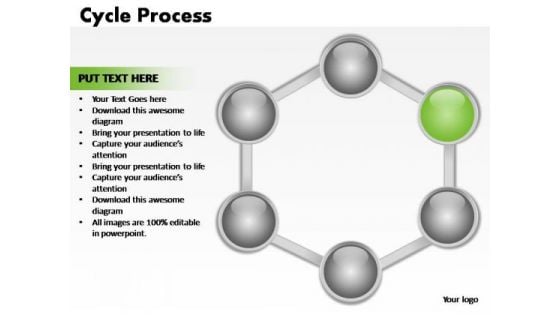
PowerPoint Design Graphic Cycle Process Ppt Slide
PowerPoint Design Graphic Cycle Process PPT Slide-Cycle Diagrams are a type of graphics that shows how items are related to one another in a repeating cycle. In a cycle diagram, you can explain the main events in the cycle, how they interact, and how the cycle repeats. These Diagrams can be used to interact visually and logically with audiences.-PowerPoint Design Graphic Cycle Process PPT Slide Serve presentations with our PowerPoint Design Graphic Cycle Process Ppt Slide. Download without worries with our money back guaranteee.
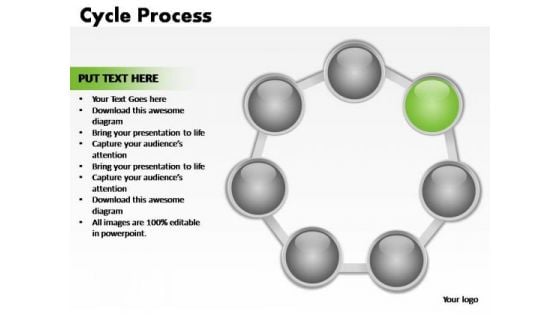
PowerPoint Design Image Cycle Process Ppt Template
PowerPoint Design Image Cycle Process PPT Template-Cycle Diagrams are a type of graphics that shows how items are related to one another in a repeating cycle. In a cycle diagram, you can explain the main events in the cycle, how they interact, and how the cycle repeats. These Diagrams can be used to interact visually and logically with audiences.-PowerPoint Design Image Cycle Process PPT Template With our PowerPoint Design Image Cycle Process Ppt Template there are no mixed feelings. The aim will be loud and clear to all.
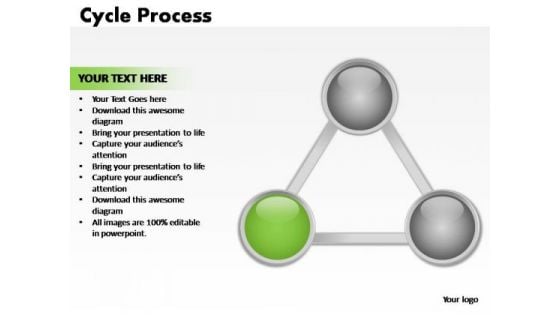
PowerPoint Designs Company Cycle Process Ppt Templates
PowerPoint Designs Company Cycle Process PPT Templates-Cycle Diagrams are a type of graphics that shows how items are related to one another in a repeating cycle. In a cycle diagram, you can explain the main events in the cycle, how they interact, and how the cycle repeats. These Diagrams can be used to interact visually and logically with audiences. -PowerPoint Designs Company Cycle Process PPT Templates Your address will be the feature. Our PowerPoint Designs Company Cycle Process Ppt Templates will ensure the cheers.
PowerPoint Designs Editable Cycle Process Ppt Backgrounds
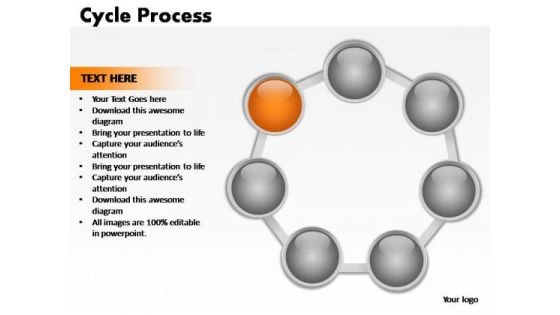
PowerPoint Designs Editable Cycle Process PPT Backgrounds-Cycle Diagrams are a type of graphics that shows how items are related to one another in a repeating cycle. In a cycle diagram, you can explain the main events in the cycle, how they interact, and how the cycle repeats. These Diagrams can be used to interact visually and logically with audiences. -PowerPoint Designs Editable Cycle Process PPT Backgrounds You are known to be erudite. Share your learning with our PowerPoint Designs Editable Cycle Process Ppt Backgrounds.
PowerPoint Designs Marketing Cycle Process Ppt Templates
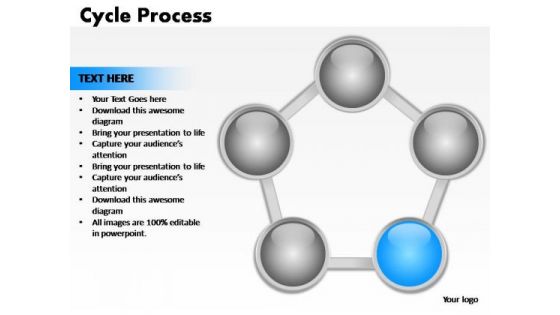
PowerPoint Designs Marketing Cycle Process PPT Templates-Cycle Diagrams are a type of graphics that shows how items are related to one another in a repeating cycle. In a cycle diagram, you can explain the main events in the cycle, how they interact, and how the cycle repeats. These Diagrams can be used to interact visually and logically with audiences. -PowerPoint Designs Marketing Cycle Process PPT Templates Our designs are proven winners. Be a winner too with our PowerPoint Designs Marketing Cycle Process Ppt Templates. You'll always stay ahead of the game.
PowerPoint Slides Company Cycle Process Ppt Slide
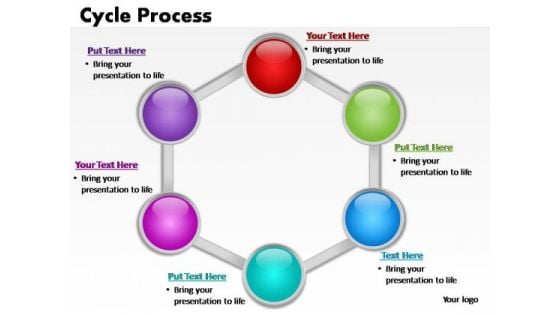
PowerPoint Slides Company Cycle Process PPT Slide-Cycle Diagrams are a type of graphics that shows how items are related to one another in a repeating cycle. In a cycle diagram, you can explain the main events in the cycle, how they interact, and how the cycle repeats. These Diagrams can be used to interact visually and logically with audiences. -PowerPoint Slides Company Cycle Process PPT Slide Avoid any clutter in your thoughts. Concentrate on absolute essentials with our PowerPoint Slides Company Cycle Process Ppt Slide.
PowerPoint Slides Cycle Process Chart Ppt Template
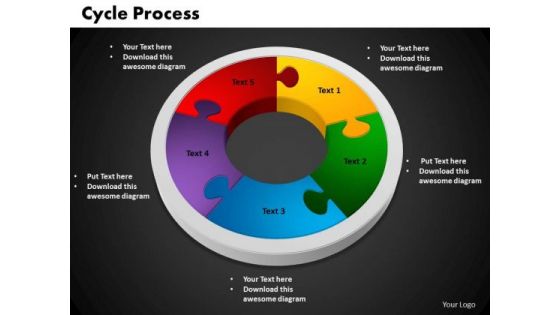
PowerPoint Slides Cycle Process Chart PPT Template-Cycle Diagrams are a type of graphics that shows how items are related to one another in a repeating cycle. In a cycle diagram, you can explain the main events in the cycle, how they interact, and how the cycle repeats.-PowerPoint Slides Cycle Process Chart PPT Template-Cycle, Design, Diagram, Element, Graph, Business, Chart, Circular, Connect, Connection, Puzzle, Round, Solving, Step, Together, Putting, Mystery, Linking, Infographic, Icon, Be a peak performer with our PowerPoint Slides Cycle Process Chart Ppt Template. They will make you look good.
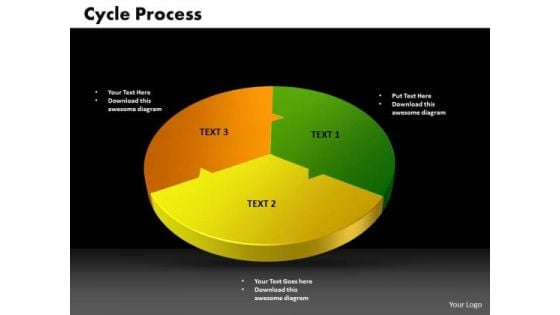
PowerPoint Slides Cycle Process Success Ppt Backgrounds
PowerPoint Slides Cycle Process Success PPT Backgrounds-Cycle Diagrams are a type of graphics that shows how items are related to one another in a repeating cycle. In a cycle diagram, you can explain the main events in the cycle, how they interact, and how the cycle repeats.-PowerPoint Slides Cycle Process Success PPT Backgrounds-Cycle, Design, Diagram, Element, Graph, Business, Chart, Circular, Connect, Connection, Puzzle, Round, Solving, Step, Together, Putting, Mystery, Linking, Infographic, Icon, Exhibit your charisma with our PowerPoint Slides Cycle Process Success Ppt Backgrounds. They will add to your ample charm.
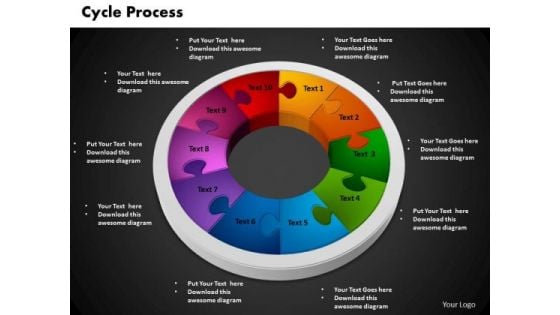
PowerPoint Slides Cycle Process Success Ppt Designs
PowerPoint Slides Cycle Process Success PPT Designs-Cycle Diagrams are a type of graphics that shows how items are related to one another in a repeating cycle. In a cycle diagram, you can explain the main events in the cycle, how they interact, and how the cycle repeats.-PowerPoint Slides Cycle Process Success PPT Designs-Cycle, Design, Diagram, Element, Graph, Business, Chart, Circular, Connect, Connection, Puzzle, Round, Solving, Step, Together, Putting, Mystery, Linking, Infographic, Icon, Our PowerPoint Slides Cycle Process Success Ppt Designs make a delicious offering. The audience will be drooling for more.
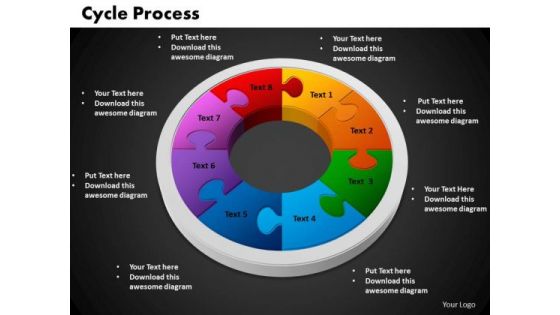
PowerPoint Template Cycle Process Business Ppt Designs
PowerPoint Template Cycle Process Business PPT Designs-Cycle Diagrams are a type of graphics that shows how items are related to one another in a repeating cycle. In a cycle diagram, you can explain the main events in the cycle, how they interact, and how the cycle repeats.-PowerPoint Template Cycle Process Business PPT Designs-Cycle, Design, Diagram, Element, Graph, Business, Chart, Circular, Connect, Connection, Puzzle, Round, Solving, Step, Together, Putting, Mystery, Linking, Infographic, Icon, Court the audience with our PowerPoint Template Cycle Process Business Ppt Designs. They will certainly be bowled over by you.
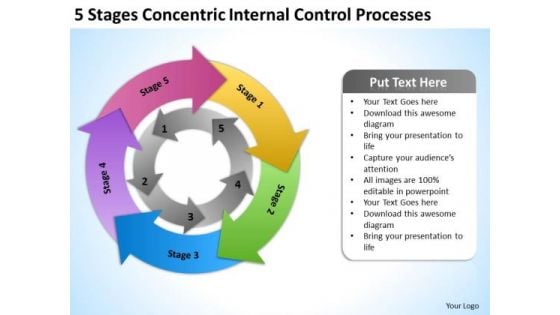
Concentric Internal Control Processes Real Estate Agent Business Plan PowerPoint Slides
We present our concentric internal control processes real estate agent business plan PowerPoint Slides.Use our Arrows PowerPoint Templates because Our PowerPoint Templates and Slides will generate and maintain the level of interest you desire. They will create the impression you want to imprint on your audience. Present our Circle Charts PowerPoint Templates because Our PowerPoint Templates and Slides will embellish your thoughts. See them provide the desired motivation to your team. Use our Shapes PowerPoint Templates because Our PowerPoint Templates and Slides will let you Hit the right notes. Watch your audience start singing to your tune. Present our Business PowerPoint Templates because It is Aesthetically crafted by artistic young minds. Our PowerPoint Templates and Slides are designed to display your dexterity. Download our Process and Flows PowerPoint Templates because Our PowerPoint Templates and Slides will provide weight to your words. They will bring out the depth of your thought process.Use these PowerPoint slides for presentations relating to arrow, circular, process, round, flow, business, vector, graphic, part, green, red, concept, yellow, presentation, symbol, circle, orange, repeat, cycle, illustration, icon, pink, six, purple, blue, repetitive. The prominent colors used in the PowerPoint template are Pink, Yellow, Green. Fastidious conditions egg us on. Our Concentric Internal Control Processes Real Estate Agent Business Plan PowerPoint Slides team exult in challenges.
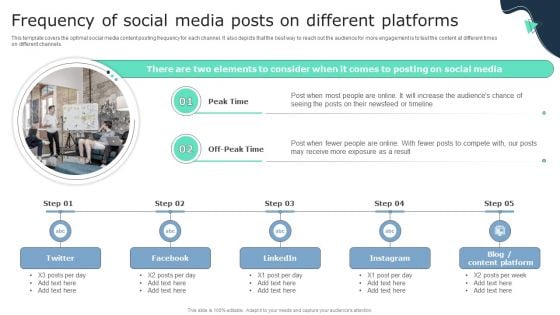
Frequency Of Social Media Posts On Different Platforms Business Social Strategy Guide Inspiration PDF
This template covers the optimal social media content posting frequency for each channel. It also depicts that the best way to reach out the audience for more engagement is to test the content at different times on different channels.Make sure to capture your audiences attention in your business displays with our gratis customizable Frequency Of Social Media Posts On Different Platforms Business Social Strategy Guide Inspiration PDF. These are great for business strategies, office conferences, capital raising or task suggestions. If you desire to acquire more customers for your tech business and ensure they stay satisfied, create your own sales presentation with these plain slides.
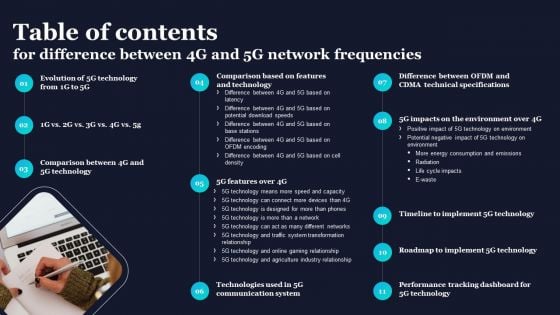
Table Of Contents For Difference Between 4G And 5G Network Frequencies Introduction PDF
Present like a pro with Table Of Contents For Difference Between 4G And 5G Network Frequencies Introduction PDF Create beautiful presentations together with your team, using our easy-to-use presentation slides. Share your ideas in real-time and make changes on the fly by downloading our templates. So whether you are in the office, on the go, or in a remote location, you can stay in sync with your team and present your ideas with confidence. With Slidegeeks presentation got a whole lot easier. Grab these presentations today.

3 Frequency Bands At The Core Of 5G Networks 5G Functional Architecture Template PDF
This slide talks about the three frequency bands at the core of 5G networks, and it includes 5G mmWave, 5G mid band sub 6 GHz, and 4G low band or 5G DSS. The 5G mmWave can be extended from 24GHz to over Presenting 3 Frequency Bands At The Core Of 5G Networks 5G Functional Architecture Template PDF to provide visual cues and insights. Share and navigate important information on three stages that need your due attention. This template can be used to pitch topics like high frequencies, past obstructions, runs frequencies. In addtion, this PPT design contains high resolution images, graphics, etc, that are easily editable and available for immediate download.
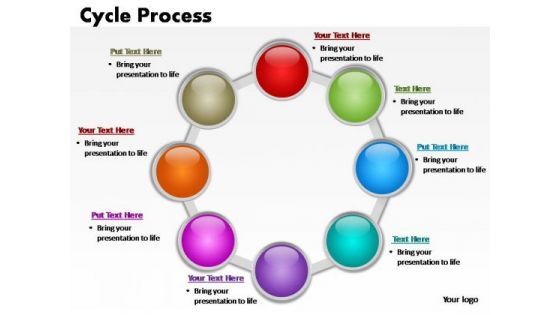
PowerPoint Backgrounds Chart Cycle Process Ppt Themes
PowerPoint Backgrounds Chart Cycle Process PPT Themes-Cycle Diagrams are a type of graphics that shows how items are related to one another in a repeating cycle. In a cycle diagram, you can explain the main events in the cycle, how they interact, and how the cycle repeats. These Diagrams can be used to interact visually and logically with audiences.-PowerPoint Backgrounds Chart Cycle Process PPT Themes People often criticise without any cause. With our PowerPoint Backgrounds Chart Cycle Process Ppt Themes you won't give a fig.
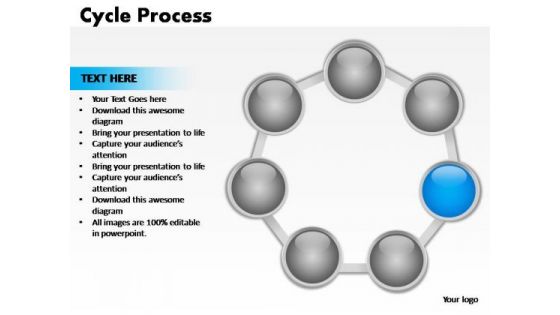
PowerPoint Backgrounds Leadership Cycle Process Ppt Theme
PowerPoint Backgrounds Leadership Cycle Process PPT Theme-Cycle Diagrams are a type of graphics that shows how items are related to one another in a repeating cycle. In a cycle diagram, you can explain the main events in the cycle, how they interact, and how the cycle repeats. These Diagrams can be used to interact visually and logically with audiences.-PowerPoint Backgrounds Leadership Cycle Process PPT Theme Use our PowerPoint Backgrounds Leadership Cycle Process Ppt Theme and be carefree. They will bear the brunt for you.
PowerPoint Designs Company Cycle Chart Ppt Process
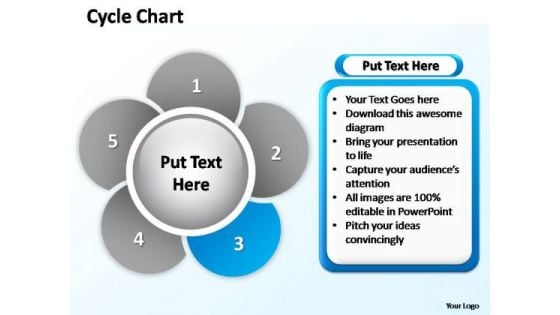
PowerPoint Designs Company Cycle Chart PPT Process-Cycle Diagrams are a type of graphics that shows how items are related to one another in a repeating cycle. In a cycle diagram, you can explain the main events in the cycle, how they interact, and how the cycle repeats. These Diagrams can be used to interact visually and logically with audiences. -PowerPoint Designs Company Cycle Chart PPT Process Achieve strategic & tactical operations with our PowerPoint Designs Company Cycle Chart Ppt Process. They will make you look good.
PowerPoint Slides Company Cycle Process Ppt Design
PowerPoint Slides Company Cycle Process PPT Design-Cycle Diagrams are a type of graphics that shows how items are related to one another in a repeating cycle. In a cycle diagram, you can explain the main events in the cycle, how they interact, and how the cycle repeats. These Diagrams can be used to interact visually and logically with audiences. -PowerPoint Slides Company Cycle Process PPT Design Re-discover your presentation skills with our PowerPoint Slides Company Cycle Process Ppt Design. You'll deliver your best presentation yet.
PowerPoint Slides Sales Cycle Process Ppt Designs
PowerPoint Slides Sales Cycle Process PPT Designs-Cycle Diagrams are a type of graphics that shows how items are related to one another in a repeating cycle. In a cycle diagram, you can explain the main events in the cycle, how they interact, and how the cycle repeats. These Diagrams can be used to interact visually and logically with audiences. -PowerPoint Slides Sales Cycle Process PPT Designs Put your ideas out to flower. Our PowerPoint Slides Sales Cycle Process Ppt Designs will get them to bloom.
PowerPoint Template Chart Cycle Process Ppt Theme
PowerPoint Template Chart Cycle Process PPT Theme-Cycle Diagrams are a type of graphics that shows how items are related to one another in a repeating cycle. In a cycle diagram, you can explain the main events in the cycle, how they interact, and how the cycle repeats. These Diagrams can be used to interact visually and logically with audiences. -PowerPoint Template Chart Cycle Process PPT Theme Guard against boring presentations with our PowerPoint Template Chart Cycle Process Ppt Theme. Try us out and see what a difference our templates make.
PowerPoint Template Company Cycle Process Ppt Slides
PowerPoint Template Company Cycle Process PPT Slides-Cycle Diagrams are a type of graphics that shows how items are related to one another in a repeating cycle. In a cycle diagram, you can explain the main events in the cycle, how they interact, and how the cycle repeats. These Diagrams can be used to interact visually and logically with audiences. -PowerPoint Template Company Cycle Process PPT Slides Prepare appropriately with our PowerPoint Template Company Cycle Process Ppt Slides. Download without worries with our money back guaranteee.
PowerPoint Template Diagram Cycle Process Ppt Presentation
PowerPoint Template Diagram Cycle Process PPT Presentation-Cycle Diagrams are a type of graphics that shows how items are related to one another in a repeating cycle. In a cycle diagram, you can explain the main events in the cycle, how they interact, and how the cycle repeats. These Diagrams can be used to interact visually and logically with audiences. -PowerPoint Template Diagram Cycle Process PPT Presentation Give them more than they expect of you. Add to the bounty with our PowerPoint Template Diagram Cycle Process Ppt Presentation.
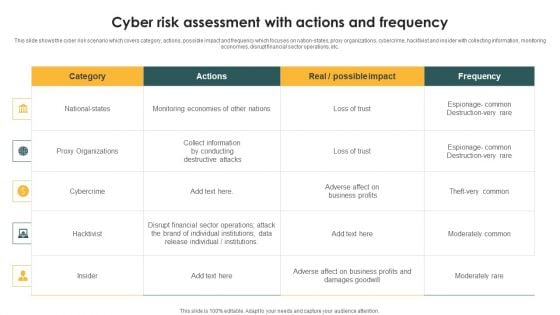
Cyber Risk Assessment With Actions And Frequency Ppt PowerPoint Presentation File Gridlines PDF
This slide shows the cyber risk scenario which covers category, actions, possible impact and frequency which focuses on nation-states, proxy organizations, cybercrime, hacktivist and insider with collecting information, monitoring economies, disrupt financial sector operations, etc. Pitch your topic with ease and precision using this Cyber Risk Assessment With Actions And Frequency Ppt PowerPoint Presentation File Gridlines PDF. This layout presents information on National states, Proxy Organizations, Cybercrime. It is also available for immediate download and adjustment. So, changes can be made in the color, design, graphics or any other component to create a unique layout.
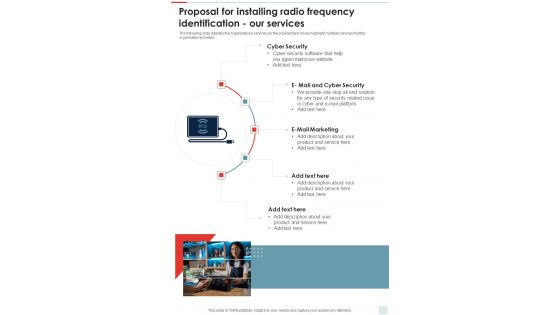
Proposal For Installing Radio Frequency Identification Our Services One Pager Sample Example Document
The following slide displays the organizations services as the provided text boxes highlight multiple services that the organization provides. Presenting you an exemplary Proposal For Installing Radio Frequency Identification Our Services One Pager Sample Example Document. Our one-pager comprises all the must-have essentials of an inclusive document. You can edit it with ease, as its layout is completely editable. With such freedom, you can tweak its design and other elements to your requirements. Download this Proposal For Installing Radio Frequency Identification Our Services One Pager Sample Example Document brilliant piece now.
Data Handling Types With Frequency Distribution Ppt PowerPoint Presentation Icon Diagrams PDF
Presenting data handling types with frequency distribution ppt powerpoint presentation icon diagrams pdf to dispense important information. This template comprises seven stages. It also presents valuable insights into the topics including frequency distribution, line graph, pictograph. This is a completely customizable PowerPoint theme that can be put to use immediately. So, download it and address the topic impactfully.
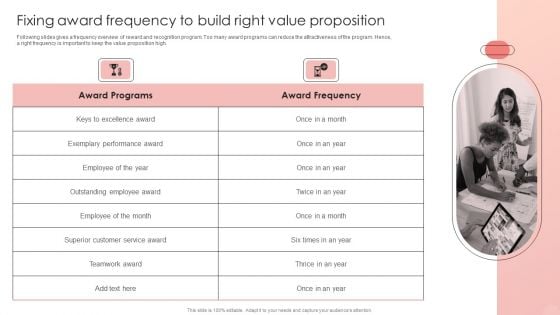
Improving HRM Process Fixing Award Frequency To Build Right Value Proposition Information PDF
Following slides gives a frequency overview of reward and recognition program. Too many award programs can reduce the attractiveness of the program. Hence, a right frequency is important to keep the value proposition high. Retrieve professionally designed Improving HRM Process Fixing Award Frequency To Build Right Value Proposition Information PDF to effectively convey your message and captivate your listeners. Save time by selecting pre-made slideshows that are appropriate for various topics, from business to educational purposes. These themes come in many different styles, from creative to corporate, and all of them are easily adjustable and can be edited quickly. Access them as PowerPoint templates or as Google Slides themes. You dont have to go on a hunt for the perfect presentation because Slidegeeks got you covered from everywhere.


 Continue with Email

 Home
Home


