Office Organizational Chart
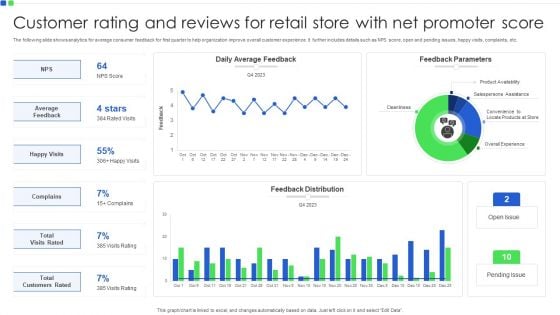
Customer Rating And Reviews For Retail Store With Net Promoter Score Demonstration PDF
The following slide shows analytics for average consumer feedback for first quarter to help organization improve overall customer experience. It further includes details such as NPS score, open and pending issues, happy visits, complaints, etc. Pitch your topic with ease and precision using this Customer Rating And Reviews For Retail Store With Net Promoter Score Demonstration PDF. This layout presents information on Average Feedback, Happy Visits, Complains. It is also available for immediate download and adjustment. So, changes can be made in the color, design, graphics or any other component to create a unique layout.
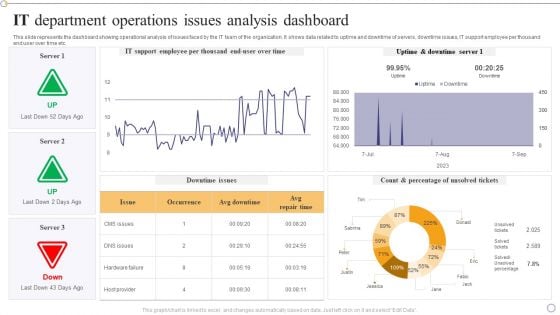
IT Department Operations Issues Analysis Dashboard Designs PDF
This slide represents the dashboard showing operational analysis of issues faced by the IT team of the organization. It shows data related to uptime and downtime of servers, downtime issues, IT support employee per thousand end user over time etc.Pitch your topic with ease and precision using this IT Department Operations Issues Analysis Dashboard Designs PDF. This layout presents information on Support Employee, Uptime Downtime, Percentage Unsolved. It is also available for immediate download and adjustment. So, changes can be made in the color, design, graphics or any other component to create a unique layout.

Manufactured Products Sales Performance Monitoring Dashboard Information PDF
This slide shows the dashboard the data related to the sales performance of the products manufactured by the organization in order to effectively measure and monitor the performance of the sales team. It shows details related to revenue generated and units sold etc.Pitch your topic with ease and precision using this Manufactured Products Sales Performance Monitoring Dashboard Information PDF. This layout presents information on Monthly Revenue, Manufactured Products, Sales Performance Monitoring. It is also available for immediate download and adjustment. So, changes can be made in the color, design, graphics or any other component to create a unique layout.
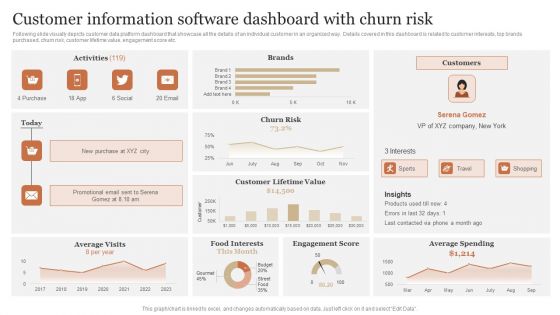
Customer Information Software Dashboard With Churn Risk Information PDF
Following slide visually depicts customer data platform dashboard that showcase all the details of an individual customer in an organized way. Details covered in this dashboard is related to customer interests, top brands purchased, churn risk, customer lifetime value, engagement score etc. Pitch your topic with ease and precision using this Customer Information Software Dashboard With Churn Risk Information PDF. This layout presents information on Customer Lifetime, Engagement Score, Average Spending. It is also available for immediate download and adjustment. So, changes can be made in the color, design, graphics or any other component to create a unique layout.
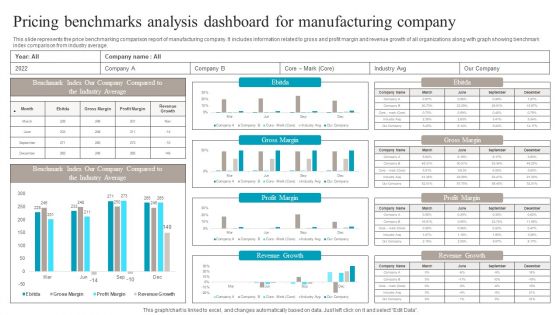
Pricing Benchmarks Analysis Dashboard For Manufacturing Company Structure PDF
This slide represents the price benchmarking comparison report of manufacturing company. It includes information related to gross and profit margin and revenue growth of all organizations along with graph showing benchmark index comparison from industry average. Pitch your topic with ease and precision using this Pricing Benchmarks Analysis Dashboard For Manufacturing Company Structure PDF. This layout presents information on Pricing Benchmarks Analysis, Dashboard For Manufacturing Company. It is also available for immediate download and adjustment. So, changes can be made in the color, design, graphics or any other component to create a unique layout.
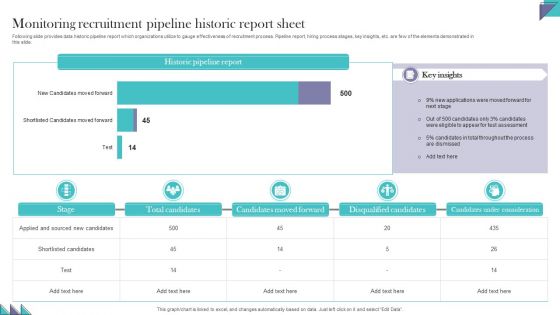
Monitoring Recruitment Pipeline Historic Report Sheet Pictures PDF
Following slide provides data historic pipeline report which organizations utilize to gauge effectiveness of recruitment process. Pipeline report, hiring process stages, key insights, etc. are few of the elements demonstrated in this slide. Pitch your topic with ease and precision using this Monitoring Recruitment Pipeline Historic Report Sheet Pictures PDF. This layout presents information on Candidates Moved Forward, Disqualified Candidates, Candidates Under Consideration. It is also available for immediate download and adjustment. So, changes can be made in the color, design, graphics or any other component to create a unique layout
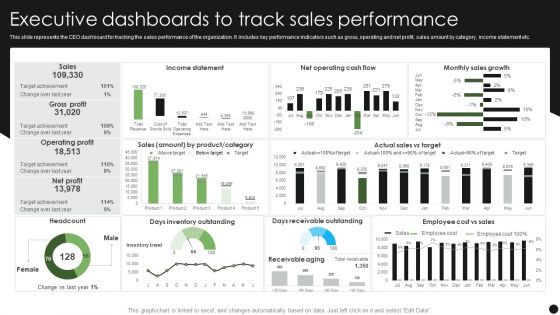
Executive Dashboards To Track Sales Performance Guidelines PDF
This slide represents the CEO dashboard for tracking the sales performance of the organization. It includes key performance indicators such as gross, operating and net profit, sales amount by category, income statement etc. Pitch your topic with ease and precision using this Executive Dashboards To Track Sales Performance Guidelines PDF. This layout presents information on Income Statement, Monthly Sales Growth, Days Receivable Outstanding. It is also available for immediate download and adjustment. So, changes can be made in the color, design, graphics or any other component to create a unique layout.
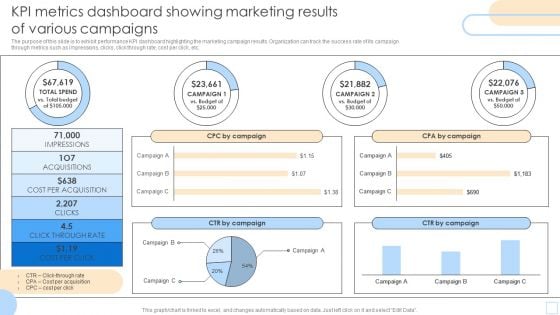
KPI Metrics Dashboard Showing Marketing Results Of Various Campaigns Pictures PDF
The purpose of this slide is to exhibit performance KPI dashboard highlighting the marketing campaign results. Organization can track the success rate of its campaign through metrics such as impressions, clicks, click through rate, cost per click, etc. Pitch your topic with ease and precision using this KPI Metrics Dashboard Showing Marketing Results Of Various Campaigns Pictures PDF. This layout presents information on Impressions, Acquisitions, CPA By Campaign. It is also available for immediate download and adjustment. So, changes can be made in the color, design, graphics or any other component to create a unique layout.
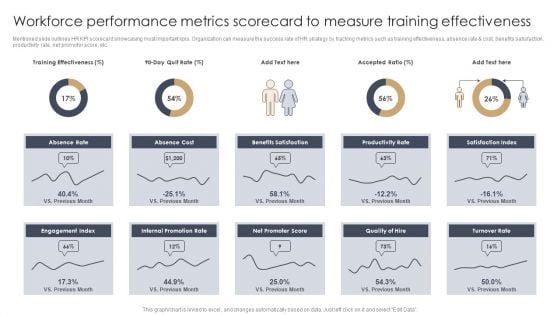
Workforce Performance Metrics Scorecard To Measure Training Effectiveness Information PDF
Mentioned slide outlines HR KPI scorecard showcasing most important kpis. Organization can measure the success rate of HR strategy by tracking metrics such as training effectiveness, absence rate and cost, benefits satisfaction, productivity rate, net promotor score, etc.Pitch your topic with ease and precision using this Workforce Performance Metrics Scorecard To Measure Training Effectiveness Information PDF. This layout presents information on Absence Rate, Internal Promotion, Engagement Index. It is also available for immediate download and adjustment. So, changes can be made in the color, design, graphics or any other component to create a unique layout.
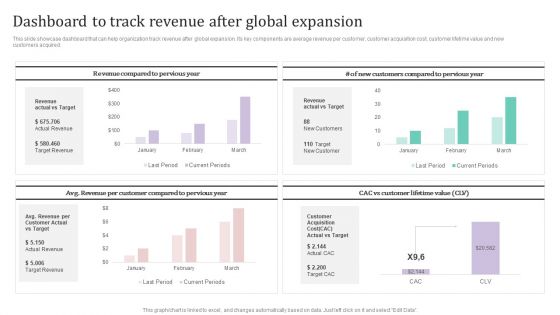
Dashboard To Track Revenue After Global Expansion Ppt PowerPoint Presentation File Example PDF
This slide showcase dashboard that can help organization track revenue after global expansion. Its key components are average revenue per customer, customer acquisition cost, customer lifetime value and new customers acquired.Take your projects to the next level with our ultimate collection of Dashboard To Track Revenue After Global Expansion Ppt PowerPoint Presentation File Example PDF. Slidegeeks has designed a range of layouts that are perfect for representing task or activity duration, keeping track of all your deadlines at a glance. Tailor these designs to your exact needs and give them a truly corporate look with your own brand colors they all make your projects stand out from the rest.
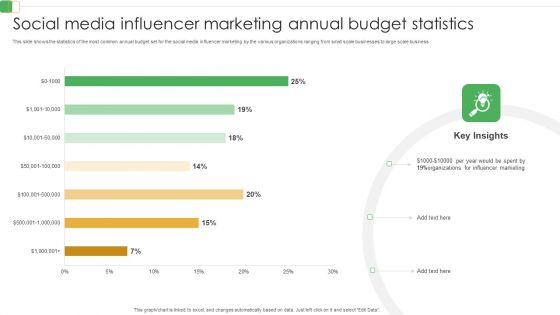
Social Media Influencer Marketing Annual Budget Statistics Ppt PowerPoint Presentation File Professional PDF
This slide shows the statistics of the most common annual budget set for the social media influencer marketing by the various organizations ranging from small scale businesses to large scale business. Pitch your topic with ease and precision using this Social Media Influencer Marketing Annual Budget Statistics Ppt PowerPoint Presentation File Professional PDF. This layout presents information on Social Media, Influencer Marketing, Annual Budget Statistics. It is also available for immediate download and adjustment. So, changes can be made in the color, design, graphics or any other component to create a unique layout.
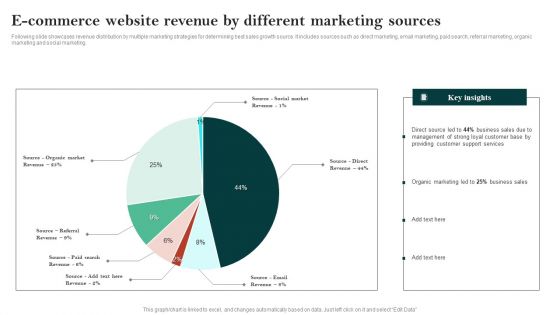
E Commerce Website Revenue By Different Marketing Sources Ppt Ideas PDF
Following slide showcases revenue distribution by multiple marketing strategies for determining best sales growth source. It includes sources such as direct marketing, email marketing, paid search, referral marketing, organic marketing and social marketing. Pitch your topic with ease and precision using this E Commerce Website Pre Launch Checklist Ppt Summary Backgrounds PDF. This layout presents information on Direct Source Led, Business Sales, Customer Base. It is also available for immediate download and adjustment. So, changes can be made in the color, design, graphics or any other component to create a unique layout.
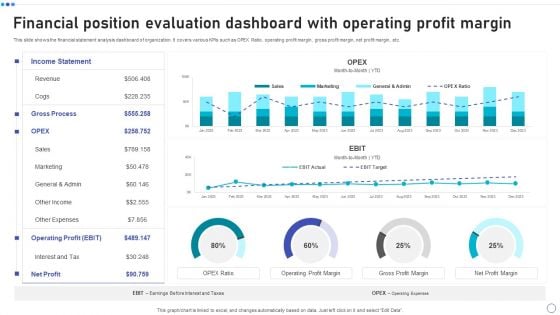
Financial Position Evaluation Dashboard With Operating Profit Margin Elements PDF
This slide shows the financial statement analysis dashboard of organization. It covers various KPIs such as OPEX Ratio, operating profit margin, gross profit margin, net profit margin, etc. Pitch your topic with ease and precision using this Financial Position Evaluation Dashboard With Operating Profit Margin Elements PDF. This layout presents information on Income Statement, Revenue, Operating Profit, Net Profit. It is also available for immediate download and adjustment. So, changes can be made in the color, design, graphics or any other component to create a unique layout.
Leads Tracking Dashboard With Conversion Funnel Ideas PDF
This slide showcases dashboard that can help organization to identify the total number of customers acquired from the sales and marketing qualified lead. It also showcases financial KPIs that are cost per lead, cost per customer, customer lifetine value and return on marketing investment. Pitch your topic with ease and precision using this Leads Tracking Dashboard With Conversion Funnel Ideas PDF. This layout presents information on Audience, Prospects, Conversion Funnel. It is also available for immediate download and adjustment. So, changes can be made in the color, design, graphics or any other component to create a unique layout.
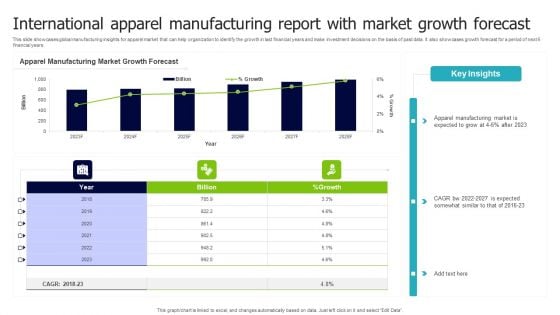
International Apparel Manufacturing Report With Market Growth Forecast Inspiration PDF
This slide showcases global manufacturing insights for apparel market that can help organization to identify the growth in last financial years and make investment decisions on the basis of past data. It also showcases growth forecast for a period of next 6 financial years. Pitch your topic with ease and precision using this International Apparel Manufacturing Report With Market Growth Forecast Inspiration PDF. This layout presents information on Apparel Manufacturing, Market Growth Forecast, Billion. It is also available for immediate download and adjustment. So, changes can be made in the color, design, graphics or any other component to create a unique layout.

International Housing Market Trends With Key Drivers Inspiration PDF
This slide showcases global statistics that can help organizations to estimate the forecasted growth of housing market and identify stock by region. It also showcases key drivers contributing in new housing developments. Pitch your topic with ease and precision using this International Housing Market Trends With Key Drivers Inspiration PDF. This layout presents information on Key Drivers, Housing Market, Forecasted. It is also available for immediate download and adjustment. So, changes can be made in the color, design, graphics or any other component to create a unique layout.
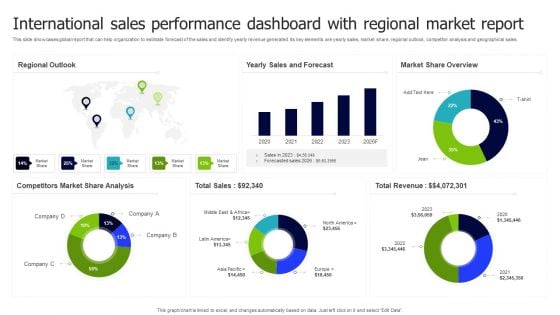
International Sales Performance Dashboard With Regional Market Report Inspiration PDF
This slide showcases global report that can help organization to estimate forecast of the sales and identify yearly revenue generated. Its key elements are yearly sales, market share, regional outlook, competitor analysis and geographical sales. Pitch your topic with ease and precision using this International Sales Performance Dashboard With Regional Market Report Inspiration PDF. This layout presents information on Regional Outlook, Sales And Forecast, Market Share Overview. It is also available for immediate download and adjustment. So, changes can be made in the color, design, graphics or any other component to create a unique layout.
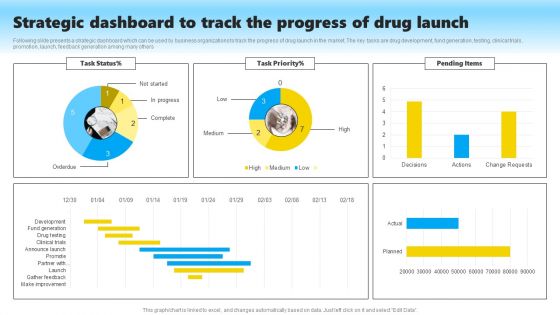
Strategic Dashboard To Track The Progress Of Drug Launch Structure PDF
Following slide presents a strategic dashboard which can be used by business organizations to track the progress of drug launch in the market. The key tasks are drug development, fund generation, testing, clinical trials, promotion, launch, feedback generation among many others. Pitch your topic with ease and precision using this Strategic Dashboard To Track The Progress Of Drug Launch Structure PDF. This layout presents information on Drug Development, Fund Generation, Testing, Clinical Trials, Promotion, Launch, Feedback Generation. It is also available for immediate download and adjustment. So, changes can be made in the color, design, graphics or any other component to create a unique layout.
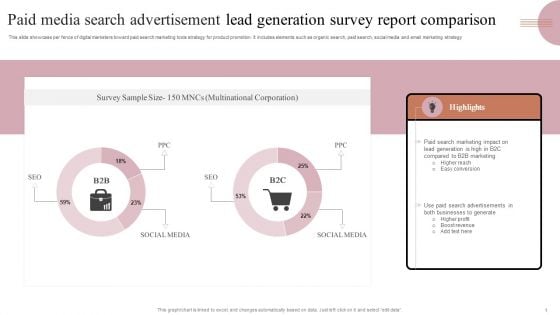
Paid Media Search Advertisement Lead Generation Survey Report Comparison Clipart PDF
This slide showcase per fence of digital marketers toward paid search marketing tools strategy for product promotion. It includes elements such as organic search, paid search, social media and email marketing strategy. Pitch your topic with ease and precision using this Paid Media Search Advertisement Lead Generation Survey Report Comparison Clipart PDF. This layout presents information on Search Marketing, B2B Marketing, Higher Profit. It is also available for immediate download and adjustment. So, changes can be made in the color, design, graphics or any other component to create a unique layout.
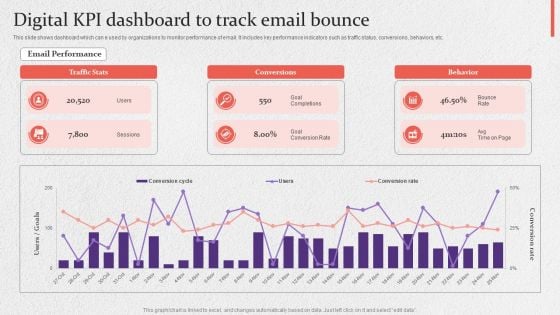
Digital KPI Dashboard To Track Email Bounce Slides PDF
This slide shows dashboard which can e used by organizations to monitor performance of email. It includes key performance indicators such as traffic status, conversions, behaviors, etc. Pitch your topic with ease and precision using this Digital KPI Dashboard To Track Email Bounce Slides PDF. This layout presents information on Digital Kpi Dashboard, Track Email Bounce. It is also available for immediate download and adjustment. So, changes can be made in the color, design, graphics or any other component to create a unique layout.
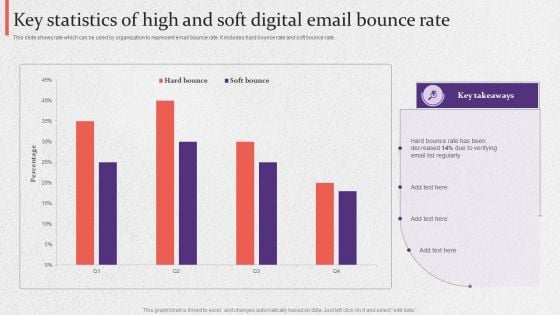
Key Statistics Of High And Soft Digital Email Bounce Rate Summary PDF
This slide shows rate which can be used by organization to represent email bounce rate. It includes hard bounce rate and soft bounce rate. Pitch your topic with ease and precision using this Key Statistics Of High And Soft Digital Email Bounce Rate Summary PDF. This layout presents information on Key Statistics, Soft Digital, Email Bounce Rate. It is also available for immediate download and adjustment. So, changes can be made in the color, design, graphics or any other component to create a unique layout.
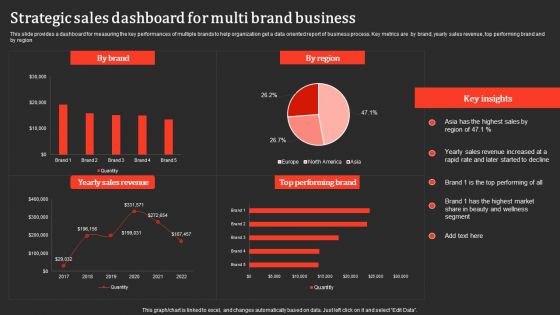
Strategic Sales Dashboard For Multi Brand Business Professional PDF
This slide provides a dashboard for measuring the key performances of multiple brands to help organization get a data oriented report of business process. Key metrics are by brand, yearly sales revenue, top performing brand and by region. Pitch your topic with ease and precision using this Strategic Sales Dashboard For Multi Brand Business Professional PDF. This layout presents information on Yearly Sales Revenue, Performing Brand. It is also available for immediate download and adjustment. So, changes can be made in the color, design, graphics or any other component to create a unique layout.
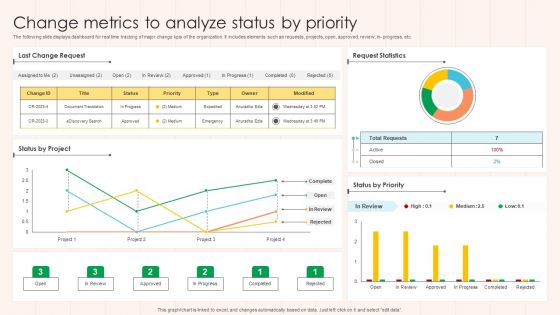
Change Metrics To Analyze Status By Priority Formats PDF
The following slide displays dashboard for real time tracking of major change kpis of the organization. It includes elements such as requests, projects, open, approved, review, in- progress, etc. Pitch your topic with ease and precision using this Change Metrics To Analyze Status By Priority Formats PDF This layout presents information on Project, Request Statistics, Priority. It is also available for immediate download and adjustment. So, changes can be made in the color, design, graphics or any other component to create a unique layout.
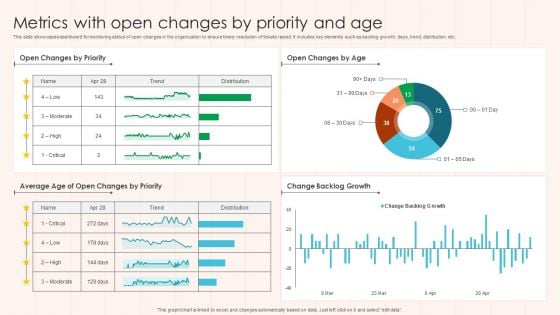
Metrics With Open Changes By Priority And Age Guidelines PDF
This slide showcases dashboard for monitoring status of open changes in the organization to ensure timely resolution of tickets raised. It includes key elements such as backlog growth, days, trend, distribution, etc. Pitch your topic with ease and precision using this Metrics With Open Changes By Priority And Age Guidelines PDF This layout presents information on Change Backlog Growth, Priority, Age. It is also available for immediate download and adjustment. So, changes can be made in the color, design, graphics or any other component to create a unique layout.
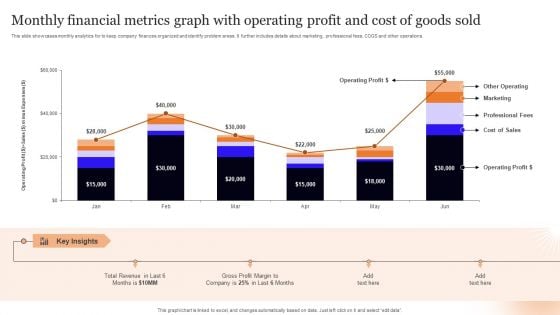
Monthly Financial Metrics Graph With Operating Profit And Cost Of Goods Sold Pictures PDF
This slide showcases monthly analytics for to keep company finances organized and identify problem areas. It further includes details about marketing, professional fees, COGS and other operations. Pitch your topic with ease and precision using this Monthly Financial Metrics Graph With Operating Profit And Cost Of Goods Sold Pictures PDF. This layout presents information on Key Insights, Operating Profit, Total Revenue. It is also available for immediate download and adjustment. So, changes can be made in the color, design, graphics or any other component to create a unique layout.

Enterprise Recruitment Dashboard With Cost Per Hire Graphics PDF
The following slide showcases KPI dashboard to get real- time insights about efficiency of corporate staffing process in the organization. It includes elements such as hired, days to fill, sources contribution, etc. Pitch your topic with ease and precision using this Enterprise Recruitment Dashboard With Cost Per Hire Graphics PDF. This layout presents information on Enterprise, Contribution, Cost. It is also available for immediate download and adjustment. So, changes can be made in the color, design, graphics or any other component to create a unique layout.

Retail Expenditure Dashboard And Performance Dashboard Formats PDF
This slide enables to track quarterly performance and return on marketing expenditure of online marketing executed by an organization. It includes source wise performance report , return on investment, sales funnel, average order value report etc. Pitch your topic with ease and precision using this Retail Expenditure Dashboard And Performance Dashboard Formats PDF. This layout presents information on Return On Investment, Product Sales, Revenue. It is also available for immediate download and adjustment. So, changes can be made in the color, design, graphics or any other component to create a unique layout.

IT Cyber Threat Prevention Technology Market Topics PDF
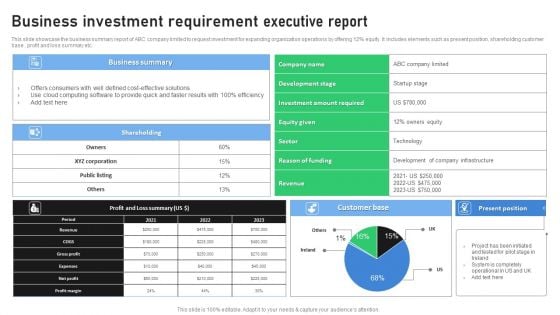
Business Investment Requirement Executive Report Designs PDF
This slide showcase the business summary report of ABC company limited to request investment for expanding organization operations by offering 12 percent equity. It includes elements such as present position, shareholding customer base , profit and loss summary etc. Pitch your topic with ease and precision using this Business Investment Requirement Executive Report Designs PDF. This layout presents information on Development Stage, Investment Amount Required, Business Summary. It is also available for immediate download and adjustment. So, changes can be made in the color, design, graphics or any other component to create a unique layout.
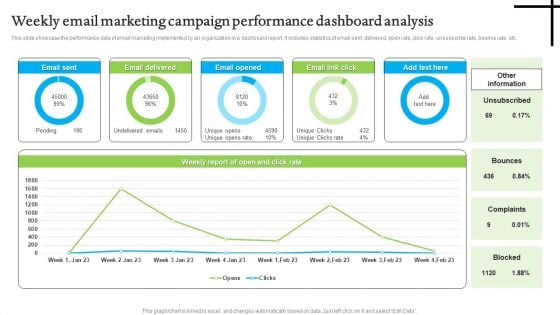
Weekly Email Marketing Campaign Performance Dashboard Analysis Structure PDF
This slide showcase the performance data of email marketing implemented by an organization in a dashboard report. It includes statistics of email sent, delivered, open rate, click rate, unsubscribe rate, bounce rate, etc. Pitch your topic with ease and precision using this Weekly Email Marketing Campaign Performance Dashboard Analysis Structure PDF. This layout presents information on Weekly Email Marketing, Campaign Performance Dashboard Analysis. It is also available for immediate download and adjustment. So, changes can be made in the color, design, graphics or any other component to create a unique layout.
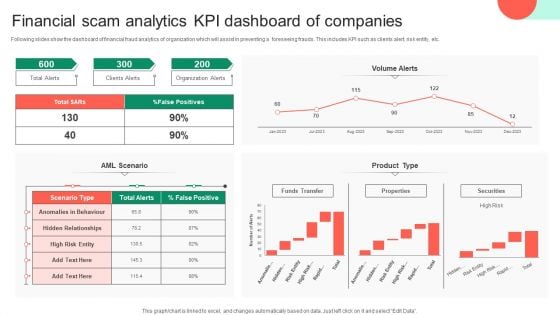
Financial Scam Analytics KPI Dashboard Of Companies Clipart PDF
Following slides show the dashboard of financial fraud analytics of organization which will assist in preventing a foreseeing frauds. This includes KPI such as clients alert, risk entity, etc. Pitch your topic with ease and precision using this Financial Scam Analytics KPI Dashboard Of Companies Clipart PDF. This layout presents information on Financial Scam Analytics, Kpi Dashboard Of Companies. It is also available for immediate download and adjustment. So, changes can be made in the color, design, graphics or any other component to create a unique layout.
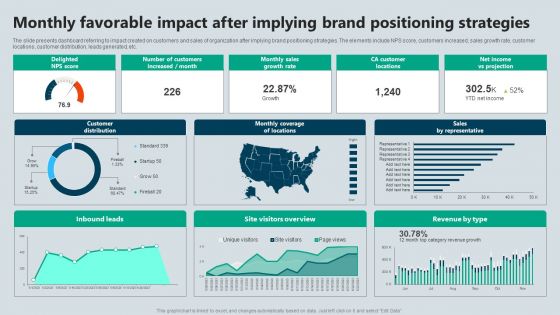
Monthly Favorable Impact After Implying Brand Positioning Strategies Demonstration PDF
The slide presents dashboard referring to impact created on customers and sales of organization after implying brand positioning strategies. The elements include NPS score, customers increased, sales growth rate, customer locations, customer distribution, leads generated, etc. Pitch your topic with ease and precision using this Monthly Favorable Impact After Implying Brand Positioning Strategies Demonstration PDF. This layout presents information on Strategies, Projection, Growth Rate. It is also available for immediate download and adjustment. So, changes can be made in the color, design, graphics or any other component to create a unique layout.
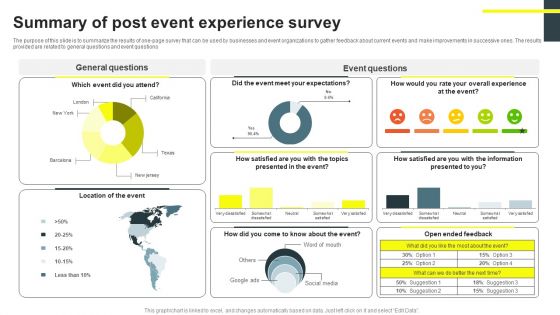
Summary Of Post Event Experience Survey Survey SS
The purpose of this slide is to summarize the results of one-page survey that can be used by businesses and event organizations to gather feedback about current events and make improvements in successive ones. The results provided are related to general questions and event questions. Pitch your topic with ease and precision using this Summary Of Post Event Experience Survey Survey SS. This layout presents information on General Questions, Event Questions, Location Of The Event, Social Media. It is also available for immediate download and adjustment. So, changes can be made in the color, design, graphics or any other component to create a unique layout.
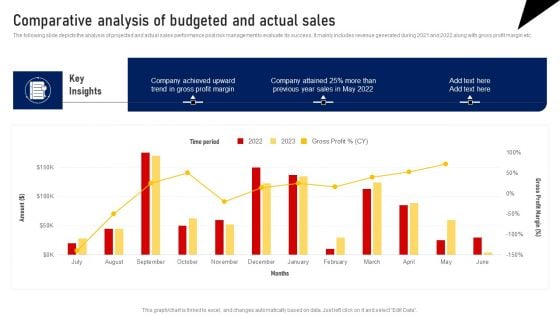
Comparative Analysis Of Budgeted And Actual Sales Template PDF
The following slide depicts the analysis of projected and actual sales performance post risk management to evaluate its success. It mainly includes revenue generated during 2021 and 2022 along with gross profit margin etc. This Comparative Analysis Of Budgeted And Actual Sales Template PDF from Slidegeeks makes it easy to present information on your topic with precision. It provides customization options, so you can make changes to the colors, design, graphics, or any other component to create a unique layout. It is also available for immediate download, so you can begin using it right away. Slidegeeks has done good research to ensure that you have everything you need to make your presentation stand out. Make a name out there for a brilliant performance.
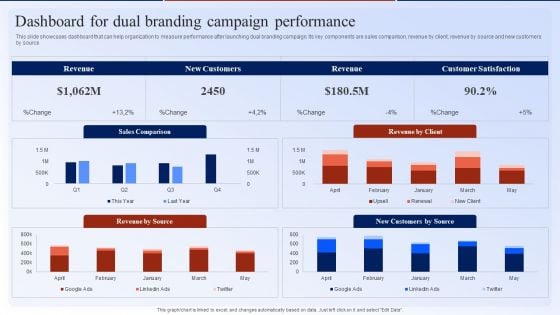
Dashboard For Dual Branding Campaign Performance Dual Branding Marketing Campaign Diagrams PDF
This slide showcases dashboard that can help organization to measure performance after launching dual branding campaign. Its key components are sales comparison, revenue by client, revenue by source and new customers by source. Here you can discover an assortment of the finest PowerPoint and Google Slides templates. With these templates, you can create presentations for a variety of purposes while simultaneously providing your audience with an eye-catching visual experience. Download Dashboard For Dual Branding Campaign Performance Dual Branding Marketing Campaign Diagrams PDF to deliver an impeccable presentation. These templates will make your job of preparing presentations much quicker, yet still, maintain a high level of quality. Slidegeeks has experienced researchers who prepare these templates and write high-quality content for you. Later on, you can personalize the content by editing the Dashboard For Dual Branding Campaign Performance Dual Branding Marketing Campaign Diagrams PDF.
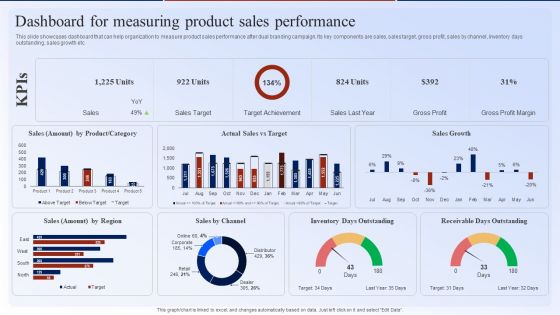
Dashboard For Measuring Product Sales Performance Dual Branding Marketing Campaign Information PDF
This slide showcases dashboard that can help organization to measure product sales performance after dual branding campaign. Its key components are sales, sales target, gross profit, sales by channel, inventory days outstanding, sales growth etc. This Dashboard For Measuring Product Sales Performance Dual Branding Marketing Campaign Information PDF from Slidegeeks makes it easy to present information on your topic with precision. It provides customization options, so you can make changes to the colors, design, graphics, or any other component to create a unique layout. It is also available for immediate download, so you can begin using it right away. Slidegeeks has done good research to ensure that you have everything you need to make your presentation stand out. Make a name out there for a brilliant performance.
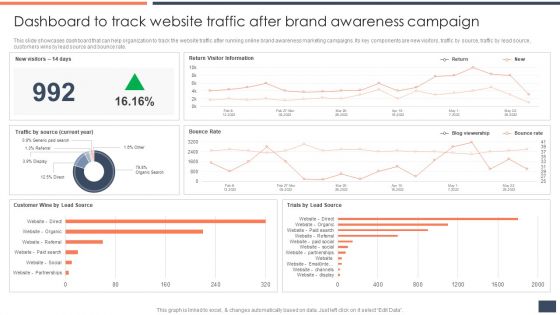
Dashboard To Track Website Traffic After Brand Awareness Campaign Clipart PDF
This slide showcases dashboard that can help organization to track the website traffic after running online brand awareness marketing campaigns. Its key components are new visitors, traffic by source, traffic by lead source, customers wins by lead source and bounce rate. This Dashboard To Track Website Traffic After Brand Awareness Campaign Clipart PDF from Slidegeeks makes it easy to present information on your topic with precision. It provides customization options, so you can make changes to the colors, design, graphics, or any other component to create a unique layout. It is also available for immediate download, so you can begin using it right away. Slidegeeks has done good research to ensure that you have everything you need to make your presentation stand out. Make a name out there for a brilliant performance.
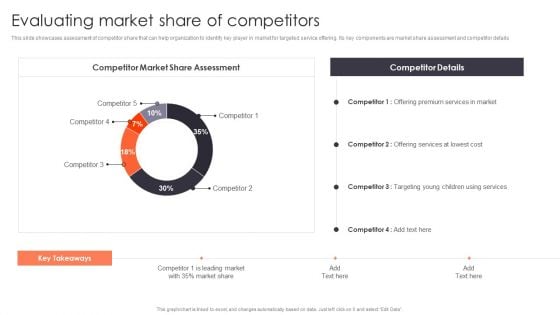
Promotion Strategies For New Service Launch Evaluating Market Share Of Competitors Designs PDF
This slide showcases assessment of competitor share that can help organization to identify key player in market for targeted service offering. Its key components are market share assessment and competitor details. This Promotion Strategies For New Service Launch Evaluating Market Share Of Competitors Designs PDF from Slidegeeks makes it easy to present information on your topic with precision. It provides customization options, so you can make changes to the colors, design, graphics, or any other component to create a unique layout. It is also available for immediate download, so you can begin using it right away. Slidegeeks has done good research to ensure that you have everything you need to make your presentation stand out. Make a name out there for a brilliant performance.
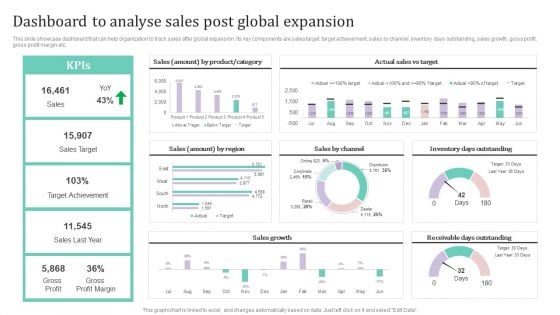
Dashboard To Analyse Sales Post Global Expansion Ppt PowerPoint Presentation File Styles PDF
This slide showcase dashboard that can help organization to track sales after global expansion. Its key components are sales target, target achievement, sales by channel, inventory days outstanding, sales growth, gross profit, gross profit margin etc.This Dashboard To Analyse Sales Post Global Expansion Ppt PowerPoint Presentation File Styles PDF from Slidegeeks makes it easy to present information on your topic with precision. It provides customization options, so you can make changes to the colors, design, graphics, or any other component to create a unique layout. It is also available for immediate download, so you can begin using it right away. Slidegeeks has done good research to ensure that you have everything you need to make your presentation stand out. Make a name out there for a brilliant performance.
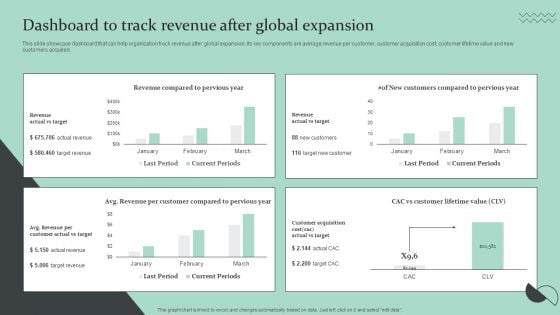
Strategic Global Expansion Business Plan Dashboard To Track Revenue After Global Expansion Topics PDF
This slide showcase dashboard that can help organization track revenue after global expansion. Its key components are average revenue per customer, customer acquisition cost, customer lifetime value and new customers acquired. Here you can discover an assortment of the finest PowerPoint and Google Slides templates. With these templates, you can create presentations for a variety of purposes while simultaneously providing your audience with an eye catching visual experience. Download Strategic Global Expansion Business Plan Dashboard To Track Revenue After Global Expansion Topics PDF to deliver an impeccable presentation. These templates will make your job of preparing presentations much quicker, yet still, maintain a high level of quality. Slidegeeks has experienced researchers who prepare these templates and write high quality content for you. Later on, you can personalize the content by editing the Strategic Global Expansion Business Plan Dashboard To Track Revenue After Global Expansion Topics PDF.
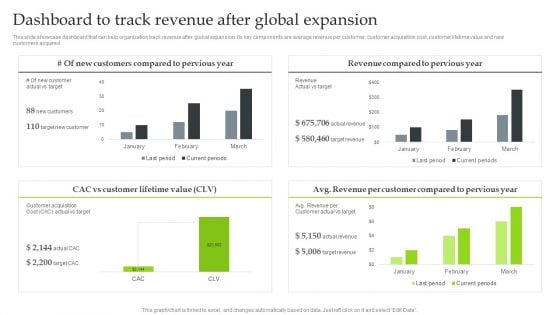
Expansion Strategic Plan Dashboard To Track Revenue After Global Expansion Rules PDF
This slide showcase dashboard that can help organization track revenue after global expansion. Its key components are average revenue per customer, customer acquisition cost, customer lifetime value and new customers acquired. Create an editable Expansion Strategic Plan Dashboard To Track Revenue After Global Expansion Rules PDF that communicates your idea and engages your audience. Whether youre presenting a business or an educational presentation, pre-designed presentation templates help save time. Expansion Strategic Plan Dashboard To Track Revenue After Global Expansion Rules PDF is highly customizable and very easy to edit, covering many different styles from creative to business presentations. Slidegeeks has creative team members who have crafted amazing templates. So, go and get them without any delay.
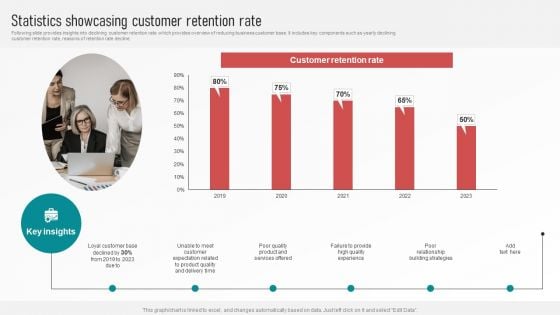
Customer Retention With Email Advertising Campaign Plan Statistics Showcasing Customer Retention Rate Pictures PDF
Following slide provides insights into declining customer retention rate which provides overview of reducing business customer base. It includes key components such as yearly declining customer retention rate, reasons of retention rate decline. This Customer Retention With Email Advertising Campaign Plan Statistics Showcasing Customer Retention Rate Pictures PDF is perfect for any presentation, be it in front of clients or colleagues. It is a versatile and stylish solution for organizing your meetings. The Customer Retention With Email Advertising Campaign Plan Statistics Showcasing Customer Retention Rate Pictures PDF features a modern design for your presentation meetings. The adjustable and customizable slides provide unlimited possibilities for acing up your presentation. Slidegeeks has done all the homework before launching the product for you. So, do not wait, grab the presentation templates today
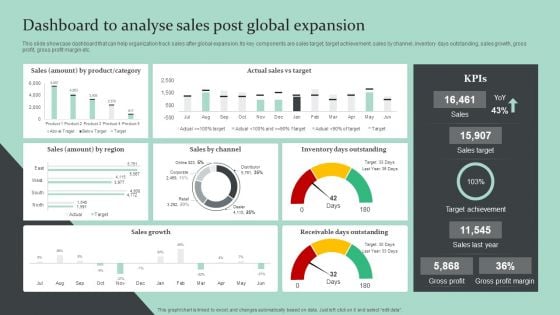
Strategic Global Expansion Business Plan Dashboard To Analyse Sales Post Global Expansion Diagrams PDF
This slide showcase dashboard that can help organization track sales after global expansion. Its key components are sales target, target achievement, sales by channel, inventory days outstanding, sales growth, gross profit, gross profit margin etc. Presenting this PowerPoint presentation, titled Strategic Global Expansion Business Plan Dashboard To Analyse Sales Post Global Expansion Diagrams PDF, with topics curated by our researchers after extensive research. This editable presentation is available for immediate download and provides attractive features when used. Download now and captivate your audience. Presenting this Strategic Global Expansion Business Plan Dashboard To Analyse Sales Post Global Expansion Diagrams PDF. Our researchers have carefully researched and created these slides with all aspects taken into consideration. This is a completely customizable Strategic Global Expansion Business Plan Dashboard To Analyse Sales Post Global Expansion Diagrams PDF that is available for immediate downloading. Download now and make an impact on your audience. Highlight the attractive features available with our PPTs.
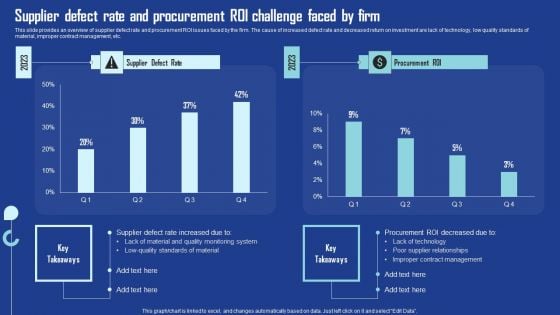
Supplier Defect Rate And Procurement Roi Challenge Faced By Firm Themes PDF
This slide provides an overview of supplier defect rate and procurement ROI issues faced by the firm. The cause of increased defect rate and decreased return on investment are lack of technology, low quality standards of material, improper contract management, etc. This Supplier Defect Rate And Procurement Roi Challenge Faced By Firm Themes PDF from Slidegeeks makes it easy to present information on your topic with precision. It provides customization options, so you can make changes to the colors, design, graphics, or any other component to create a unique layout. It is also available for immediate download, so you can begin using it right away. Slidegeeks has done good research to ensure that you have everything you need to make your presentation stand out. Make a name out there for a brilliant performance.
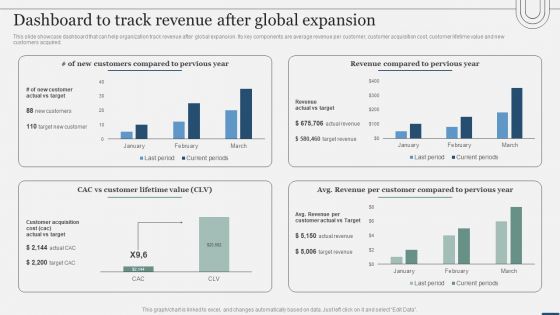
Assessing International Market Dashboard To Track Revenue After Global Expansion Template PDF
This slide showcase dashboard that can help organization track revenue after global expansion. Its key components are average revenue per customer, customer acquisition cost, customer lifetime value and new customers acquired. Crafting an eye-catching presentation has never been more straightforward. Let your presentation shine with this tasteful yet straightforward Assessing International Market Dashboard To Track Revenue After Global Expansion Template PDF template. It offers a minimalistic and classy look that is great for making a statement. The colors have been employed intelligently to add a bit of playfulness while still remaining professional. Construct the ideal Assessing International Market Dashboard To Track Revenue After Global Expansion Template PDF that effortlessly grabs the attention of your audience Begin now and be certain to wow your customers.
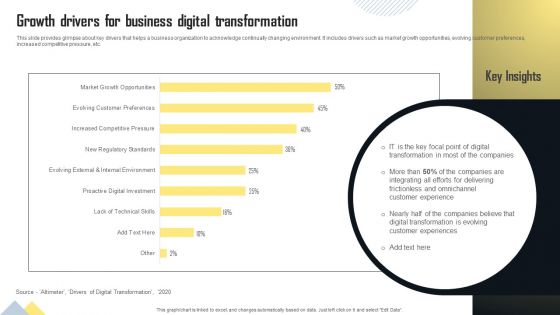
Growth Drivers For Business Digital Transformation Themes PDF
This slide provides glimpse about key drivers that helps a business organization to acknowledge continually changing environment. It includes drivers such as market growth opportunities, evolving customer preferences, increased competitive pressure, etc. This Growth Drivers For Business Digital Transformation Themes PDF from Slidegeeks makes it easy to present information on your topic with precision. It provides customization options, so you can make changes to the colors, design, graphics, or any other component to create a unique layout. It is also available for immediate download, so you can begin using it right away. Slidegeeks has done good research to ensure that you have everything you need to make your presentation stand out. Make a name out there for a brilliant performance.
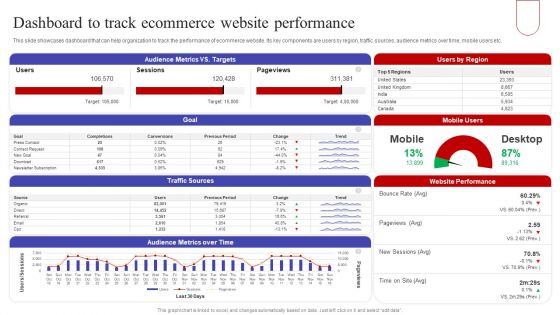
Dashboard To Track Ecommerce Website Performance Summary PDF
This slide showcases dashboard that can help organization to track the performance of ecommerce website. Its key components are users by region, traffic sources, audience metrics over time, mobile users etc. Do you know about Slidesgeeks Dashboard To Track Ecommerce Website Performance Summary PDF These are perfect for delivering any kind od presentation. Using it, create PowerPoint presentations that communicate your ideas and engage audiences. Save time and effort by using our pre designed presentation templates that are perfect for a wide range of topic. Our vast selection of designs covers a range of styles, from creative to business, and are all highly customizable and easy to edit. Download as a PowerPoint template or use them as Google Slides themes.
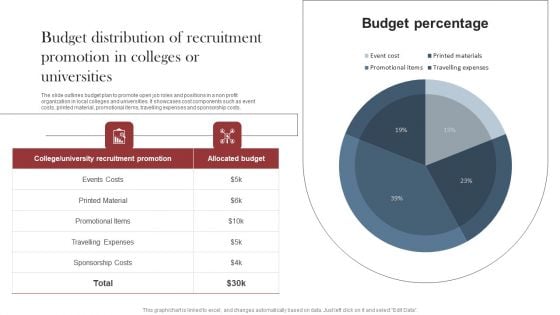
Recruitment Marketing Strategies For NPO Business Budget Distribution Of Recruitment Promotion In Colleges Information PDF
The slide outlines budget plan to promote open job roles and positions in a non profit organization in local colleges and universities. It showcases cost components such as event costs, printed material, promotional items, travelling expenses and sponsorship costs. Do you have to make sure that everyone on your team knows about any specific topic I yes, then you should give Recruitment Marketing Strategies For NPO Business Budget Distribution Of Recruitment Promotion In Colleges Information PDF a try. Our experts have put a lot of knowledge and effort into creating this impeccable Recruitment Marketing Strategies For NPO Business Budget Distribution Of Recruitment Promotion In Colleges Information PDF. You can use this template for your upcoming presentations, as the slides are perfect to represent even the tiniest detail. You can download these templates from the Slidegeeks website and these are easy to edit. So grab these today
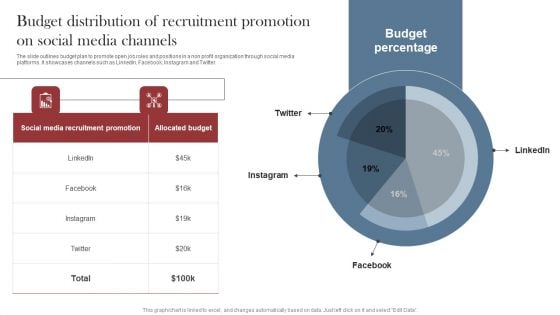
Recruitment Marketing Strategies For NPO Business Budget Distribution Of Recruitment Promotion Social Clipart PDF
The slide outlines budget plan to promote open job roles and positions in a non profit organization by using newspaper advertising. It showcases cost components such as ad design, ad placement, ad distribution and editorial costs. Get a simple yet stunning designed Recruitment Marketing Strategies For NPO Business Budget Distribution Of Recruitment Promotion Social Clipart PDF. It is the best one to establish the tone in your meetings. It is an excellent way to make your presentations highly effective. So, download this PPT today from Slidegeeks and see the positive impacts. Our easy-to-edit Recruitment Marketing Strategies For NPO Business Budget Distribution Of Recruitment Promotion Social Clipart PDF can be your go-to option for all upcoming conferences and meetings. So, what are you waiting for Grab this template today.
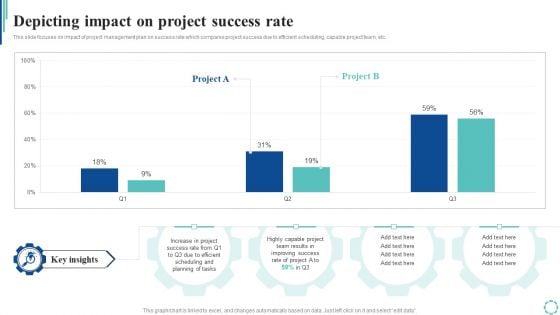
Depicting Impact On Project Success Rate Strategies To Enhance Project Lifecycle Infographics PDF
This slide focuses on impact of project management plan on success rate which compares project success due to efficient scheduling, capable project team, etc.This Depicting Impact On Project Success Rate Strategies To Enhance Project Lifecycle Infographics PDF from Slidegeeks makes it easy to present information on your topic with precision. It provides customization options, so you can make changes to the colors, design, graphics, or any other component to create a unique layout. It is also available for immediate download, so you can begin using it right away. Slidegeeks has done good research to ensure that you have everything you need to make your presentation stand out. Make a name out there for a brilliant performance.
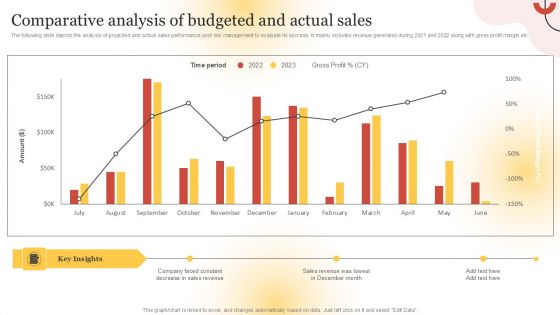
Executing Sales Risk Reduction Plan Comparative Analysis Of Budgeted And Actual Sales Topics PDF
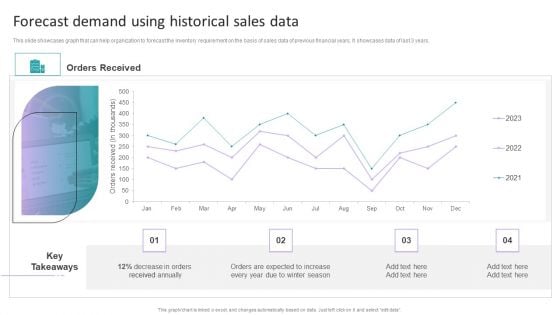
Stock Inventory Acquisition Forecast Demand Using Historical Sales Data Themes PDF
This slide showcases graph that can help organization to forecast the inventory requirement on the basis of sales data of previous financial years. It showcases data of last 3 years. This Stock Inventory Acquisition Forecast Demand Using Historical Sales Data Themes PDF from Slidegeeks makes it easy to present information on your topic with precision. It provides customization options, so you can make changes to the colors, design, graphics, or any other component to create a unique layout. It is also available for immediate download, so you can begin using it right away. Slidegeeks has done good research to ensure that you have everything you need to make your presentation stand out. Make a name out there for a brilliant performance.
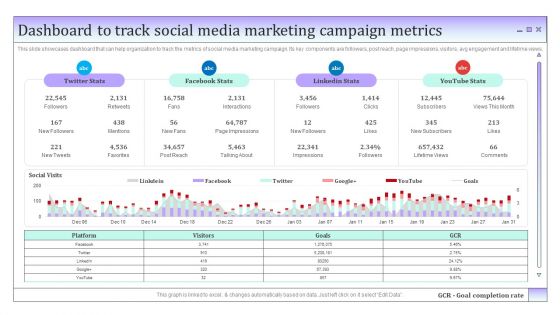
Business To Business Social Dashboard To Track Social Media Marketing Campaign Metrics Microsoft PDF
This slide showcases dashboard that can help organization to track the metrics of social media marketing campaign. Its key components are followers, post reach, page impressions, visitors, avg engagement and lifetime views. Here you can discover an assortment of the finest PowerPoint and Google Slides templates. With these templates, you can create presentations for a variety of purposes while simultaneously providing your audience with an eye-catching visual experience. Download Business To Business Social Dashboard To Track Social Media Marketing Campaign Metrics Microsoft PDF to deliver an impeccable presentation. These templates will make your job of preparing presentations much quicker, yet still, maintain a high level of quality. Slidegeeks has experienced researchers who prepare these templates and write high-quality content for you. Later on, you can personalize the content by editing the Business To Business Social Dashboard To Track Social Media Marketing Campaign Metrics Microsoft PDF.
Dashboard For Tracking Brand Awareness Advertisement Campaign Results Download PDF
This slide showcases dashboard that can help organization to track results of online advertisement campaigns. Its key components ad impressions, click through rate, cost per conversion, revenue per click, impressions, new users and sessions. Here you can discover an assortment of the finest PowerPoint and Google Slides templates. With these templates, you can create presentations for a variety of purposes while simultaneously providing your audience with an eye catching visual experience. Download Dashboard For Tracking Brand Awareness Advertisement Campaign Results Download PDF to deliver an impeccable presentation. These templates will make your job of preparing presentations much quicker, yet still, maintain a high level of quality. Slidegeeks has experienced researchers who prepare these templates and write high quality content for you. Later on, you can personalize the content by editing the Dashboard For Tracking Brand Awareness Advertisement Campaign Results Download PDF.
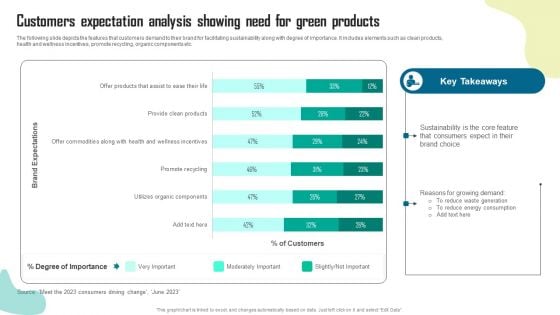
Customers Expectation Analysis Showing Need For Green Products Slides PDF
The following slide depicts the features that customers demand to their brand for facilitating sustainability along with degree of importance. It includes elements such as clean products, health and wellness incentives, promote recycling, organic components etc. Here you can discover an assortment of the finest PowerPoint and Google Slides templates. With these templates, you can create presentations for a variety of purposes while simultaneously providing your audience with an eye catching visual experience. Download Customers Expectation Analysis Showing Need For Green Products Slides PDF to deliver an impeccable presentation. These templates will make your job of preparing presentations much quicker, yet still, maintain a high level of quality. Slidegeeks has experienced researchers who prepare these templates and write high quality content for you. Later on, you can personalize the content by editing the Customers Expectation Analysis Showing Need For Green Products Slides PDF.
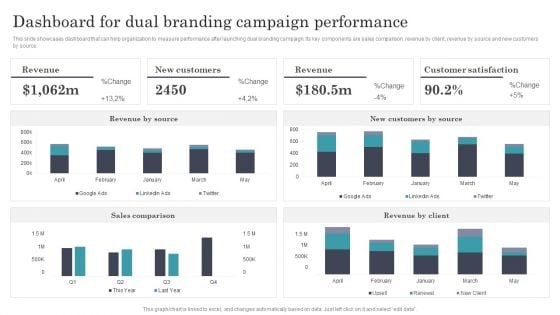
Developing Dual Branding Campaign For Brand Marketing Dashboard For Dual Branding Campaign Performance Ideas PDF
This slide showcases dashboard that can help organization to measure performance after launching dual branding campaign. Its key components are sales comparison, revenue by client, revenue by source and new customers by source. Boost your pitch with our creative Developing Dual Branding Campaign For Brand Marketing Dashboard For Dual Branding Campaign Performance Ideas PDF. Deliver an awe inspiring pitch that will mesmerize everyone. Using these presentation templates you will surely catch everyones attention. You can browse the ppts collection on our website. We have researchers who are experts at creating the right content for the templates. So you do not have to invest time in any additional work. Just grab the template now and use them.
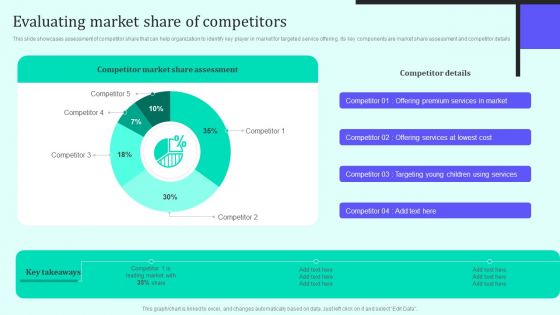
Implementing New Sales And Marketing Process For Services Evaluating Market Share Of Competitors Information PDF
This slide showcases assessment of competitor share that can help organization to identify key player in market for targeted service offering. Its key components are market share assessment and competitor details. Slidegeeks is one of the best resources for PowerPoint templates. You can download easily and regulate Implementing New Sales And Marketing Process For Services Evaluating Market Share Of Competitors Information PDF for your personal presentations from our wonderful collection. A few clicks is all it takes to discover and get the most relevant and appropriate templates. Use our Templates to add a unique zing and appeal to your presentation and meetings. All the slides are easy to edit and you can use them even for advertisement purposes.
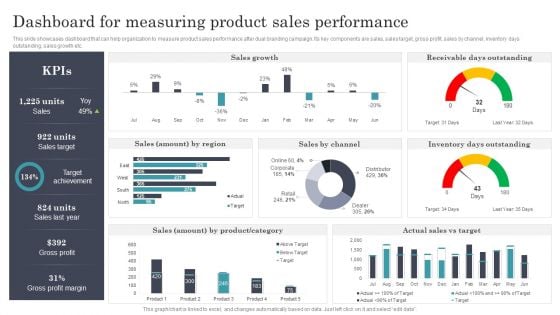
Developing Dual Branding Campaign For Brand Marketing Dashboard For Measuring Product Sales Performance Clipart PDF
This slide showcases dashboard that can help organization to measure product sales performance after dual branding campaign. Its key components are sales, sales target, gross profit, sales by channel, inventory days outstanding, sales growth etc. Create an editable Developing Dual Branding Campaign For Brand Marketing Dashboard For Measuring Product Sales Performance Clipart PDF that communicates your idea and engages your audience. Whether you are presenting a business or an educational presentation, pre designed presentation templates help save time. Developing Dual Branding Campaign For Brand Marketing Dashboard For Measuring Product Sales Performance Clipart PDF is highly customizable and very easy to edit, covering many different styles from creative to business presentations. Slidegeeks has creative team members who have crafted amazing templates. So, go and get them without any delay.
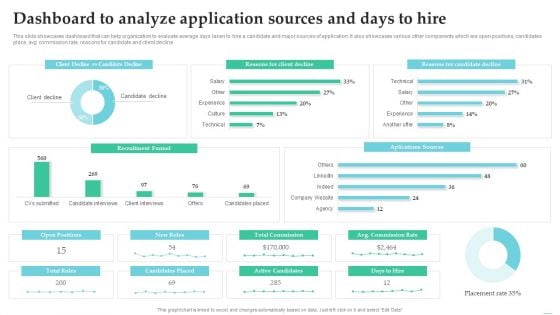
Employing Candidate Using Internal And External Mediums Of Recruitment Dashboard To Analyze Application Clipart PDF
This slide showcases dashboard that can help organization to evaluate average days taken to hire a candidate and major sources of application. It also showcases various other components which are open positions, candidates place, avg commission rate, reasons for candidate and client decline. From laying roadmaps to briefing everything in detail, our templates are perfect for you. You can set the stage with your presentation slides. All you have to do is download these easy to edit and customizable templates. Employing Candidate Using Internal And External Mediums Of Recruitment Dashboard To Analyze Application Clipart PDF will help you deliver an outstanding performance that everyone would remember and praise you for. Do download this presentation today.
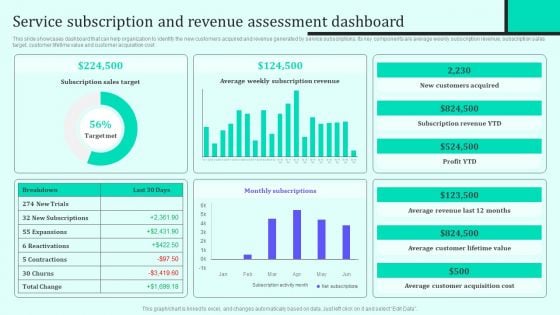
Implementing New Sales And Marketing Process For Services Service Subscription And Revenue Assessment Infographics PDF
This slide showcases dashboard that can help organization to identify the new customers acquired and revenue generated by service subscriptions. Its key components are average weekly subscription revenue, subscription sales target, customer lifetime value and customer acquisition cost. Do you have to make sure that everyone on your team knows about any specific topic I yes, then you should give Implementing New Sales And Marketing Process For Services Service Subscription And Revenue Assessment Infographics PDF a try. Our experts have put a lot of knowledge and effort into creating this impeccable Implementing New Sales And Marketing Process For Services Service Subscription And Revenue Assessment Infographics PDF. You can use this template for your upcoming presentations, as the slides are perfect to represent even the tiniest detail. You can download these templates from the Slidegeeks website and these are easy to edit. So grab these today.


 Continue with Email

 Home
Home


