Oil Icons
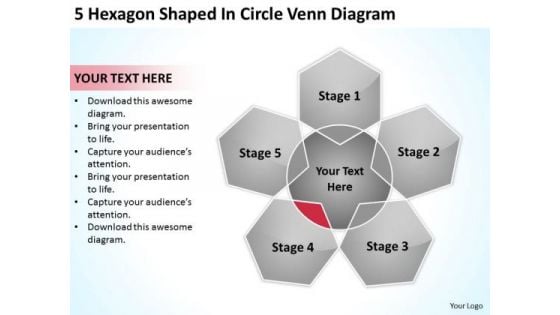
5 Hexagon Shaped In Circle Venn Diagram Ppt How To Do Business Plan PowerPoint Templates
We present our 5 hexagon shaped in circle venn diagram ppt how to do business plan PowerPoint templates.Download and present our Circle Charts PowerPoint Templates because Our PowerPoint Templates and Slides will bullet point your ideas. See them fall into place one by one. Download and present our Marketing PowerPoint Templates because Our PowerPoint Templates and Slides will provide you the cutting edge. Slice through the doubts in the minds of your listeners. Use our Business PowerPoint Templates because It will Strengthen your hand with your thoughts. They have all the aces you need to win the day. Download our Shapes PowerPoint Templates because You can Double your output with our PowerPoint Templates and Slides. They make beating deadlines a piece of cake. Download and present our Process and Flows PowerPoint Templates because Our PowerPoint Templates and Slides are effectively colour coded to prioritise your plans They automatically highlight the sequence of events you desire.Use these PowerPoint slides for presentations relating to Flow, chart, business concept, step, future, business, vector, sign, presentation, symbol, template, process, flowchart, report, title, shape, abstract, illustration, system, strategy, project, catalog, round, color full, web, solution, design, color, text, motion, hexagon, structure . The prominent colors used in the PowerPoint template are Red, Gray, Black. Interpret plans with our 5 Hexagon Shaped In Circle Venn Diagram Ppt How To Do Business Plan PowerPoint Templates. Download without worries with our money back guaranteee.
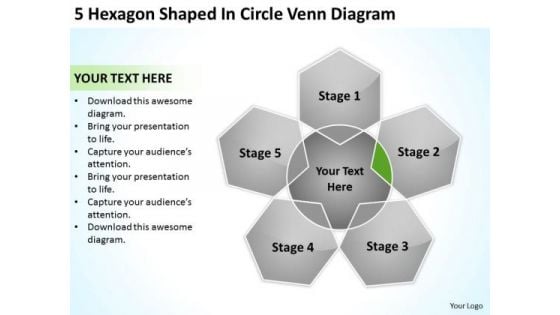
5 Hexagon Shaped In Circle Venn Diagram Successful Business Plan PowerPoint Slides
We present our 5 hexagon shaped in circle venn diagram successful business plan PowerPoint Slides.Present our Circle Charts PowerPoint Templates because Our PowerPoint Templates and Slides are focused like a searchlight beam. They highlight your ideas for your target audience. Download and present our Marketing PowerPoint Templates because Our PowerPoint Templates and Slides will let your words and thoughts hit bullseye everytime. Use our Business PowerPoint Templates because Our PowerPoint Templates and Slides are innately eco-friendly. Their high recall value negate the need for paper handouts. Use our Shapes PowerPoint Templates because Our PowerPoint Templates and Slides are topically designed to provide an attractive backdrop to any subject. Download and present our Process and Flows PowerPoint Templates because You should Ascend the ladder of success with ease. Our PowerPoint Templates and Slides will provide strong and sturdy steps.Use these PowerPoint slides for presentations relating to Flow, chart, business concept, step, future, business, vector, sign, presentation, symbol, template, process, flowchart, report, title, shape, abstract, illustration, system, strategy, project, catalog, round, color full, web, solution, design, color, text, motion, hexagon, structure . The prominent colors used in the PowerPoint template are Green, Gray, Black. Be a creative problem-solver with our 5 Hexagon Shaped In Circle Venn Diagram Successful Business Plan PowerPoint Slides. They will make you look good.
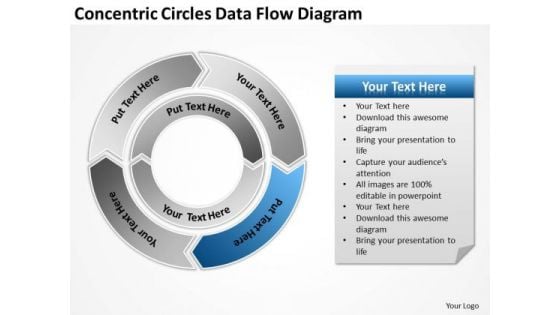
Concentric Circles Data Flow Diagram Examples Of Small Business Plans PowerPoint Templates
We present our concentric circles data flow diagram examples of small business plans PowerPoint templates.Download our Arrows PowerPoint Templates because It is Aesthetically crafted by artistic young minds. Our PowerPoint Templates and Slides are designed to display your dexterity. Download and present our Process and Flows PowerPoint Templates because you should Whip up a frenzy with our PowerPoint Templates and Slides. They will fuel the excitement of your team. Download and present our Flow Charts PowerPoint Templates because Our PowerPoint Templates and Slides are created by a hardworking bunch of busybees. Always flitting around with solutions gauranteed to please. Download our Business PowerPoint Templates because Our PowerPoint Templates and Slides are designed to help you succeed. They have all the ingredients you need. Use our Shapes PowerPoint Templates because You have a driving passion to excel in your field. Our PowerPoint Templates and Slides will prove ideal vehicles for your ideas.Use these PowerPoint slides for presentations relating to Arrows, speech, form, special, corporate, order, business, concept, arrow, bright, symbol, circle, match, usable, graphic, process,element, different, idea, shape, abstract, cycle, creative, illustration, piece, connection, chart, strategy, place, group, color, colorful, text, access, part, conceptual. The prominent colors used in the PowerPoint template are Blue, Gray, White. Exert some pressure with our Concentric Circles Data Flow Diagram Examples Of Small Business Plans PowerPoint Templates. Get the decision in your favour.
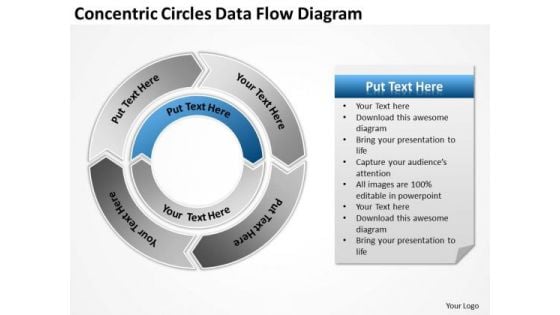
Concentric Circles Data Flow Diagram Ppt Non Profit Business Plans PowerPoint Templates
We present our concentric circles data flow diagram ppt non profit business plans PowerPoint templates.Present our Arrows PowerPoint Templates because You will get more than you ever bargained for. Download our Process and Flows PowerPoint Templates because They will bring a lot to the table. Their alluring flavours will make your audience salivate. Present our Flow Charts PowerPoint Templates because You can Zap them with our PowerPoint Templates and Slides. See them reel under the impact. Download our Business PowerPoint Templates because You can Hit the nail on the head with our PowerPoint Templates and Slides. Embed your ideas in the minds of your audience. Download our Shapes PowerPoint Templates because Our PowerPoint Templates and Slides offer you the needful to organise your thoughts. Use them to list out your views in a logical sequence.Use these PowerPoint slides for presentations relating to Arrows, speech, form, special, corporate, order, business, concept, arrow, bright, symbol, circle, match, usable, graphic, process,element, different, idea, shape, abstract, cycle, creative, illustration, piece, connection, chart, strategy, place, group, color, colorful, text, access, part, conceptual. The prominent colors used in the PowerPoint template are Blue, White, Gray. Analyse the evidence accurately with our Concentric Circles Data Flow Diagram Ppt Non Profit Business Plans PowerPoint Templates. Steer your audience away from fallacy.
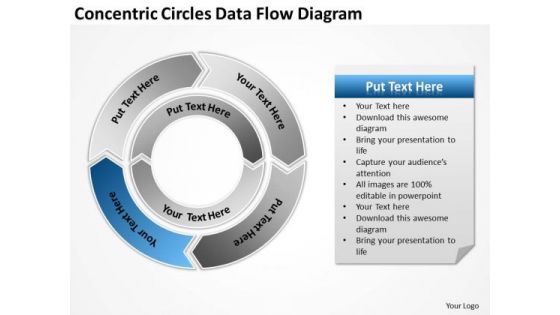
Concentric Circles Data Flow Diagram Writing Your Business Plan PowerPoint Templates
We present our concentric circles data flow diagram writing your business plan PowerPoint templates.Use our Arrows PowerPoint Templates because It will let you Set new benchmarks with our PowerPoint Templates and Slides. They will keep your prospects well above par. Download and present our Flow Charts PowerPoint Templates because Our PowerPoint Templates and Slides help you pinpoint your timelines. Highlight the reasons for your deadlines with their use. Present our Process and Flows PowerPoint Templates because You can Create a matrix with our PowerPoint Templates and Slides. Feel the strength of your ideas click into place. Download our Shapes PowerPoint Templates because Our PowerPoint Templates and Slides will let you Clearly mark the path for others to follow. Download and present our Business PowerPoint Templates because It will Raise the bar of your Thoughts. They are programmed to take you to the next level.Use these PowerPoint slides for presentations relating to Arrows, speech, form, special, corporate, order, business, concept, arrow, bright, symbol, circle, match, usable, graphic, process,element, different, idea, shape, abstract, cycle, creative, illustration, piece, connection, chart, strategy, place, group, color, colorful, text, access, part, conceptual. The prominent colors used in the PowerPoint template are Blue, White, Gray. Our Concentric Circles Data Flow Diagram Writing Your Business Plan PowerPoint Templates amplify your erudition. You will be earmarked for your brilliance.
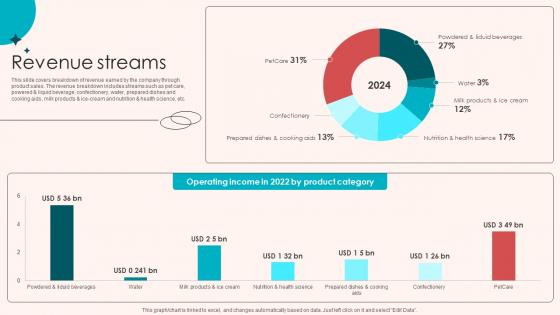
Revenue Streams Retail Merchandising Company Investor Funding Elevator Pitch Deck Ppt Slides
This slide covers breakdown of revenue earned by the company through product sales. The revenue breakdown includes streams such as pet care, powered and liquid beverage, confectionery, water, prepared dishes and cooking aids, milk products and ice-cream and nutrition and health science, etc. This modern and well-arranged Revenue Streams Retail Merchandising Company Investor Funding Elevator Pitch Deck Ppt Slides provides lots of creative possibilities. It is very simple to customize and edit with the Powerpoint Software. Just drag and drop your pictures into the shapes. All facets of this template can be edited with Powerpoint, no extra software is necessary. Add your own material, put your images in the places assigned for them, adjust the colors, and then you can show your slides to the world, with an animated slide included. This slide covers breakdown of revenue earned by the company through product sales. The revenue breakdown includes streams such as pet care, powered and liquid beverage, confectionery, water, prepared dishes and cooking aids, milk products and ice-cream and nutrition and health science, etc.
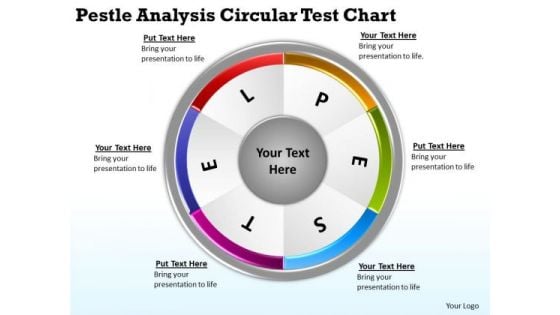
Pestle Analysis Circular Test Chart Forma Business Plan PowerPoint Templates
We present our pestle analysis circular test chart forma business plan PowerPoint templates.Download and present our Ring Charts PowerPoint Templates because Our PowerPoint Templates and Slides offer you the needful to organise your thoughts. Use them to list out your views in a logical sequence. Use our Flow Charts PowerPoint Templates because It will Raise the bar of your Thoughts. They are programmed to take you to the next level. Download our Process and Flows PowerPoint Templates because Our PowerPoint Templates and Slides are innately eco-friendly. Their high recall value negate the need for paper handouts. Download and present our Success PowerPoint Templates because Our PowerPoint Templates and Slides will bullet point your ideas. See them fall into place one by one. Download our Shapes PowerPoint Templates because You can Double your output with our PowerPoint Templates and Slides. They make beating deadlines a piece of cake.Use these PowerPoint slides for presentations relating to Arrow, vector, website, speech, form, green, special, corporate, order, red, business, concept, bright, symbol, circle, match, usable, graphic, process,element, different, idea, shape, abstract, cycle, creative, illustration, piece, connection, chart, strategy, place, frame, web, solution, design, group, color, colorful,blue, text, pestle, access, part, conceptual. The prominent colors used in the PowerPoint template are Green, Red, Pink. Cast our Pestle Analysis Circular Test Chart Forma Business Plan PowerPoint Templates in your act. The audience will call for an encore.
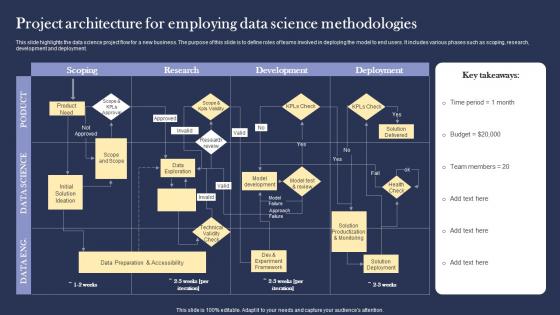
Project Architecture For Employing Data Science Methodologies Topics pdf
This slide highlights the data science project flow for a new business. The purpose of this slide is to define roles of teams involved in deploying the model to end users. It includes various phases such as scoping, research, development and deployment. Showcasing this set of slides titled Project Architecture For Employing Data Science Methodologies Topics pdf. The topics addressed in these templates are Scoping, Research, Development And Deployment. All the content presented in this PPT design is completely editable. Download it and make adjustments in color, background, font etc. as per your unique business setting. This slide highlights the data science project flow for a new business. The purpose of this slide is to define roles of teams involved in deploying the model to end users. It includes various phases such as scoping, research, development and deployment.

Internet Banking B2B Client Journey Clipart Pdf
The following slide displays b2b customer journey and emotional experience while signing up for internet banking services. It further includes information about phase of journey, goal, touchpoints, etc. Pitch your topic with ease and precision using this Internet Banking B2B Client Journey Clipart Pdf. This layout presents information on Customer Decision, Internet Banking, Client Journey, Internet Banking Research. It is also available for immediate download and adjustment. So, changes can be made in the color, design, graphics or any other component to create a unique layout. The following slide displays b2b customer journey and emotional experience while signing up for internet banking services. It further includes information about phase of journey, goal, touchpoints, etc.
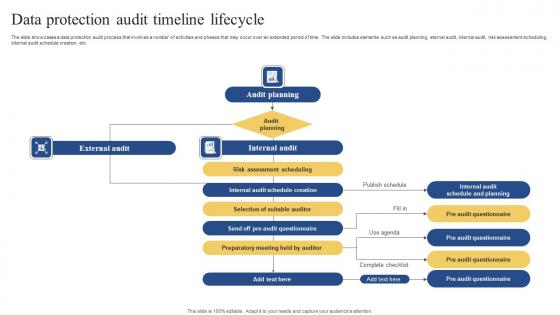
Data Protection Audit Timeline Lifecycle Pictures Pdf
The slide showcases a data protection audit process that involves a number of activities and phases that may occur over an extended period of time. The slide includes elements such as audit planning, eternal audit, internal audit, risk assessment scheduling, internal audit schedule creation, etc. Pitch your topic with ease and precision using this Data Protection Audit Timeline Lifecycle Pictures Pdf. This layout presents information on Audit Planning, Audit Planning, Internal Audit. It is also available for immediate download and adjustment. So, changes can be made in the color, design, graphics or any other component to create a unique layout. The slide showcases a data protection audit process that involves a number of activities and phases that may occur over an extended period of time. The slide includes elements such as audit planning, eternal audit, internal audit, risk assessment scheduling, internal audit schedule creation, etc.
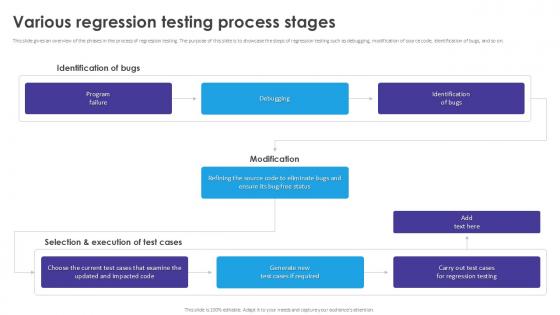
Various Regression Testing Automated Regression Testing And Achieving PPT Example
This slide gives an overview of the phases in the process of regression testing. The purpose of this slide is to showcase the steps of regression testing such as debugging, modification of source code, identification of bugs, and so on. Take your projects to the next level with our ultimate collection of Various Regression Testing Automated Regression Testing And Achieving PPT Example Slidegeeks has designed a range of layouts that are perfect for representing task or activity duration, keeping track of all your deadlines at a glance. Tailor these designs to your exact needs and give them a truly corporate look with your own brand colors they will make your projects stand out from the rest This slide gives an overview of the phases in the process of regression testing. The purpose of this slide is to showcase the steps of regression testing such as debugging, modification of source code, identification of bugs, and so on.
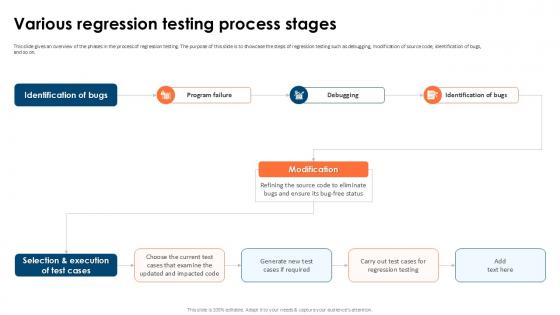
Various Regression Testing Partial Regression Testing For A Best PPT Sample
This slide gives an overview of the phases in the process of regression testing. The purpose of this slide is to showcase the steps of regression testing such as debugging, modification of source code, identification of bugs, and so on. Take your projects to the next level with our ultimate collection of Various Regression Testing Partial Regression Testing For A Best PPT Sample Slidegeeks has designed a range of layouts that are perfect for representing task or activity duration, keeping track of all your deadlines at a glance. Tailor these designs to your exact needs and give them a truly corporate look with your own brand colors they will make your projects stand out from the rest This slide gives an overview of the phases in the process of regression testing. The purpose of this slide is to showcase the steps of regression testing such as debugging, modification of source code, identification of bugs, and so on.
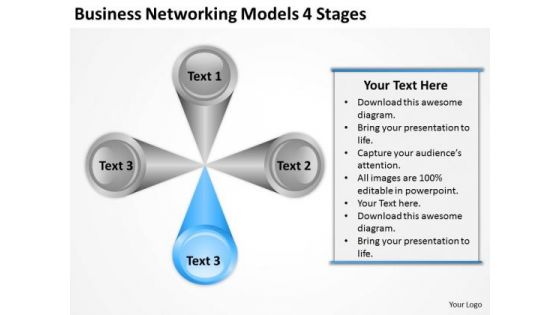
Download Networking Models 4 Stages Business Plan Template PowerPoint Templates
We present our download networking models 4 stages business plan template PowerPoint templates.Use our Finance PowerPoint Templates because You are well armed with penetrative ideas. Our PowerPoint Templates and Slides will provide the gunpowder you need. Download our Advertising PowerPoint Templates because They will Put the wind in your sails. Skim smoothly over the choppy waters of the market. Download and present our Org Charts PowerPoint Templates because Our PowerPoint Templates and Slides are the chords of your song. String them along and provide the lilt to your views. Present our Business PowerPoint Templates because Your ideas provide food for thought. Our PowerPoint Templates and Slides will help you create a dish to tickle the most discerning palate. Download and present our Circle Charts PowerPoint Templates because Our PowerPoint Templates and Slides are aesthetically designed to attract attention. We gaurantee that they will grab all the eyeballs you need.Use these PowerPoint slides for presentations relating to Product, customer, sales, model, resentation, business, concept, diagram, selling, process, distribution, marketing, integration, management, steps, system, activities, clipart, guidelines, direction, design, manufacturing, lifecycle, organization, commerce, conceptual, resource, theoretical, performance. The prominent colors used in the PowerPoint template are Blue, Gray, White. Get enticed by the look of our Download Networking Models 4 Stages Business Plan Template PowerPoint Templates. They creare a captivating aura.
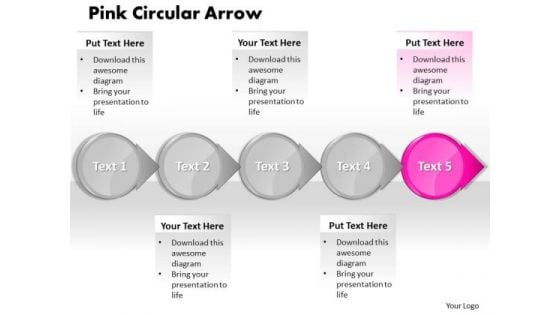
Ppt Pink Arrow Process Flow PowerPoint Template Chart Templates
PPT pink arrow process flow powerpoint template chart Templates-To display a structured combination of statements and achievements, our premium quality set of Circular Arrows - Horizontal for Microsoft PowerPoint describes the perfect tool. This compelling set consists of ready-made text layouts designed in the shape of arrows and text boxes. Those challenging charts offer a large variety of options. All elements are editable and can be changed e. g. in color or size.-PPT pink arrow process flow powerpoint template chart Templates-abstract, access, arrow, background, banner, business, chart, circle, color, concept, connection, corporate, creative, cycle, design, different, element, graphic, group, idea, illustration, process, red, shape, speech, strategy, symbol, template, text, usable, vector, Be superman with our Ppt Pink Arrow Process Flow PowerPoint Template Chart Templates. You will come out on top.
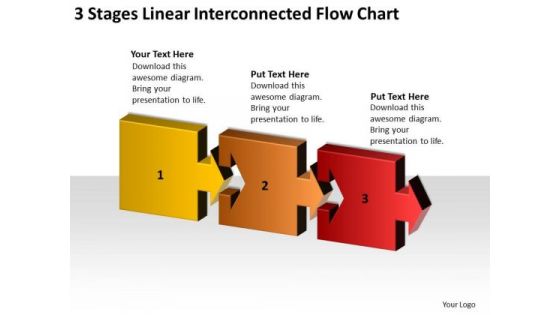
3 Stages Linear Interconnected Flow Chart Business Plan Outline PowerPoint Templates
We present our 3 stages linear interconnected flow chart business plan outline PowerPoint templates.Download our Technology PowerPoint Templates because You have the co-ordinates for your destination of success. Let our PowerPoint Templates and Slides map out your journey. Present our Advertising PowerPoint Templates because Our PowerPoint Templates and Slides will let you Hit the right notes. Watch your audience start singing to your tune. Use our Arrows PowerPoint Templates because You can Channelise the thoughts of your team with our PowerPoint Templates and Slides. Urge them to focus on the goals you have set. Present our Business PowerPoint Templates because These PowerPoint Templates and Slides will give the updraft to your ideas. See them soar to great heights with ease. Use our Process and Flows PowerPoint Templates because Our PowerPoint Templates and Slides are designed to help you succeed. They have all the ingredients you need.Use these PowerPoint slides for presentations relating to Diagram, chart, vector, flow, flowchart, graph, business, process, linear, model, segment, process flow, vibrant, program, kind of diagram, arrow chart, process diagram, arrow, sign, symbol, process arrows, element, diagram, technology, development management, connection, flow chart, strategy, section, solution, process chart, direction, design, linear diagram, organization, diagram, flow diagram. The prominent colors used in the PowerPoint template are Red, Yellow, Orange. Bid farewell to all your doubts. Attain assuredness with our 3 Stages Linear Interconnected Flow Chart Business Plan Outline PowerPoint Templates.
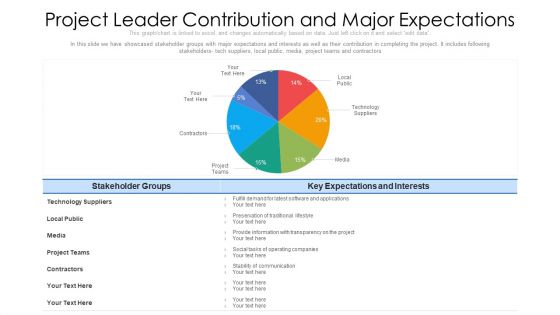
Project Leader Contribution And Major Expectations Ppt PowerPoint Presentation File Diagrams PDF
In this slide we have showcased stakeholder groups with major expectations and interests as well as their contribution in completing the project. It includes following stakeholders- tech suppliers, local public, media, project teams and contractors. Pitch your topic with ease and precision using this project leader contribution and major expectations ppt powerpoint presentation file diagrams pdf. This layout presents information on technology, media, contractors. It is also available for immediate download and adjustment. So, changes can be made in the color, design, graphics or any other component to create a unique layout.
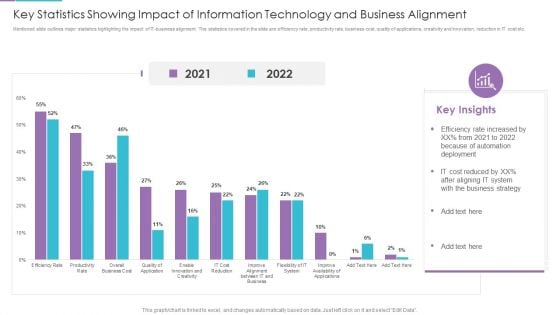
Key Statistics Showing Impact Of Information Technology And Business Alignment Diagrams PDF
Mentioned slide outlines major statistics highlighting the impact of IT business alignment. The statistics covered in the slide are efficiency rate, productivity rate, business cost, quality of applications, creativity and innovation, reduction in IT cost etc. Showcasing this set of slides titled key statistics showing impact of information technology and business alignment diagrams pdf. The topics addressed in these templates are reduced, system, business strategy. All the content presented in this PPT design is completely editable. Download it and make adjustments in color, background, font etc. as per your unique business setting.
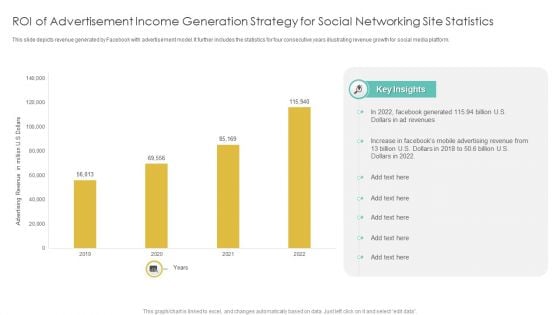
Roi Of Advertisement Income Generation Strategy For Social Networking Site Statistics Diagrams PDF
This slide depicts revenue generated by Facebook with advertisement model. It further includes the statistics for four consecutive years illustrating revenue growth for social media platform. Pitch your topic with ease and precision using this Roi Of Advertisement Income Generation Strategy For Social Networking Site Statistics Diagrams PDF. This layout presents information on Advertisement Income, Generation Strategy, Social Networking Site Statistics. It is also available for immediate download and adjustment. So, changes can be made in the color, design, graphics or any other component to create a unique layout.
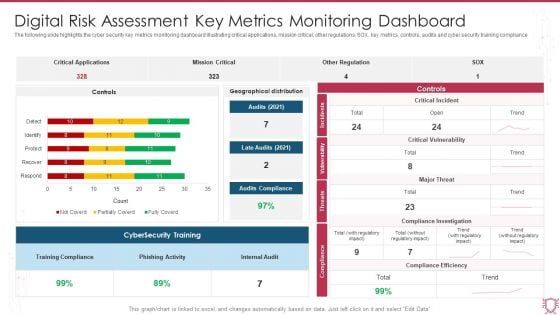
Digital Risk Assessment Key Metrics Monitoring Dashboard Ppt Ideas Diagrams PDF
The following slide highlights the cyber security key metrics monitoring dashboard illustrating critical applications, mission critical, other regulations, SOX, key metrics, controls, audits and cyber security training compliance. Showcasing this set of slides titled Digital Risk Assessment Key Metrics Monitoring Dashboard Ppt Ideas Diagrams PDF. The topics addressed in these templates are Critical Applications, Mission Critical, Other Regulation. All the content presented in this PPT design is completely editable. Download it and make adjustments in color, background, font etc. as per your unique business setting.
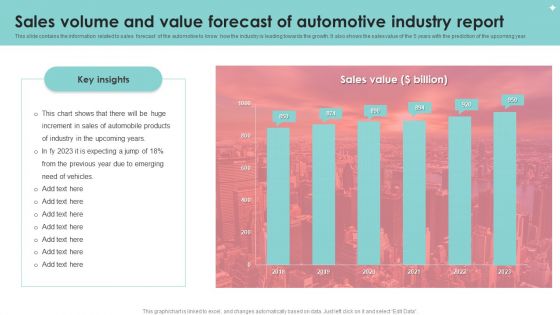
Sales Volume And Value Forecast Of Automotive Industry Report Diagrams PDF
This slide contains the information related to sales forecast of the automotive to know how the industry is leading towards the growth. It also shows the sales value of the 5 years with the prediction of the upcoming year. Showcasing this set of slides titled Sales Volume And Value Forecast Of Automotive Industry Report Diagrams PDF. The topics addressed in these templates are Sales Volume, Value Forecast, Automotive Industry Report. All the content presented in this PPT design is completely editable. Download it and make adjustments in color, background, font etc. as per your unique business setting.
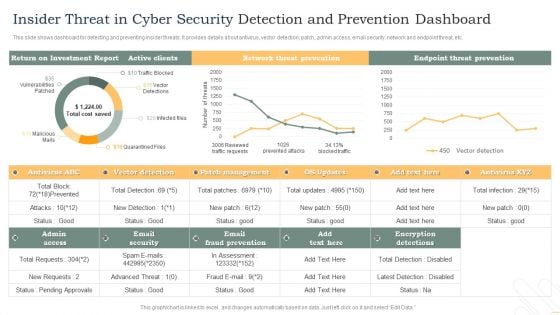
Insider Threat In Cyber Security Detection And Prevention Dashboard Diagrams PDF
This slide shows dashboard for detecting and preventing insider threats. It provides details about antivirus, vector detection, patch, admin access, email security, network and endpoint threat, etc. Pitch your topic with ease and precision using this Insider Threat In Cyber Security Detection And Prevention Dashboard Diagrams PDF. This layout presents information on Active Clients, Network Threat Prevention, Endpoint Threat Prevention. It is also available for immediate download and adjustment. So, changes can be made in the color, design, graphics or any other component to create a unique layout.
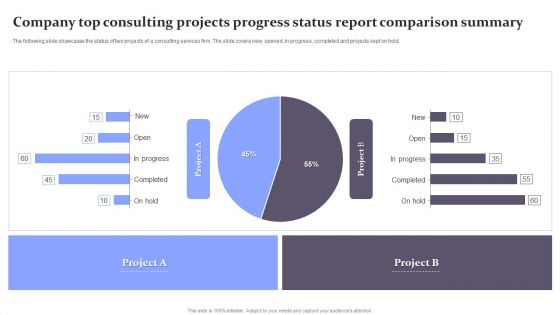
Company Top Consulting Projects Progress Status Report Comparison Summary Diagrams PDF
The following slide showcases the status of two projects of a consulting services firm. The slide covers new, opened, in progress, completed and projects kept on hold. Pitch your topic with ease and precision using this Company Top Consulting Projects Progress Status Report Comparison Summary Diagrams PDF. This layout presents information on Company Top Consulting Projects Progress, Status Report Comparison Summary. It is also available for immediate download and adjustment. So, changes can be made in the color, design, graphics or any other component to create a unique layout.

Performance Analysis Using Operating Revenue Business Operational Expenditure And Income Metrics Diagrams PDF
This slide illustrates performance analysis using operating revenue, operating expenditure opex and income metrics which can be referred by organizations to evaluate their inflows and outflows to make relevant decisions for increasing profitability. It includes information about operating revenue, operating expense and income before taxes. Pitch your topic with ease and precision using this Performance Analysis Using Operating Revenue Business Operational Expenditure And Income Metrics Diagrams PDF. This layout presents information on Taxes, Highest Operating, Recorded. It is also available for immediate download and adjustment. So, changes can be made in the color, design, graphics or any other component to create a unique layout.
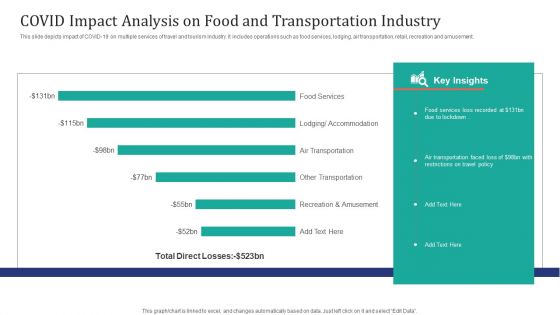
COVID Impact Analysis On Food And Transportation Industry Ppt Infographic Template Diagrams PDF
This slide depicts impact of COVID-19 on multiple services of travel and tourism industry. It includes operations such as food services, lodging, air transportation, retail, recreation and amusement. Showcasing this set of slides titled COVID Impact Analysis On Food And Transportation Industry Ppt Infographic Template Diagrams PDF. The topics addressed in these templates are Food Services, Air Transportation Faced, Restrictions Travel Policy. All the content presented in this PPT design is completely editable. Download it and make adjustments in color, background, font etc. as per your unique business setting.
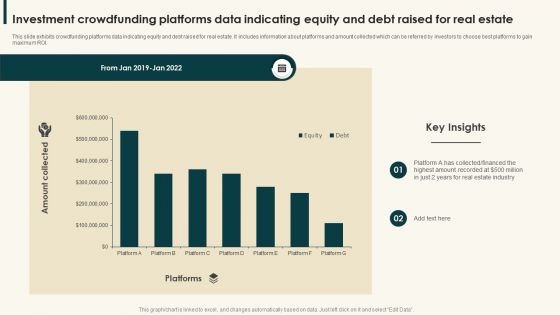
Investment Crowdfunding Platforms Data Indicating Equity And Debt Raised For Real Estate Diagrams PDF
This slide exhibits crowdfunding platforms data indicating equity and debt raised for real estate. It includes information about platforms and amount collected which can be referred by investors to choose best platforms to gain maximum ROI.Showcasing this set of slides titled Investment Crowdfunding Platforms Data Indicating Equity And Debt Raised For Real Estate Diagrams PDF. The topics addressed in these templates are Collected Financed, Highest Amount, Estate Industry. All the content presented in this PPT design is completely editable. Download it and make adjustments in color, background, font etc. as per your unique business setting.
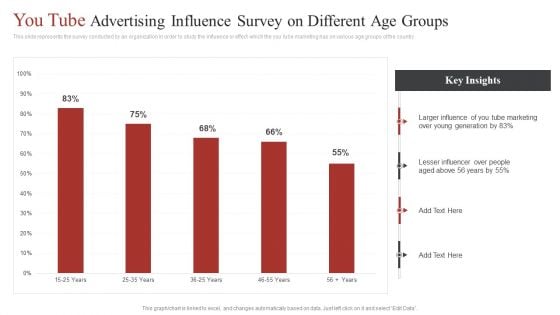
You Tube Advertising Influence Survey On Different Age Groups Ppt Diagram Ppt PDF
This slide represents the survey conducted by an organization in order to study the influence or effect which the you tube marketing has on various age groups of the country. Pitch your topic with ease and precision using this You Tube Advertising Influence Survey On Different Age Groups Ppt Diagram Ppt PDF. This layout presents information on Larger Influence, You Tube Marketing, Young Generation. It is also available for immediate download and adjustment. So, changes can be made in the color, design, graphics or any other component to create a unique layout.
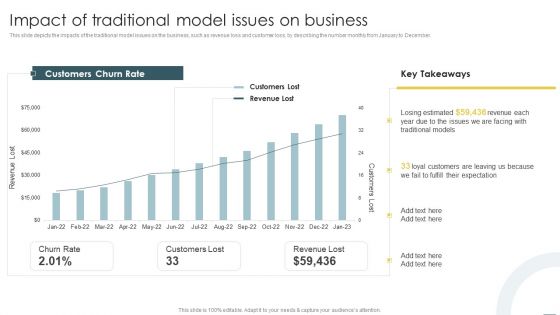
Crystal Methods In Agile Framework Impact Of Traditional Model Issues On Business Diagrams PDF
This slide depicts the impacts of the traditional model issues on the business, such as revenue loss and customer loss, by describing the number monthly from January to December. Take your projects to the next level with our ultimate collection of Crystal Methods In Agile Framework Impact Of Traditional Model Issues On Business Diagrams PDF. Slidegeeks has designed a range of layouts that are perfect for representing task or activity duration, keeping track of all your deadlines at a glance. Tailor these designs to your exact needs and give them a truly corporate look with your own brand colors they will make your projects stand out from the rest.
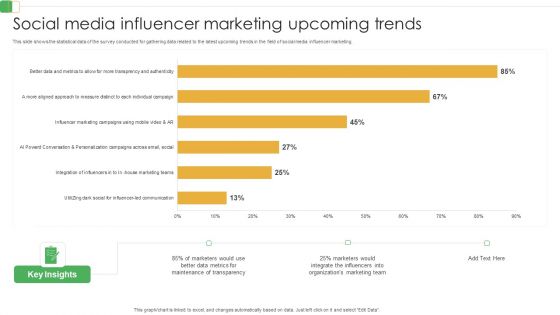
Social Media Influencer Marketing Upcoming Trends Ppt PowerPoint Presentation Diagram Templates PDF
This slide shows the statistical data of the survey conducted for gathering data related to the latest upcoming trends in the field of social media influencer marketing.Showcasing this set of slides titled Social Media Influencer Marketing Upcoming Trends Ppt PowerPoint Presentation Diagram Templates PDF. The topics addressed in these templates are Maintenance Transparency, Better Data Metrics, Integrate Influencers. All the content presented in this PPT design is completely editable. Download it and make adjustments in color, background, font etc. as per your unique business setting.
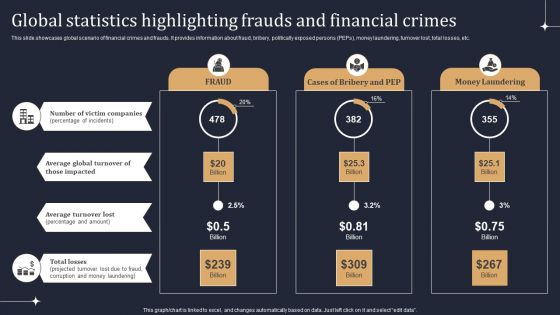
KYC Transaction Monitoring System Business Security Global Statistics Highlighting Frauds Diagrams PDF
This slide showcases global scenario of financial crimes and frauds. It provides information about fraud, bribery, politically exposed persons PEPs, money laundering, turnover lost, total losses, etc. Take your projects to the next level with our ultimate collection of KYC Transaction Monitoring System Business Security Global Statistics Highlighting Frauds Diagrams PDF. Slidegeeks has designed a range of layouts that are perfect for representing task or activity duration, keeping track of all your deadlines at a glance. Tailor these designs to your exact needs and give them a truly corporate look with your own brand colors they will make your projects stand out from the rest.
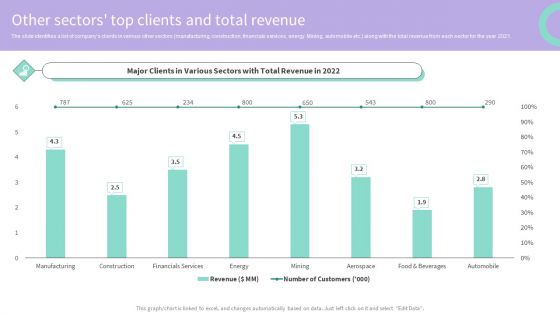
Buy Side Merger And Acquisition Advisory Other Sectors Top Clients And Total Revenue Diagrams PDF
The slide identifies a list of companys clients in various other sectors manufacturing, construction, financials services, energy. Mining, automobile etc. along with the total revenue from each sector for the year 2021. Take your projects to the next level with our ultimate collection of Buy Side Merger And Acquisition Advisory Other Sectors Top Clients And Total Revenue Diagrams PDF. Slidegeeks has designed a range of layouts that are perfect for representing task or activity duration, keeping track of all your deadlines at a glance. Tailor these designs to your exact needs and give them a truly corporate look with your own brand colors they will make your projects stand out from the rest.
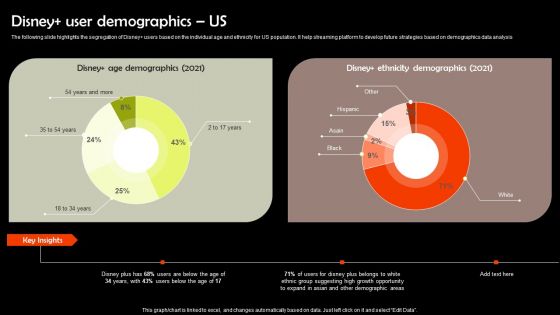
Digital Media Streaming Platform Company Profile Disney User Demographics US Diagrams PDF
The following slide highlights the segregation of Disney users based on the individual age and ethnicity for US population. It help streaming platform to develop future strategies based on demographics data analysis Take your projects to the next level with our ultimate collection of Digital Media Streaming Platform Company Profile Disney User Demographics US Diagrams PDF. Slidegeeks has designed a range of layouts that are perfect for representing task or activity duration, keeping track of all your deadlines at a glance. Tailor these designs to your exact needs and give them a truly corporate look with your own brand colors they will make your projects stand out from the rest.
Providing Efficient Client Services Kpi Dashboard For Tracking Customer Retention Diagrams PDF
This slide covers the dashboard for analyzing customer loyalty with metrics such as NPS, loyal customer rate, premium users, CLV, customer churn, revenue churn, net retention, MRR growth, etc. Take your projects to the next level with our ultimate collection of Providing Efficient Client Services Kpi Dashboard For Tracking Customer Retention Diagrams PDF. Slidegeeks has designed a range of layouts that are perfect for representing task or activity duration, keeping track of all your deadlines at a glance. Tailor these designs to your exact needs and give them a truly corporate look with your own brand colors they will make your projects stand out from the rest.
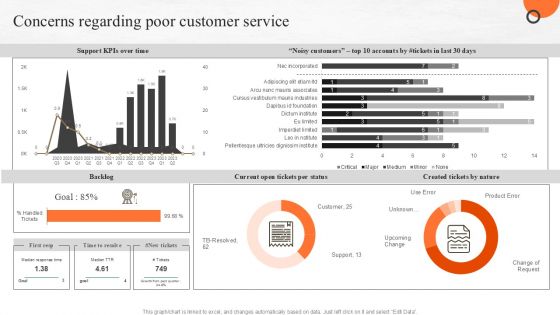
Concerns Regarding Poor Customer Service Ppt PowerPoint Presentation Diagram Images PDF
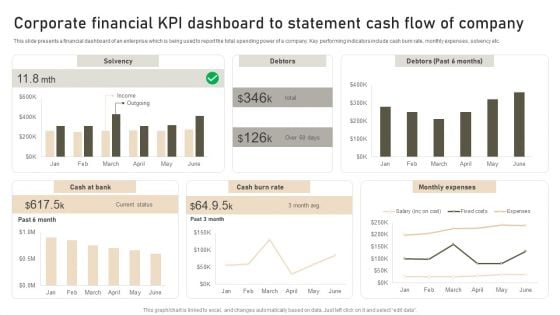
Corporate Financial KPI Dashboard To Statement Cash Flow Of Company Diagrams PDF
This slide presents a financial dashboard of an enterprise which is being used to report the total spending power of a company. Key performing indicators include cash burn rate, monthly expenses, solvency etc. Showcasing this set of slides titled Corporate Financial KPI Dashboard To Statement Cash Flow Of Company Diagrams PDF. The topics addressed in these templates are Solvency, Debtors, Monthly Expenses. All the content presented in this PPT design is completely editable. Download it and make adjustments in color, background, font etc. as per your unique business setting.
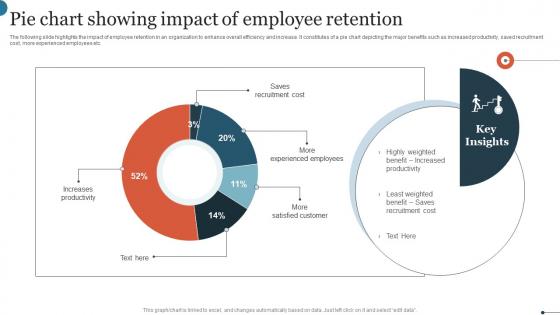
Pie Chart Showing Impact Of Employee Retention Mockup Pdf
The following slide highlights the impact of employee retention in an organization to enhance overall efficiency and increase. It constitutes of a pie chart depicting the major benefits such as increased productivity, saved recruitment cost, more experienced employees etc. Showcasing this set of slides titled Pie Chart Showing Impact Of Employee Retention Mockup Pdf. The topics addressed in these templates are Saves Recruitment Cost, More Experienced Employees, More Satisfied Customer. All the content presented in this PPT design is completely editable. Download it and make adjustments in color, background, font etc. as per your unique business setting. The following slide highlights the impact of employee retention in an organization to enhance overall efficiency and increase. It constitutes of a pie chart depicting the major benefits such as increased productivity, saved recruitment cost, more experienced employees etc.
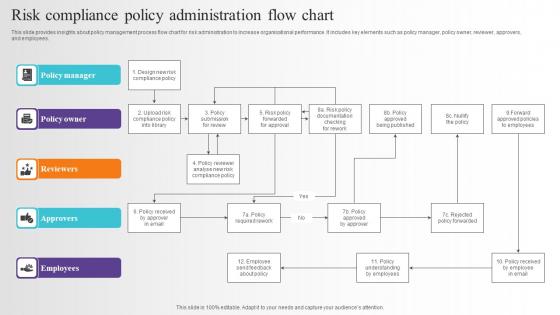
Risk Compliance Policy Administration Flow Chart Introduction Pdf
This slide provides insights about policy management process flow chart for risk administration to increase organisational performance. It includes key elements such as policy manager, policy owner, reviewer, approvers, and employees. Showcasing this set of slides titled Risk Compliance Policy Administration Flow Chart Introduction Pdf. The topics addressed in these templates are Policy Owner, Reviewer, Approvers, Employees. All the content presented in this PPT design is completely editable. Download it and make adjustments in color, background, font etc. as per your unique business setting. This slide provides insights about policy management process flow chart for risk administration to increase organisational performance. It includes key elements such as policy manager, policy owner, reviewer, approvers, and employees.
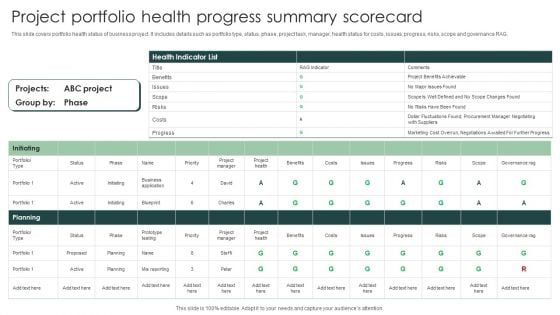
Project Portfolio Health Progress Summary Scorecard Diagrams PDF
This slide covers portfolio health status of business project. It includes details such as portfolio type, status, phase, project task, manager, health status for costs, issues, progress, risks, scope and governance RAG.Showcasing this set of slides titled Project Portfolio Health Progress Summary Scorecard Diagrams PDF. The topics addressed in these templates are Project Benefits Achievable, Procurement Manager, Negotiations Awaited. All the content presented in this PPT design is completely editable. Download it and make adjustments in color, background, font etc. as per your unique business setting.
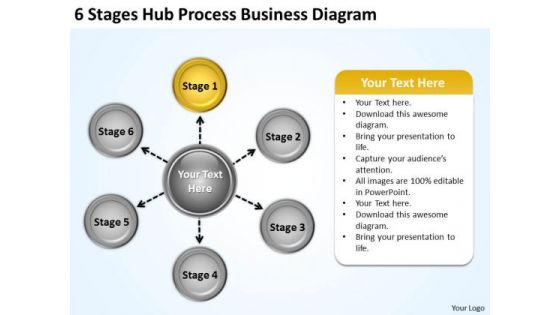
Creative Marketing Concepts 6 Stages Hub Process Business Diagram Plan Strategy
We present our creative marketing concepts 6 stages hub process business diagram plan strategy.Download and present our Arrows PowerPoint Templates because You can Stir your ideas in the cauldron of our PowerPoint Templates and Slides. Cast a magic spell on your audience. Download and present our Circle Charts PowerPoint Templates because It will let you Set new benchmarks with our PowerPoint Templates and Slides. They will keep your prospects well above par. Use our Process and Flows PowerPoint Templates because you can Add colour to your speech with our PowerPoint Templates and Slides. Your presentation will leave your audience speechless. Present our Business PowerPoint Templates because Our PowerPoint Templates and Slides will Activate the energies of your audience. Get their creative juices flowing with your words. Present our Marketing PowerPoint Templates because Our PowerPoint Templates and Slides will give good value for money. They also have respect for the value of your time.Use these PowerPoint slides for presentations relating to Diagram, organization, arrow, graph, flowchart, brainstorming, concepts, research, workshop, leadership, isolated, cutout, business, blank, plan,yellow, vector, presentation, circle, scheme, newbusiness, gray, development, shape, connection, strategy, examining, color, empty, neat, multi colored ,ideas, design . The prominent colors used in the PowerPoint template are Yellow, Gray, Black. Put the audience firmly in your favour. Extract their appreciation with our Creative Marketing Concepts 6 Stages Hub Process Business Diagram Plan Strategy.
Circular Diagram Business Relation 4 Stages Ppt Writing Small Plan PowerPoint Slides
We present our circular diagram business relation 4 stages ppt writing small plan PowerPoint Slides.Present our Process and Flows PowerPoint Templates because Our PowerPoint Templates and Slides are designed to help you succeed. They have all the ingredients you need. Download and present our Flow Charts PowerPoint Templates because You can Inspire your team with our PowerPoint Templates and Slides. Let the force of your ideas flow into their minds. Use our Business PowerPoint Templates because You can Connect the dots. Fan expectations as the whole picture emerges. Download our Marketing PowerPoint Templates because It will mark the footprints of your journey. Illustrate how they will lead you to your desired destination. Download our Shapes PowerPoint Templates because Our PowerPoint Templates and Slides will let Your superior ideas hit the target always and everytime.Use these PowerPoint slides for presentations relating to Diagram, label, flyer, website, bar, business, blank, tag, new, vector, sign, presentation, symbol, circle, graphic, element, violet,shape, abstract, team, modern, box, illustration, connection, web, design, color, colorful, blue, text, tab, badge, tape, set, banner, style, sticker, announcement. The prominent colors used in the PowerPoint template are Red, Green, Blue. Change the face of your environment with our Circular Diagram Business Relation 4 Stages Ppt Writing Small Plan PowerPoint Slides. Bring in exciting changes with your ideas.
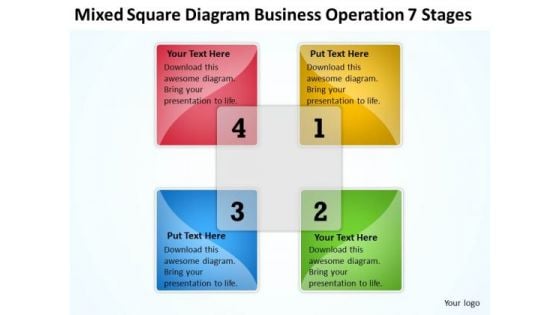
Mixed Square Diagram Business Operation 7 Stages Ppt Quick Plan PowerPoint Slides
We present our mixed square diagram business operation 7 stages ppt quick plan PowerPoint Slides.Present our Flow Charts PowerPoint Templates because Our PowerPoint Templates and Slides will let you Hit the right notes. Watch your audience start singing to your tune. Download our Business PowerPoint Templates because Our PowerPoint Templates and Slides will Activate the energies of your audience. Get their creative juices flowing with your words. Use our Process and Flows PowerPoint Templates because It is Aesthetically crafted by artistic young minds. Our PowerPoint Templates and Slides are designed to display your dexterity. Download our Shapes PowerPoint Templates because Our PowerPoint Templates and Slides will give you great value for your money. Be assured of finding the best projection to highlight your words. Download and present our Success PowerPoint Templates because Our PowerPoint Templates and Slides will Activate the energies of your audience. Get their creative juices flowing with your words.Use these PowerPoint slides for presentations relating to Diagram, label, flyer, website, bar, business, blank, tag, new, vector, sign, presentation, symbol, circle, graphic, element, violet,shape, abstract, team, modern, illustration, connection, web, design, color, colorful, text, tab, badge, seven, empty, paper, set, banner, style, sticker, menu,background, site, announcement. The prominent colors used in the PowerPoint template are Green, Red, Yellow. Settle all feuds with your thoughts. Conflicts die down with our Mixed Square Diagram Business Operation 7 Stages Ppt Quick Plan PowerPoint Slides.
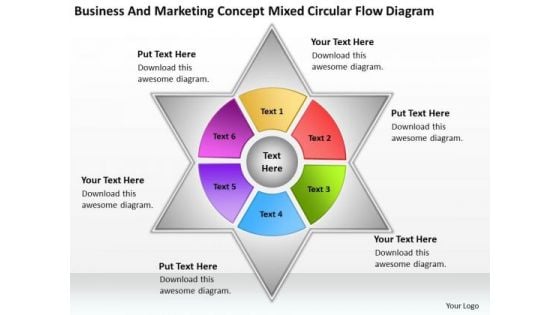
And Marketing Concept Mixed Circular Flow Diagram What Is Business Plan PowerPoint Templates
We present our and marketing concept mixed circular flow diagram what is business plan PowerPoint templates.Use our Flow Charts PowerPoint Templates because It will Raise the bar of your Thoughts. They are programmed to take you to the next level. Download and present our Process and Flows PowerPoint Templates because It is Aesthetically crafted by artistic young minds. Our PowerPoint Templates and Slides are designed to display your dexterity. Download and present our Marketing PowerPoint Templates because Our PowerPoint Templates and Slides will help you be quick off the draw. Just enter your specific text and see your points hit home. Download and present our Success PowerPoint Templates because You have a driving passion to excel in your field. Our PowerPoint Templates and Slides will prove ideal vehicles for your ideas. Download our Shapes PowerPoint Templates because It is Aesthetically crafted by artistic young minds. Our PowerPoint Templates and Slides are designed to display your dexterity.Use these PowerPoint slides for presentations relating to Diagram, banner, website, cross, square, model, form, order, business, concept, vector, cube, bright, symbol, brochure, match, guide, usable, graphic,element, marketing, different, idea, shape, abstract, cycle, creative, box, illustration, piece, connection, strategy, place, shade, frame, web, solution, design, group,color, colorful, art, part, arrows. The prominent colors used in the PowerPoint template are Green, Yellow, Blue. Catapult your thoughts with our And Marketing Concept Mixed Circular Flow Diagram What Is Business Plan PowerPoint Templates. They will travel a great distance.
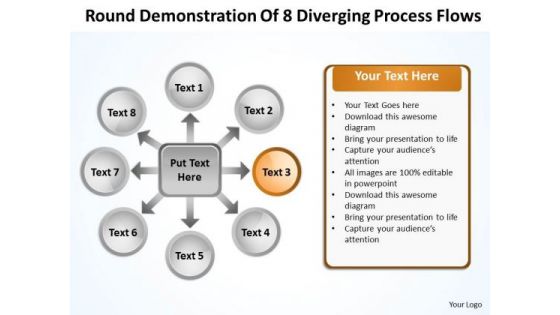
Round Demonstration Of 8 Diverging Process Flows Target Diagram PowerPoint Slides
We present our round demonstration of 8 diverging process flows Target Diagram PowerPoint Slides.Download our Flow Charts PowerPoint Templates because it helps you to inform your team of your innovative ideas. Download and present our Success PowerPoint Templates because it Saves your time as a prized possession, an ideal aid to give an ideal presentation. Download our Shapes PowerPoint Templates because analyse your plans with equal sincerity. Download our Business PowerPoint Templates because this diagram can set an example to enthuse your team with the passion and fervour of your ideas. Present our Arrows PowerPoint Templates because they have fired the dreams of many fertile minds.Use these PowerPoint slides for presentations relating to Access, Arrow, Background, Bright, Business, Chart, Colorful, Concept, Connection, Creative, Design, Different, Graphic, Group, Idea, Illustration, Part, Process, Shape, Strategy, Symbol, Template, Usable, Vector, Web, Website. The prominent colors used in the PowerPoint template are Orange, Gray, White. People tell us our round demonstration of 8 diverging process flows Target Diagram PowerPoint Slides are topically designed to provide an attractive backdrop to any subject. People tell us our Concept PowerPoint templates and PPT Slides provide you with a vast range of viable options. Select the appropriate ones and just fill in your text. The feedback we get is that our round demonstration of 8 diverging process flows Target Diagram PowerPoint Slides are Elegant. Presenters tell us our Colorful PowerPoint templates and PPT Slides are Royal. Customers tell us our round demonstration of 8 diverging process flows Target Diagram PowerPoint Slides are Majestic. The feedback we get is that our Chart PowerPoint templates and PPT Slides are designed by a team of presentation professionals. Coordinate teams with our Round Demonstration Of 8 Diverging Process Flows Target Diagram PowerPoint Slides. Download without worries with our money back guaranteee.
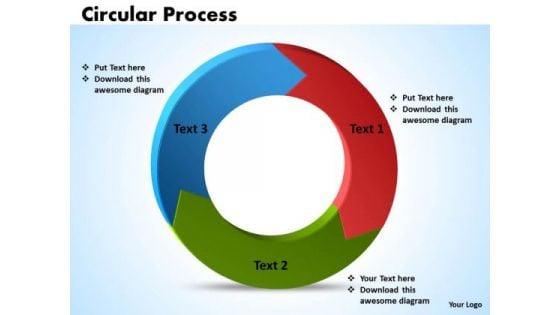
Ppt Circular Procurement Process PowerPoint Presentation Cycle Diagram 3 Stages Templates
PPT circular procurement process powerpoint presentation cycle diagram 3 stages Templates-Use this Circular based PowerPoint Diagram to represent three different approaches combined to form a single Process. It portrays the concept of convert, reclaim, recondition, recover, recycle , redeem, regenerate, remodel, reoccupy, repossess, rescue, restore, retake, salvage etc.-PPT circular procurement process powerpoint presentation cycle diagram 3 stages Templates-Abstract, Around, Arrow, Arrow Circle Diagram, Arrow Circles, Chart, Circle, Circle Diagram, Circular, Circular Arrows, Circular Flow, Circulation, Color, Cycle, Cycle Arrows, Cyclic, Diagram, Direction, Element, Five, Flow, Four, Glossy, Illustration, Motion, Movement, Process, Process Diagram, Refresh, Ring, Rotation, Round, Round Diagram, Section, Segment, Set, Shape, Sign, Symbol Our Ppt Circular Procurement Process PowerPoint Presentation Cycle Diagram 3 Stages Templates need no exaggeration. They are an advertisement for themselves.
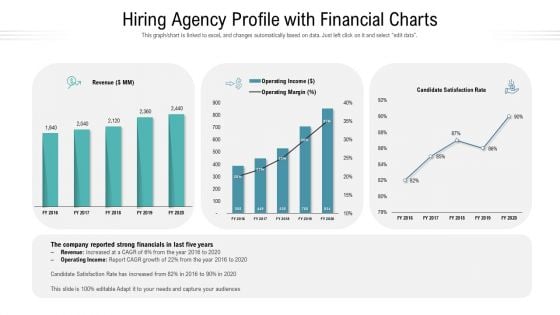
Hiring Agency Profile With Financial Charts Ppt Model Example PDF
This graph or chart is linked to excel, and changes automatically based on data. Just left click on it and select edit data. Pitch your topic with ease and precision using this hiring agency profile with financial charts ppt model example pdf. This layout presents information on revenue, operating income, operating margin, satisfaction rate. It is also available for immediate download and adjustment. So, changes can be made in the color, design, graphics or any other component to create a unique layout.
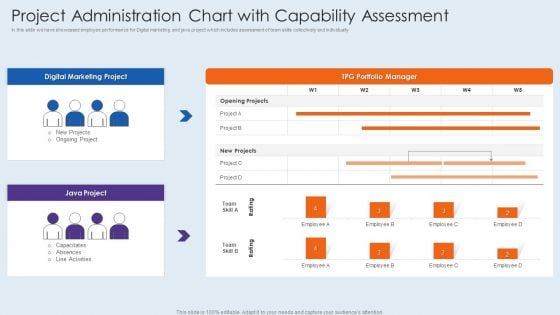
Project Administration Chart With Capability Assessment Elements PDF
In this slide we have showcased employee performance for Digital marketing and java project which includes assessment of team skills collectively and individually. Showcasing this set of slides titled project administration chart with capability assessment elements pdf. The topics addressed in these templates are project administration chart with capability assessment. All the content presented in this PPT design is completely editable. Download it and make adjustments in color, background, font etc. as per your unique business setting.
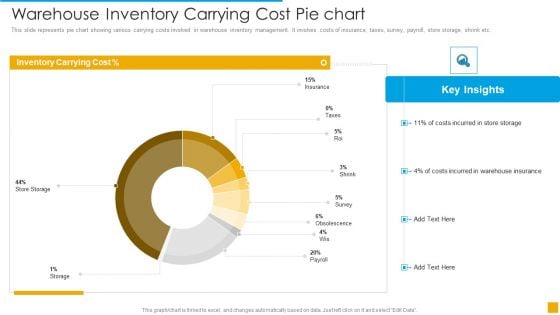
Warehouse Inventory Carrying Cost Pie Chart Demonstration PDF
This slide represents pie chart showing various carrying costs involved in warehouse inventory management. It involves costs of insurance, taxes, survey, payroll, store storage, shrink etc.Pitch your topic with ease and precision using this Warehouse Inventory Carrying Cost Pie Chart Demonstration PDF. This layout presents information on Cost, Inventory, Storage. It is also available for immediate download and adjustment. So, changes can be made in the color, design, graphics or any other component to create a unique layout.
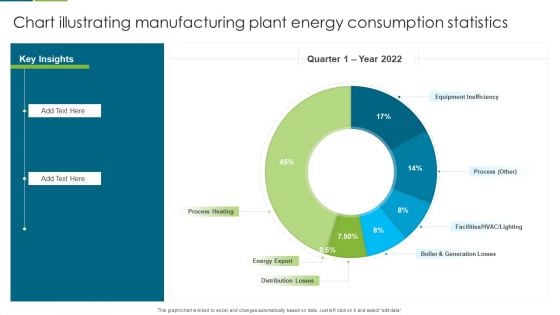
Chart Illustrating Manufacturing Plant Energy Consumption Statistics Slides PDF
This graph or chart is linked to excel, and changes automatically based on data. Just left click on it and select edit data. Pitch your topic with ease and precision using this Chart Illustrating Manufacturing Plant Energy Consumption Statistics Slides PDF. This layout presents information on Equipment Inefficiency, Process Heating, Energy Export. It is also available for immediate download and adjustment. So, changes can be made in the color, design, graphics or any other component to create a unique layout.
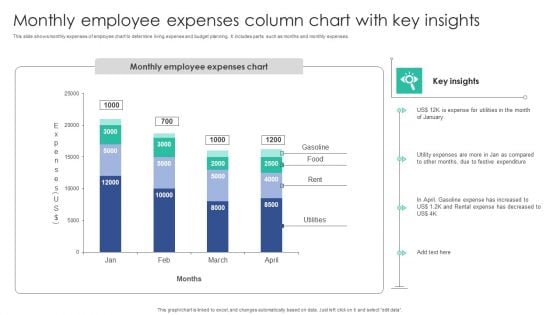
Monthly Employee Expenses Column Chart With Key Insights Download PDF
This slide shows monthly expenses of employee chart to determine living expense and budget planning. It includes parts such as months and monthly expenses.Showcasing this set of slides titled Monthly Employee Expenses Column Chart With Key Insights Download PDF. The topics addressed in these templates are Expense Utilities, Festive Expenditure, Gasoline Expense. All the content presented in this PPT design is completely editable. Download it and make adjustments in color, background, font etc. as per your unique business setting.
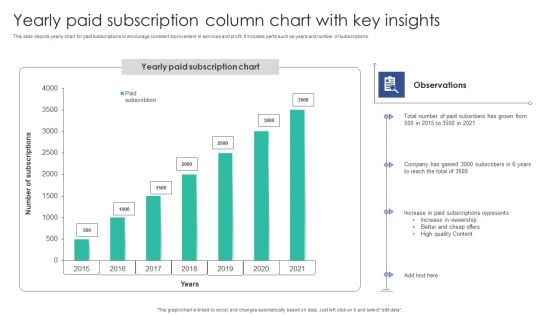
Yearly Paid Subscription Column Chart With Key Insights Microsoft PDF
This slide depicts yearly chart for paid subscriptions to encourage constant improvement in services and profit. It includes parts such as years and number of subscriptions.Showcasing this set of slides titled Yearly Paid Subscription Column Chart With Key Insights Microsoft PDF. The topics addressed in these templates are Paid Subscribers, Company Gained, Subscriptions Represents. All the content presented in this PPT design is completely editable. Download it and make adjustments in color, background, font etc. as per your unique business setting.

Digital Advertisement Spend Trend Chart By Industries Elements PDF
This slide depicts expenditure trends for digital advertising by top industries. It includes retail, automotive, financial services, telecom, consumer products, travel, healthcare, media, entertainment, etc. Showcasing this set of slides titled Digital Advertisement Spend Trend Chart By Industries Elements PDF. The topics addressed in these templates are Retail Sector, Total Budget, Chart By Industries. All the content presented in this PPT design is completely editable. Download it and make adjustments in color, background, font etc. as per your unique business setting.
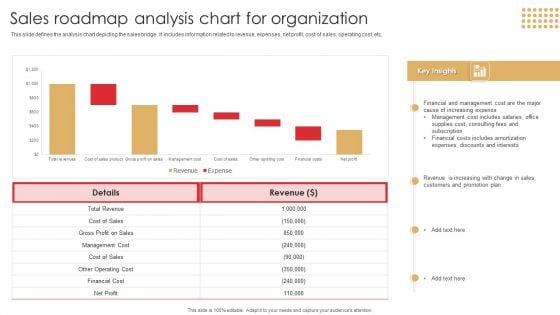
Sales Roadmap Analysis Chart For Organization Download PDF
This slide defines the analysis chart depicting the sales bridge . It includes information related to revenue, expenses, net profit, cost of sales, operating cost, etc.Showcasing this set of slides titled Sales Roadmap Analysis Chart For Organization Download PDF. The topics addressed in these templates are Management Cost, Financial Cost, Includes Amortization. All the content presented in this PPT design is completely editable. Download it and make adjustments in color, background, font etc. as per your unique business setting.
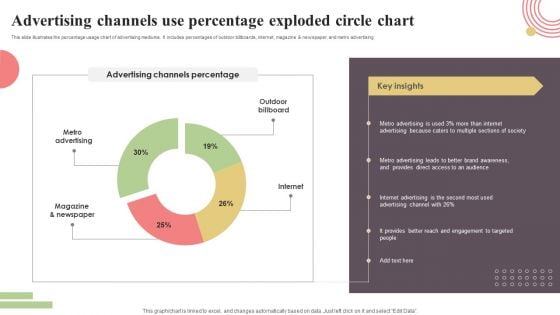
Advertising Channels Use Percentage Exploded Circle Chart Sample PDF
This slide illustrates the percentage usage chart of advertising mediums. It includes percentages of outdoor billboards, internet, magazine and newspaper, and metro advertising. Showcasing this set of slides titled Advertising Channels Use Percentage Exploded Circle Chart Sample PDF. The topics addressed in these templates are Metro Advertising, Magazine And Newspaper, Internet, Outdoor, Billboard. All the content presented in this PPT design is completely editable. Download it and make adjustments in color, background, font etc. as per your unique business setting.
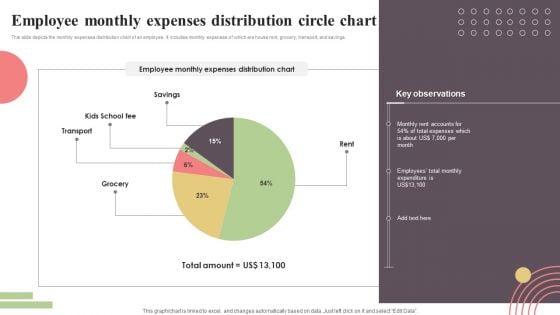
Employee Monthly Expenses Distribution Circle Chart Elements PDF
This slide depicts the monthly expenses distribution chart of an employee. It includes monthly expenses of which are house rent, grocery, transport, and savings. Showcasing this set of slides titled Employee Monthly Expenses Distribution Circle Chart Elements PDF. The topics addressed in these templates are Savings, Kids School Fee, Transport, Grocery, Rent. All the content presented in this PPT design is completely editable. Download it and make adjustments in color, background, font etc. as per your unique business setting.
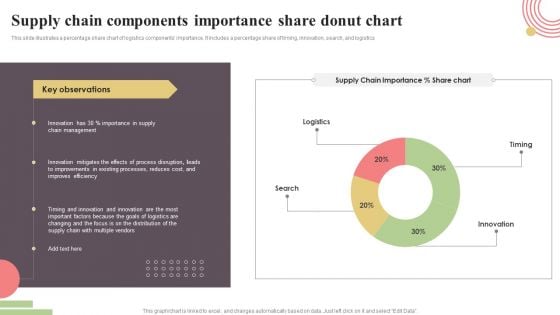
Supply Chain Components Importance Share Donut Chart Rules PDF
This slide illustrates a percentage share chart of logistics components importance. It includes a percentage share of timing, innovation, search, and logistics. Showcasing this set of slides titled Supply Chain Components Importance Share Donut Chart Rules PDF. The topics addressed in these templates are Timing, Innovation, Search, Logistics. All the content presented in this PPT design is completely editable. Download it and make adjustments in color, background, font etc. as per your unique business setting.
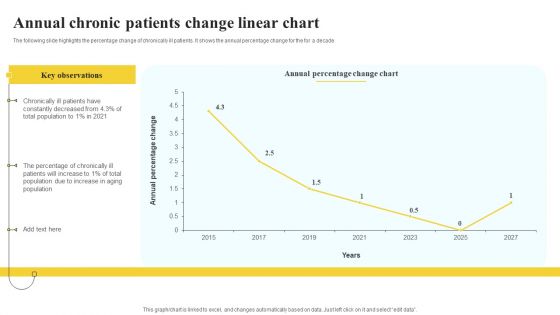
Annual Chronic Patients Change Linear Chart Demonstration PDF
The following slide highlights the percentage change of chronically ill patients. It shows the annual percentage change for the for a decade Showcasing this set of slides titled Annual Chronic Patients Change Linear Chart Demonstration PDF. The topics addressed in these templates are Key Observations, Annual Percentage, Linear Chart. All the content presented in this PPT design is completely editable. Download it and make adjustments in color, background, font etc. as per your unique business setting.
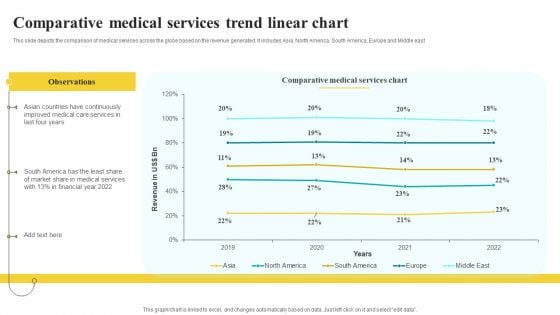
Comparative Medical Services Trend Linear Chart Mockup PDF
This slide depicts the comparison of medical services across the globe based on the revenue generated. It includes Asia, North America, South America, Europe and Middle east Showcasing this set of slides titled Comparative Medical Services Trend Linear Chart Mockup PDF. The topics addressed in these templates are Observations, Comparative Medical Services, Linear Chart. All the content presented in this PPT design is completely editable. Download it and make adjustments in color, background, font etc. as per your unique business setting.
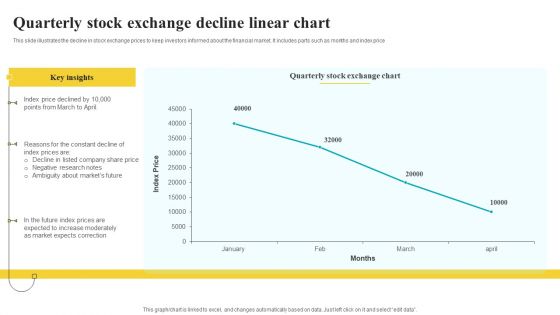
Quarterly Stock Exchange Decline Linear Chart Inspiration PDF
This slide illustrates the decline in stock exchange prices to keep investors informed about the financial market. It includes parts such as months and index price Pitch your topic with ease and precision using this Quarterly Stock Exchange Decline Linear Chart Inspiration PDF. This layout presents information on Key Insights, Exchange Chart, Correction. It is also available for immediate download and adjustment. So, changes can be made in the color, design, graphics or any other component to create a unique layout.
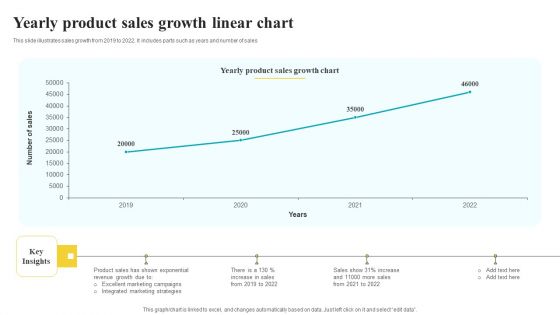
Yearly Product Sales Growth Linear Chart Pictures PDF
This slide illustrates sales growth from 2019 to 2022. It includes parts such as years and number of sales Pitch your topic with ease and precision using this Yearly Product Sales Growth Linear Chart Pictures PDF. This layout presents information on Sales Growth Chart, Key Insights, Strategies. It is also available for immediate download and adjustment. So, changes can be made in the color, design, graphics or any other component to create a unique layout.
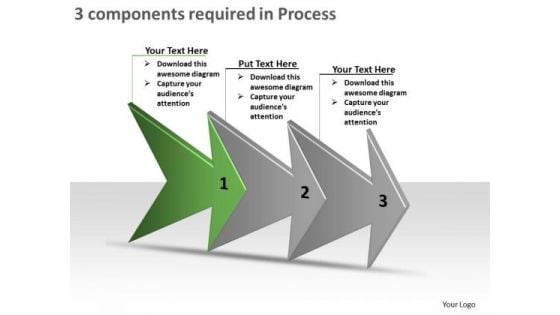
3 Components Required In Process Flow Chart Free PowerPoint Templates
We present our 3 components required in process flow chart free PowerPoint templates. Use our Marketing PowerPoint Templates because, illustrate your ideas one by one and demonstrate how each is an important cog in running the entire wheel. Use our Business PowerPoint Templates because; Reaffirm to your team your faith in maintaining the highest ethical standards. Use our Shapes PowerPoint Templates because, hence this diagram has the unique ability to drive home your ideas and show how they mesh to guarantee success. Use our Process and Flows PowerPoint Templates because, you have the product you are very confident of and are very sure it will prove immensely popular with clients all over your target areas. Use our Arrows PowerPoint Templates because, To achieve sure shot success they need to come together at the right time, place and manner. Use these PowerPoint slides for presentations relating to Advertising, arrow, background, banner, bookmark, choice, concept, creative, design, direction, flow, illustration, instruction, label, layout, manual, marketing, modern, next, offer, options, order, pointer, process, product, promotion, sequence, simple, special, symbol, template, tutorial, two, vector, version, website. The prominent colors used in the PowerPoint template are Green, Gray, and White Recommend plans with our 3 Components Required In Process Flow Chart Free PowerPoint Templates. Download without worries with our money back guaranteee.
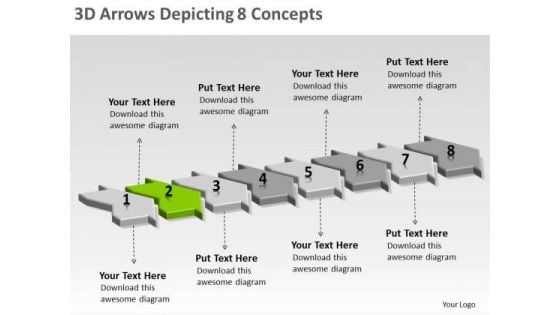
3d Arrows Depicting 8 Concepts Flow Chart Generator PowerPoint Templates
We present our 3d arrows depicting 8 concepts flow chart generator PowerPoint templates. Use our Marketing PowerPoint Templates because, It has inspired a whole new world of medical endeavor. Use our Business PowerPoint Templates because, Marketing Strategy Business Template:- Maximizing sales of your product is the intended destination. Use our Shapes PowerPoint Templates because, Profit fairly earned is what you believe in. Use our Process and Flows PowerPoint Templates because; Use them to your advantage to priorities your ideas. Use our Arrows PowerPoint Templates because, Hence this diagram has the unique ability to drive home your ideas and show how they mesh to guarantee success. Use these PowerPoint slides for presentations relating to Advertising, arrow, background, banner, bookmark, choice, concept, creative, design, direction, flow, illustration, instruction, label, layout, manual, marketing, modern, next, offer, options, order, pointer, process, product, promotion, sequence, simple, special, symbol, template, tutorial, two, vector, version, website. The prominent colors used in the PowerPoint template are Gray, White, and Green Equalize the equation with our 3d Arrows Depicting 8 Concepts Flow Chart Generator PowerPoint Templates. Get the audience on board with you.

 Home
Home