Oil Icons
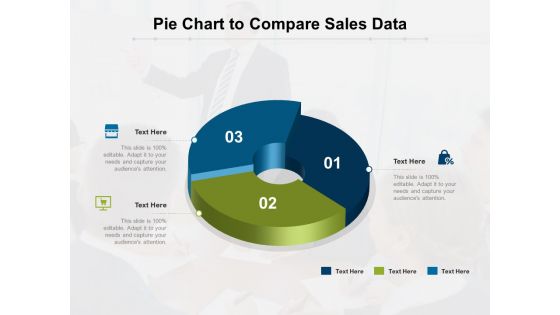
Pie Chart To Compare Sales Data Ppt PowerPoint Presentation Gallery Design Templates PDF
Showcasing this set of slides titled pie chart to compare sales data ppt powerpoint presentation gallery design templates pdf. The topics addressed in these templates are pie chart to compare sales data. All the content presented in this PPT design is completely editable. Download it and make adjustments in color, background, font etc. as per your unique business setting.
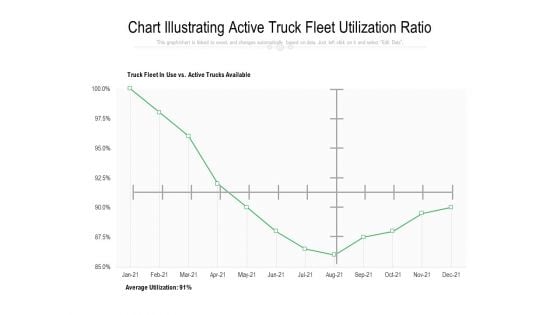
Chart Illustrating Active Truck Fleet Utilization Ratio Ppt PowerPoint Presentation Styles Graphics Pictures PDF
Pitch your topic with ease and precision using this chart illustrating active truck fleet utilization ratio ppt powerpoint presentation styles graphics pictures pdf. This layout presents information on chart illustrating active truck fleet utilization ratio. It is also available for immediate download and adjustment. So, changes can be made in the color, design, graphics or any other component to create a unique layout.
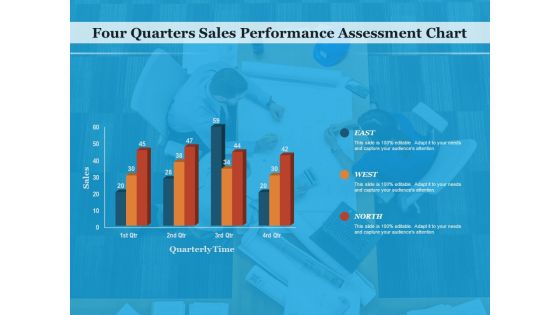
Four Quarters Sales Performance Assessment Chart Ppt PowerPoint Presentation Gallery Maker PDF
Showcasing this set of slides titled four quarters sales performance assessment chart ppt powerpoint presentation gallery maker pdf. The topics addressed in these templates are four quarters sales performance assessment chart. All the content presented in this PPT design is completely editable. Download it and make adjustments in color, background, font etc. as per your unique business setting.
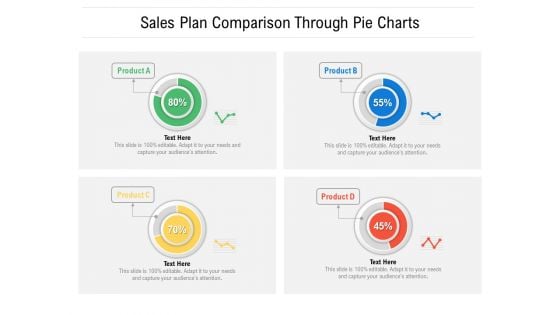
Sales Plan Comparison Through Pie Charts Ppt PowerPoint Presentation File Format Ideas PDF
Showcasing this set of slides titled sales plan comparison through pie charts ppt powerpoint presentation file format ideas pdf. The topics addressed in these templates are sales plan comparison through pie charts. All the content presented in this PPT design is completely editable. Download it and make adjustments in color, background, font etc. as per your unique business setting.

Stacked Bar Chart For Beverages Consumption Ppt PowerPoint Presentation File Mockup PDF
Showcasing this set of slides titled stacked bar chart for beverages consumption ppt powerpoint presentation file mockup pdf. The topics addressed in these templates are stacked bar chart for beverages consumption. All the content presented in this PPT design is completely editable. Download it and make adjustments in color, background, font etc. as per your unique business setting.

Two Products Comparison Stacked Chart Ppt PowerPoint Presentation Gallery Structure PDF
Pitch your topic with ease and precision using this two products comparison stacked chart ppt powerpoint presentation gallery structure pdf. This layout presents information on two products comparison stacked chart. It is also available for immediate download and adjustment. So, changes can be made in the color, design, graphics or any other component to create a unique layout.
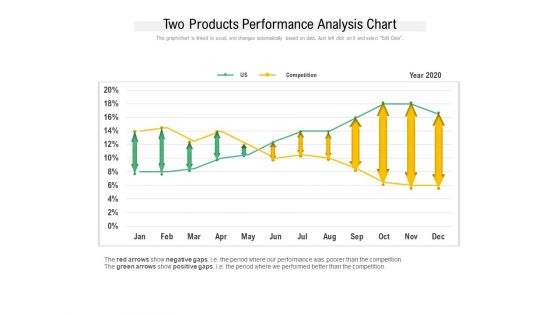
Two Products Performance Analysis Chart Ppt PowerPoint Presentation Layouts Aids PDF
Showcasing this set of slides titled two products performance analysis chart ppt powerpoint presentation layouts aids pdf. The topics addressed in these templates are competition, year 2020, two products performance, analysis chart. All the content presented in this PPT design is completely editable. Download it and make adjustments in color, background, font etc. as per your unique business setting.
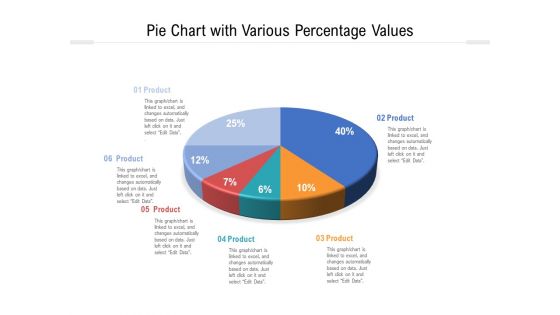
Pie Chart With Various Percentage Values Ppt PowerPoint Presentation Gallery Graphics Template PDF
Showcasing this set of slides titled pie chart with various percentage values ppt powerpoint presentation gallery graphics template pdf. The topics addressed in these templates are pie chart with various percentage values. All the content presented in this PPT design is completely editable. Download it and make adjustments in color, background, font etc. as per your unique business setting.
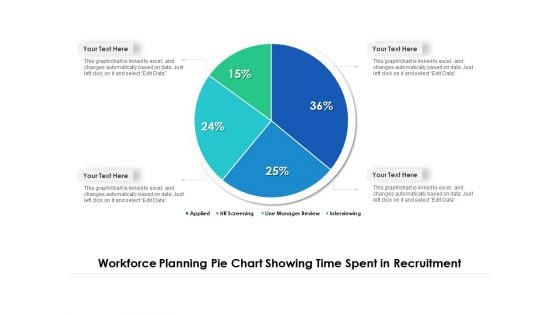
Workforce Planning Pie Chart Showing Time Spent In Recruitment Ppt PowerPoint Presentation Inspiration Information PDF
Showcasing this set of slides titled workforce planning pie chart showing time spent in recruitment ppt powerpoint presentation inspiration information pdf. The topics addressed in these templates are workforce planning pie chart showing time spent in recruitment. All the content presented in this PPT design is completely editable. Download it and make adjustments in color, background, font etc. as per your unique business setting.
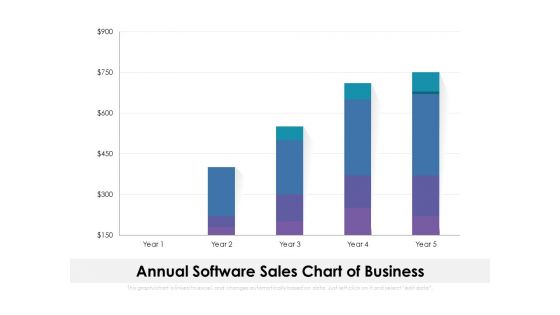
Annual Software Sales Chart Of Business Ppt PowerPoint Presentation File Example Topics PDF
Showcasing this set of slides titled annual software sales chart of business ppt powerpoint presentation file example topics pdf. The topics addressed in these templates are annual software sales chart of business. All the content presented in this PPT design is completely editable. Download it and make adjustments in color, background, font etc. as per your unique business setting.
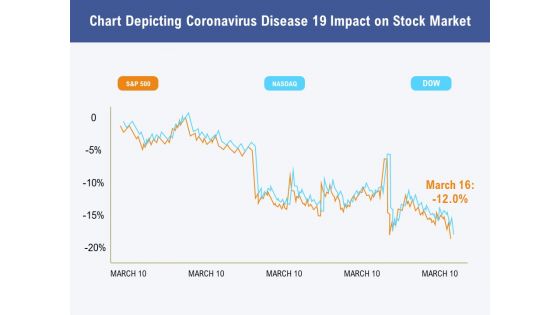
Chart Depicting Coronavirus Disease 19 Impact On Stock Market Ppt PowerPoint Presentation Inspiration Influencers PDF
Showcasing this set of slides titled chart depicting coronavirus disease 19 impact on stock market ppt powerpoint presentation inspiration influencers pdf. The topics addressed in these templates are chart depicting coronavirus disease 19 impact on stock market. All the content presented in this PPT design is completely editable. Download it and make adjustments in color, background, font etc. as per your unique business setting.
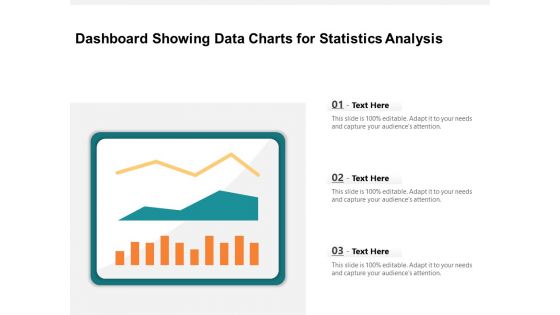
Dashboard Showing Data Charts For Statistics Analysis Ppt PowerPoint Presentation Infographic Template Grid PDF
Pitch your topic with ease and precision using this dashboard showing data charts for statistics analysis ppt powerpoint presentation infographic template grid pdf. This layout presents information on dashboard showing data charts for statistics analysis. It is also available for immediate download and adjustment. So, changes can be made in the color, design, graphics or any other component to create a unique layout.
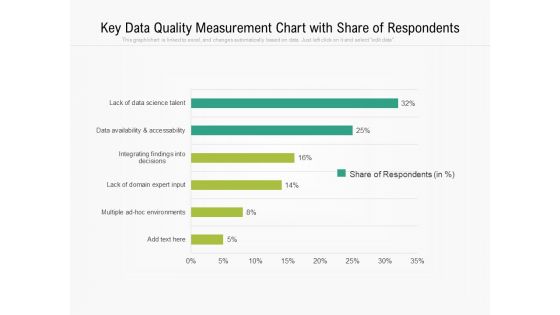
Key Data Quality Measurement Chart With Share Of Respondents Ppt PowerPoint Presentation Model Good PDF
Showcasing this set of slides titled key data quality measurement chart with share of respondents ppt powerpoint presentation model good pdf. The topics addressed in these templates are key data quality measurement chart with share of respondents. All the content presented in this PPT design is completely editable. Download it and make adjustments in color, background, font etc. as per your unique business setting.
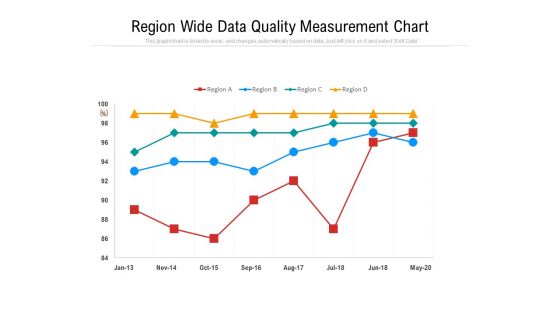
Region Wide Data Quality Measurement Chart Ppt PowerPoint Presentation Layouts Background Image PDF
Showcasing this set of slides titled region wide data quality measurement chart ppt powerpoint presentation layouts background image pdf. The topics addressed in these templates are region wide data quality measurement chart. All the content presented in this PPT design is completely editable. Download it and make adjustments in color, background, font etc. as per your unique business setting.
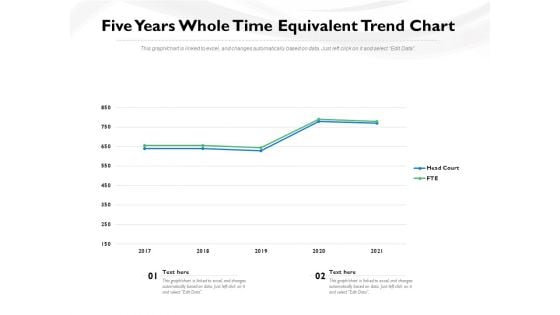
Five Years Whole Time Equivalent Trend Chart Ppt PowerPoint Presentation File Visuals PDF
Showcasing this set of slides titled five years whole time equivalent trend chart ppt powerpoint presentation file visuals pdf. The topics addressed in these templates are five years whole time equivalent trend chart. All the content presented in this PPT design is completely editable. Download it and make adjustments in color, background, font etc. as per your unique business setting.
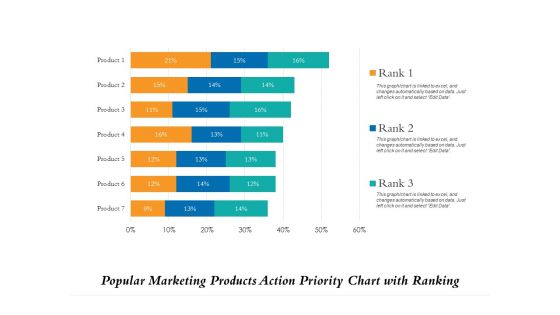
Popular Marketing Products Action Priority Chart With Ranking Ppt PowerPoint Presentation File Demonstration PDF
Pitch your topic with ease and precision using this popular marketing products action priority chart with ranking ppt powerpoint presentation file demonstration pdf. This layout presents information on popular marketing products action priority chart with ranking. It is also available for immediate download and adjustment. So, changes can be made in the color, design, graphics or any other component to create a unique layout.
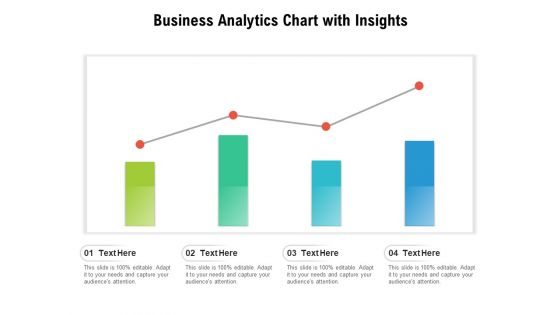
Business Analytics Chart With Insights Ppt PowerPoint Presentation Slides Guidelines PDF
Pitch your topic with ease and precision using this business analytics chart with insights ppt powerpoint presentation slides guidelines pdf. This layout presents information on business analytics chart with insights. It is also available for immediate download and adjustment. So, changes can be made in the color, design, graphics or any other component to create a unique layout.
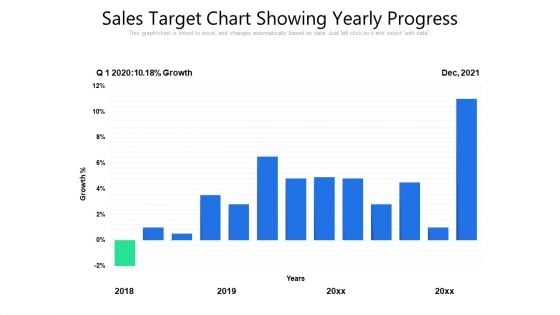
Sales Target Chart Showing Yearly Progress Ppt PowerPoint Presentation Gallery Vector PDF
Showcasing this set of slides titled sales target chart showing yearly progress ppt powerpoint presentation gallery vector pdf. The topics addressed in these templates are sales target chart showing yearly progress. All the content presented in this PPT design is completely editable. Download it and make adjustments in color, background, font etc. as per your unique business setting.
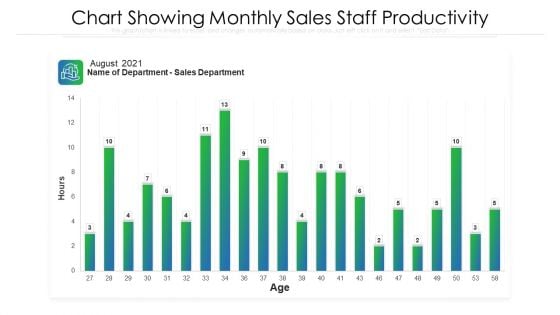
Chart Showing Monthly Sales Staff Productivity Ppt PowerPoint Presentation File Images PDF
Pitch your topic with ease and precision using this chart showing monthly sales staff productivity ppt powerpoint presentation file images pdf. This layout presents information on chart showing monthly sales staff productivity. It is also available for immediate download and adjustment. So, changes can be made in the color, design, graphics or any other component to create a unique layout.
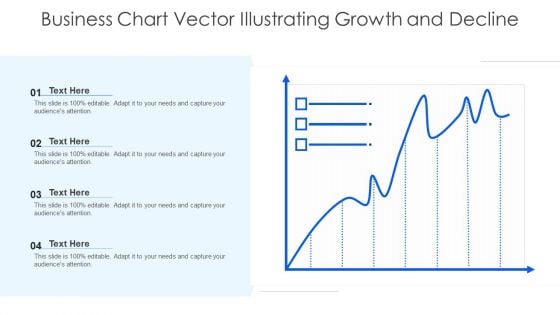
Business Chart Vector Illustrating Growth And Decline Ppt Pictures Deck PDF
Showcasing this set of slides titled business chart vector illustrating growth and decline ppt pictures deck pdf. The topics addressed in these templates are business chart vector illustrating growth and decline . All the content presented in this PPT design is completely editable. Download it and make adjustments in color, background, font etc. as per your unique business setting.

Business Profit Increase And Decrease Chart Due To Covid Ppt Templates PDF
Showcasing this set of slides titled business profit increase and decrease chart due to covid ppt templates pdf. The topics addressed in these templates are business profit increase and decrease chart due to covid. All the content presented in this PPT design is completely editable. Download it and make adjustments in color, background, font etc. as per your unique business setting.
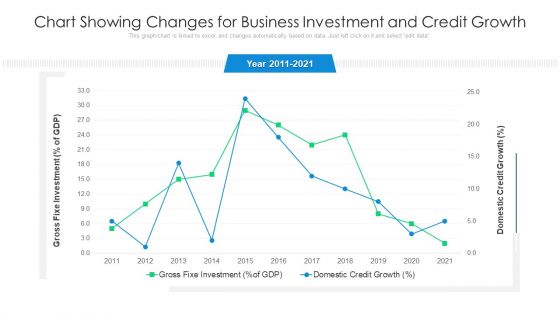
Chart Showing Changes For Business Investment And Credit Growth Ppt Infographic Template Slides PDF
Showcasing this set of slides titled chart showing changes for business investment and credit growth ppt infographic template slides pdf. The topics addressed in these templates are chart showing changes for business investment and credit growth. All the content presented in this PPT design is completely editable. Download it and make adjustments in color, background, font etc. as per your unique business setting.
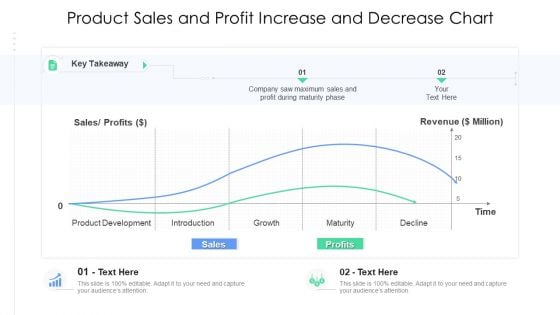
Product Sales And Profit Increase And Decrease Chart Ppt Show PDF
Pitch your topic with ease and precision using this product sales and profit increase and decrease chart ppt show pdf. This layout presents information on product sales and profit increase and decrease chart. It is also available for immediate download and adjustment. So, changes can be made in the color, design, graphics or any other component to create a unique layout.
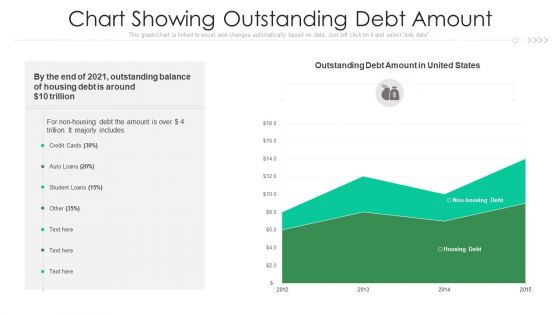
Chart Showing Outstanding Debt Amount Ppt PowerPoint Presentation Outline Background PDF
Pitch your topic with ease and precision using this chart showing outstanding debt amount ppt powerpoint presentation outline background pdf. This layout presents information on chart showing outstanding debt amount. It is also available for immediate download and adjustment. So, changes can be made in the color, design, graphics or any other component to create a unique layout.
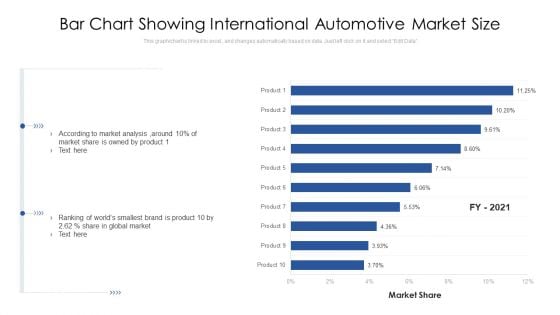
Bar Chart Showing International Automotive Market Size Ppt PowerPoint Presentation Gallery Templates PDF
Showcasing this set of slides titled bar chart showing international automotive market size ppt powerpoint presentation gallery templates pdf The topics addressed in these templates are bar chart showing international automotive market size. All the content presented in this PPT design is completely editable. Download it and make adjustments in color, background, font etc. as per your unique business setting.
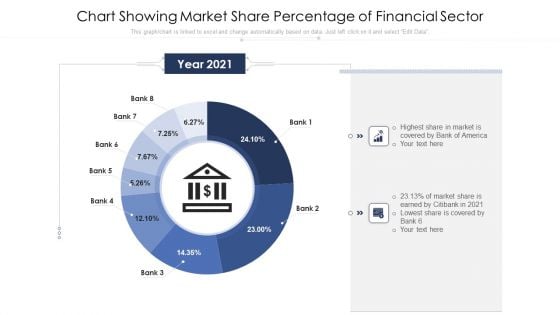
Chart Showing Market Share Percentage Of Financial Sector Ppt PowerPoint Presentation Show Guide PDF
Pitch your topic with ease and precision using this chart showing market share percentage of financial sector ppt powerpoint presentation show guide pdf. This layout presents information on chart showing market share percentage of financial sector. It is also available for immediate download and adjustment. So, changes can be made in the color, design, graphics or any other component to create a unique layout.
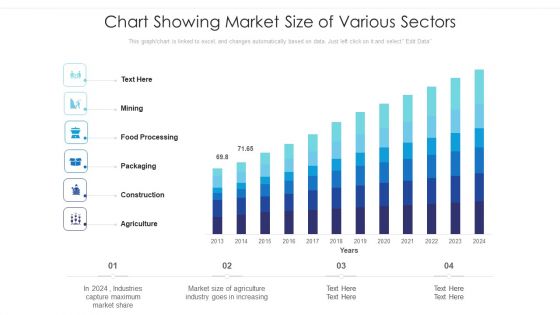
Chart Showing Market Size Of Various Sectors Ppt PowerPoint Presentation Pictures Background Image PDF
Showcasing this set of slides titled chart showing market size of various sectors ppt powerpoint presentation pictures background image pdf. The topics addressed in these templates are chart showing market size of various sectors. All the content presented in this PPT design is completely editable. Download it and make adjustments in color, background, font etc. as per your unique business setting.
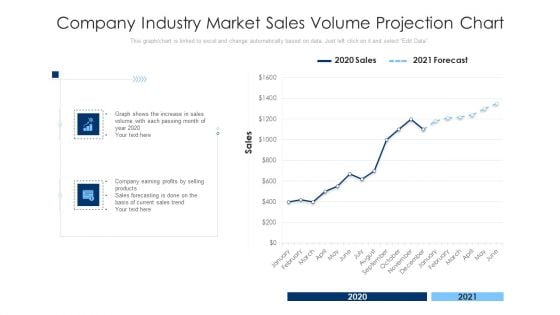
Company Industry Market Sales Volume Projection Chart Ppt PowerPoint Presentation Infographic Template Clipart PDF
Pitch your topic with ease and precision using this company industry market sales volume projection chart ppt powerpoint presentation infographic template clipart pdf. This layout presents information on company industry market sales volume projection chart. It is also available for immediate download and adjustment. So, changes can be made in the color, design, graphics or any other component to create a unique layout.
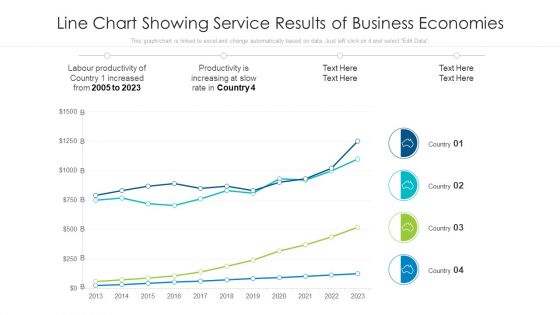
Line Chart Showing Service Results Of Business Economies Ppt PowerPoint Presentation Model Tips PDF
Pitch your topic with ease and precision using this line chart showing service results of business economies ppt powerpoint presentation model tips pdf. This layout presents information on line chart showing service results of business economies. It is also available for immediate download and adjustment. So, changes can be made in the color, design, graphics or any other component to create a unique layout.
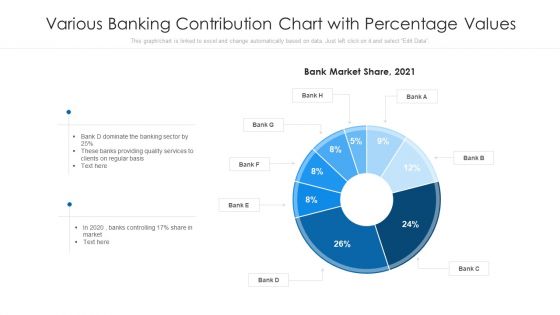
Various Banking Contribution Chart With Percentage Values Ppt PowerPoint Presentation Visual Aids Deck PDF
Pitch your topic with ease and precision using this various banking contribution chart with percentage values ppt powerpoint presentation visual aids deck pdf This layout presents information on various banking contribution chart with percentage values. It is also available for immediate download and adjustment. So, changes can be made in the color, design, graphics or any other component to create a unique layout.
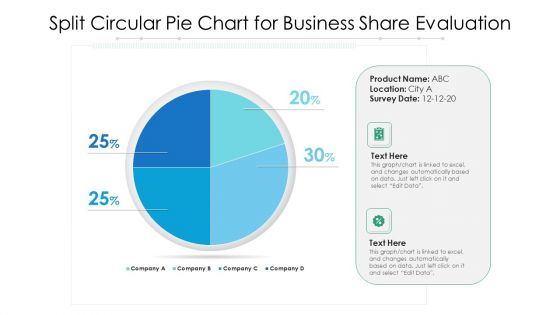
Split Circular Pie Chart For Business Share Evaluation Ppt PowerPoint Presentation Show Inspiration PDF
Showcasing this set of slides titled split circular pie chart for business share evaluation ppt powerpoint presentation show inspiration pdf. The topics addressed in these templates are split circular pie chart for business share evaluation. All the content presented in this PPT design is completely editable. Download it and make adjustments in color, background, font etc. as per your unique business setting.
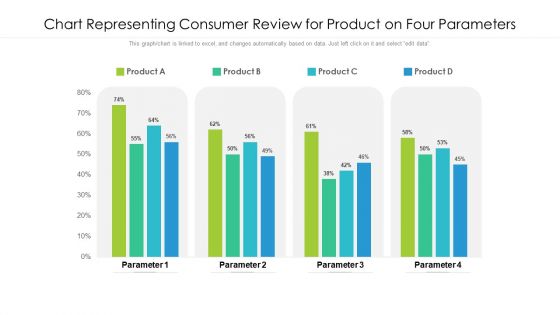
Chart Representing Consumer Review For Product On Four Parameters Ppt Layouts Pictures PDF
Showcasing this set of slides titled chart representing consumer review for product on four parameters ppt layouts pictures pdf. The topics addressed in these templates are chart representing consumer review for product on four parameters. All the content presented in this PPT design is completely editable. Download it and make adjustments in color, background, font etc. as per your unique business setting.
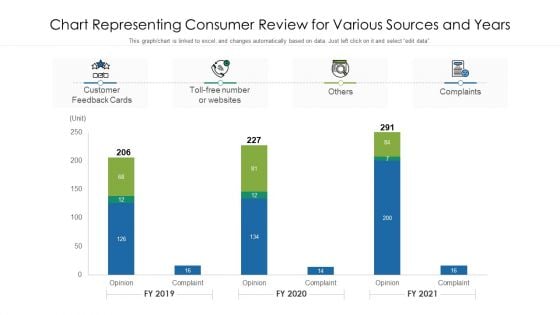
Chart Representing Consumer Review For Various Sources And Years Ppt Summary Background PDF
Pitch your topic with ease and precision using this chart representing consumer review for various sources and years ppt summary background pdf. This layout presents information on chart representing consumer review for various sources and years. It is also available for immediate download and adjustment. So, changes can be made in the color, design, graphics or any other component to create a unique layout.
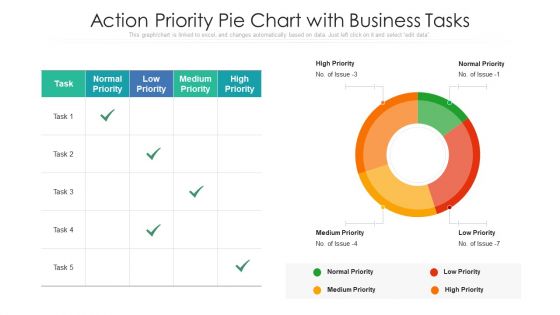
Action Priority Pie Chart With Business Tasks Ppt Professional Layouts PDF
Showcasing this set of slides titled action priority pie chart with business tasks ppt professional layouts pdf. The topics addressed in these templates are action priority pie chart with business tasks. All the content presented in this PPT design is completely editable. Download it and make adjustments in color, background, font etc. as per your unique business setting.
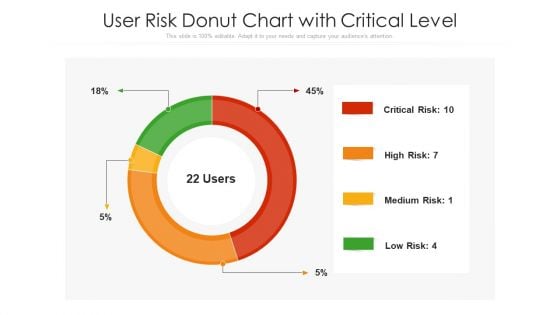
User Risk Donut Chart With Critical Level Ppt Portfolio Template PDF
Showcasing this set of slides titled user risk donut chart with critical level ppt portfolio template pdf. The topics addressed in these templates are user risk donut chart with critical level. All the content presented in this PPT design is completely editable. Download it and make adjustments in color, background, font etc. as per your unique business setting.
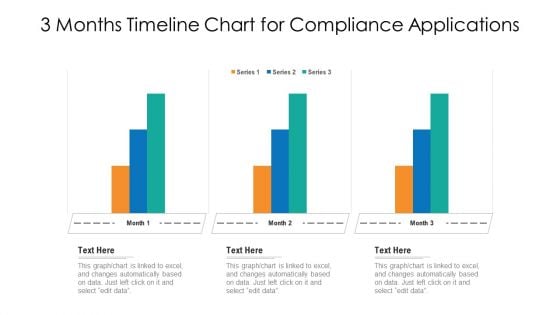
3 Months Timeline Chart For Compliance Applications Ppt PowerPoint Presentation File Professional PDF
Showcasing this set of slides titled 3 months timeline chart for compliance applications ppt powerpoint presentation file professional pdf. The topics addressed in these templates are 3 months timeline chart for compliance applications. All the content presented in this PPT design is completely editable. Download it and make adjustments in color, background, font etc. as per your unique business setting.
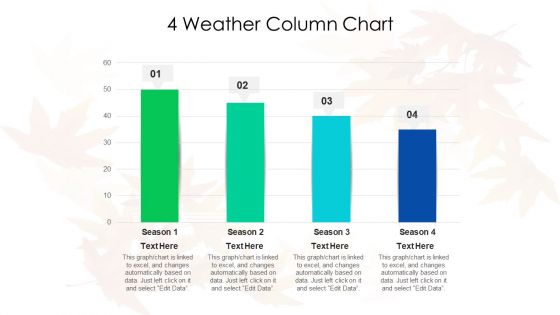
4 Weather Column Chart Ppt PowerPoint Presentation Gallery Design Ideas PDF
Showcasing this set of slides titled 4 weather column chart ppt powerpoint presentation gallery design ideas pdf. The topics addressed in these templates are 4 weather column chart. All the content presented in this PPT design is completely editable. Download it and make adjustments in color, background, font etc. as per your unique business setting.
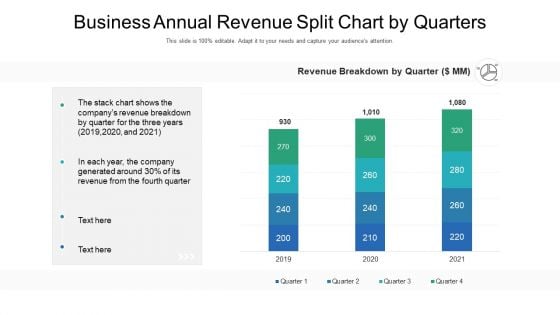
Business Annual Revenue Split Chart By Quarters Ppt PowerPoint Presentation Background Image PDF
Pitch your topic with ease and precision using this business annual revenue split chart by quarters ppt powerpoint presentation background image pdf. This layout presents information on business annual revenue split chart by quarters. It is also available for immediate download and adjustment. So, changes can be made in the color, design, graphics or any other component to create a unique layout.
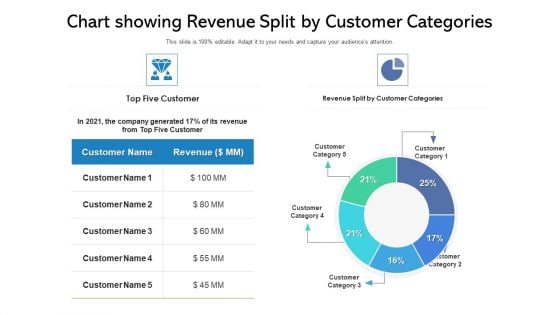
Chart Showing Revenue Split By Customer Categories Ppt PowerPoint Presentation Show Smartart PDF
Pitch your topic with ease and precision using this chart showing revenue split by customer categories ppt powerpoint presentation show smartart pdf. This layout presents information on chart showing revenue split by customer categories. It is also available for immediate download and adjustment. So, changes can be made in the color, design, graphics or any other component to create a unique layout.
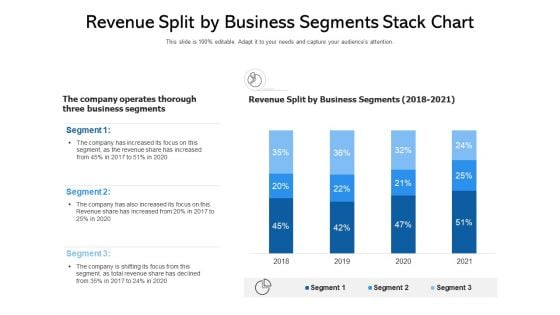
Revenue Split By Business Segments Stack Chart Ppt PowerPoint Presentation Ideas Sample PDF
Pitch your topic with ease and precision using this revenue split by business segments stack chart ppt powerpoint presentation ideas sample pdf. This layout presents information on revenue split by business segments stack chart. It is also available for immediate download and adjustment. So, changes can be made in the color, design, graphics or any other component to create a unique layout.
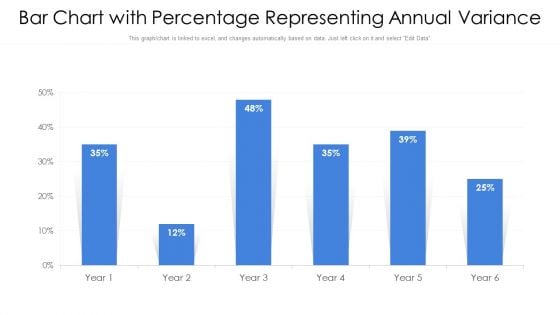
Bar Chart With Percentage Representing Annual Variance Ppt PowerPoint Presentation Gallery Portfolio PDF
Pitch your topic with ease and precision using this bar chart with percentage representing annual variance ppt powerpoint presentation gallery portfolio pdf. This layout presents information on bar chart with percentage representing annual variance. It is also available for immediate download and adjustment. So, changes can be made in the color, design, graphics or any other component to create a unique layout.
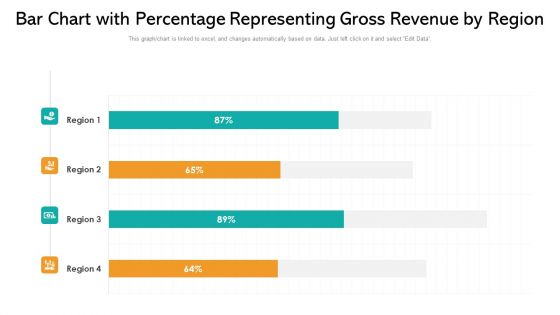
Bar Chart With Percentage Representing Gross Revenue By Region Ppt PowerPoint Presentation File Topics PDF
Showcasing this set of slides titled bar chart with percentage representing gross revenue by region ppt powerpoint presentation file topics pdf. The topics addressed in these templates are bar chart with percentage representing gross revenue by region. All the content presented in this PPT design is completely editable. Download it and make adjustments in color, background, font etc. as per your unique business setting.

Bar Chart With Percentage Representing Inventory Ppt PowerPoint Presentation File Outfit PDF
Pitch your topic with ease and precision using this bar chart with percentage representing inventory ppt powerpoint presentation file outfit pdf. This layout presents information on bar chart with percentage representing inventory. It is also available for immediate download and adjustment. So, changes can be made in the color, design, graphics or any other component to create a unique layout.
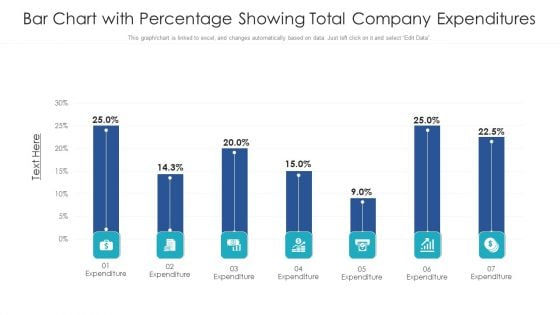
Bar Chart With Percentage Showing Total Company Expenditures Ppt PowerPoint Presentation File Background PDF
Pitch your topic with ease and precision using this bar chart with percentage showing total company expenditures ppt powerpoint presentation file background pdf. This layout presents information on bar chart with percentage showing total company expenditures. It is also available for immediate download and adjustment. So, changes can be made in the color, design, graphics or any other component to create a unique layout.
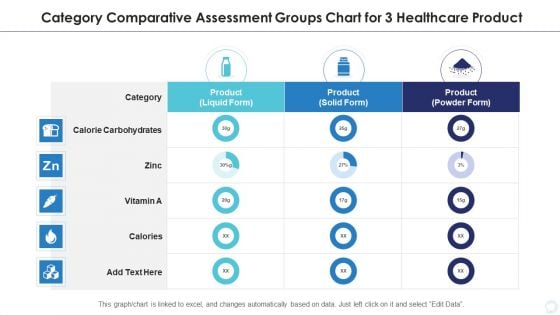
Category Comparative Assessment Groups Chart For 3 Healthcare Product Infographics PDF
Showcasing this set of slides titled category comparative assessment groups chart for 3 healthcare product infographics pdf. The topics addressed in these templates are category comparative assessment groups chart for 3 healthcare product. All the content presented in this PPT design is completely editable. Download it and make adjustments in color, background, font etc. as per your unique business setting.
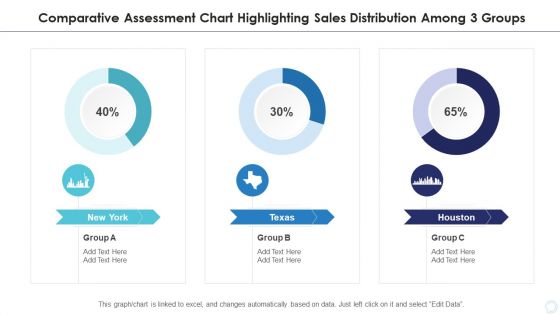
Comparative Assessment Chart Highlighting Sales Distribution Among 3 Groups Designs PDF
Pitch your topic with ease and precision using this comparative assessment chart highlighting sales distribution among 3 groups designs pdf. This layout presents information on comparative assessment chart highlighting sales distribution among 3 groups. It is also available for immediate download and adjustment. So, changes can be made in the color, design, graphics or any other component to create a unique layout.
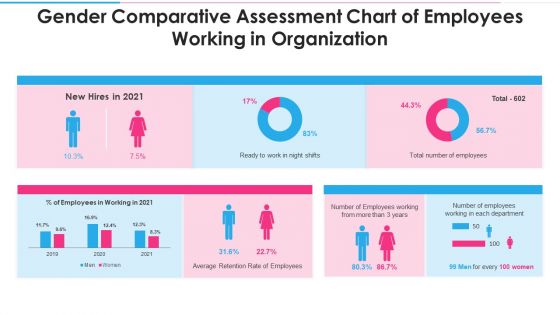
Gender Comparative Assessment Chart Of Employees Working In Organization Structure PDF
Showcasing this set of slides titled gender comparative assessment chart of employees working in organization structure pdf. The topics addressed in these templates are gender comparative assessment chart of employees working in organization. All the content presented in this PPT design is completely editable. Download it and make adjustments in color, background, font etc. as per your unique business setting.
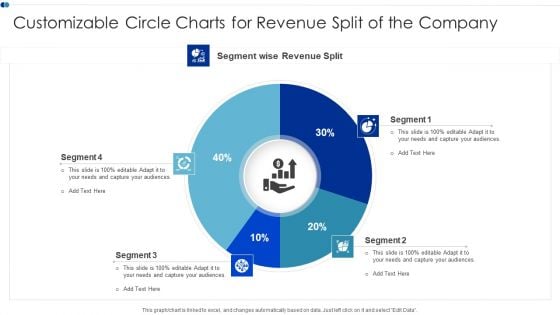
Customizable Circle Charts For Revenue Split Of The Company Graphics PDF
Showcasing this set of slides titled Customizable Circle Charts For Revenue Split Of The Company Graphics PDF The topics addressed in these templates are Customizable Circle, Charts Revenue, Split Company All the content presented in this PPT design is completely editable. Download it and make adjustments in color, background, font etc. as per your unique business setting.
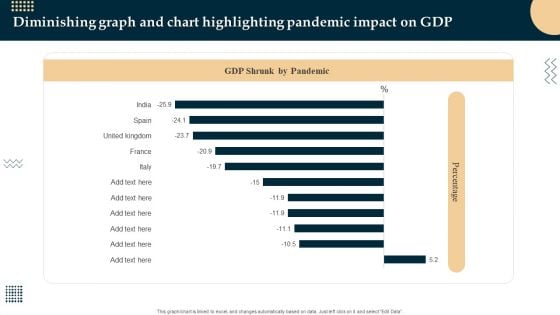
Diminishing Graph And Chart Highlighting Pandemic Impact On GDP Sample PDF
Pitch your topic with ease and precision using this Diminishing Graph And Chart Highlighting Pandemic Impact On GDP Sample PDF. This layout presents information on Diminishing Graph, Chart Highlighting Pandemic. It is also available for immediate download and adjustment. So, changes can be made in the color, design, graphics or any other component to create a unique layout.
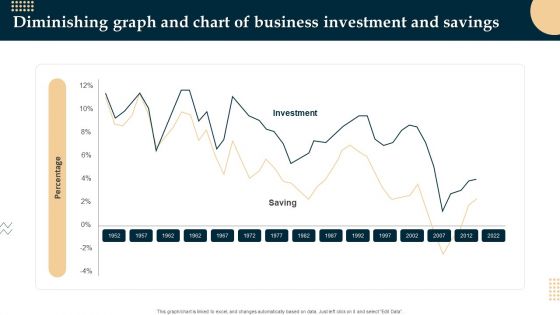
Diminishing Graph And Chart Of Business Investment And Savings Demonstration PDF
Showcasing this set of slides titled Diminishing Graph And Chart Of Business Investment And Savings Demonstration PDF. The topics addressed in these templates are Diminishing Graph, Chart Of Business Investment. All the content presented in this PPT design is completely editable. Download it and make adjustments in color, background, font etc. as per your unique business setting.
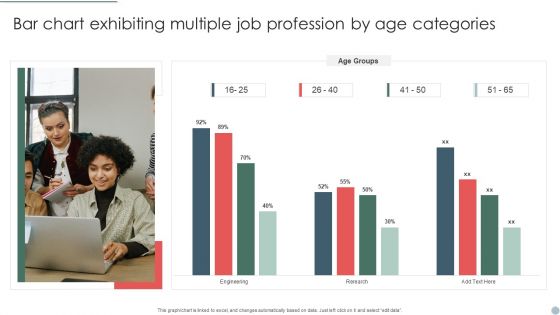
Bar Chart Exhibiting Multiple Job Profession By Age Categories Structure PDF
Showcasing this set of slides titled Bar Chart Exhibiting Multiple Job Profession By Age Categories Structure PDF. The topics addressed in these templates are Bar Chart Exhibiting, Multiple Job Profession, Age Categories. All the content presented in this PPT design is completely editable. Download it and make adjustments in color, background, font etc. as per your unique business setting.
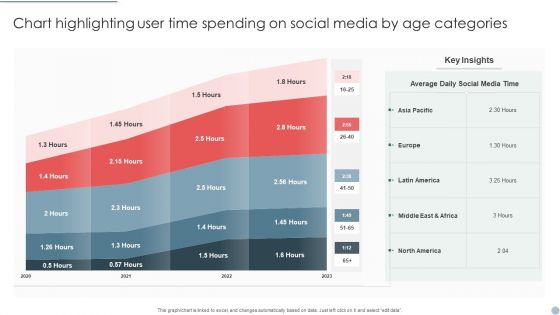
Chart Highlighting User Time Spending On Social Media By Age Categories Elements PDF
Showcasing this set of slides titled Chart Highlighting User Time Spending On Social Media By Age Categories Elements PDF. The topics addressed in these templates are Chart Highlighting User, Time Spending Social Media, Age Categories. All the content presented in this PPT design is completely editable. Download it and make adjustments in color, background, font etc. as per your unique business setting.
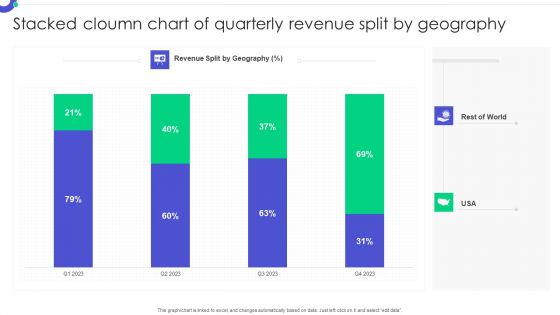
Stacked Cloumn Chart Of Quarterly Revenue Split By Geography Pictures PDF
Pitch your topic with ease and precision using this Stacked Cloumn Chart Of Quarterly Revenue Split By Geography Pictures PDF. This layout presents information on Stacked Column, Chart Quarterly, Revenue Split. It is also available for immediate download and adjustment. So, changes can be made in the color, design, graphics or any other component to create a unique layout.

Stacked Column Chart Of Revenue Split Of Cosmetic Products Mockup PDF
Showcasing this set of slides titled Stacked Column Chart Of Revenue Split Of Cosmetic Products Mockup PDF. The topics addressed in these templates are Stacked Column, Chart Revenue, Split Cosmetic Products. All the content presented in this PPT design is completely editable. Download it and make adjustments in color, background, font etc. as per your unique business setting.
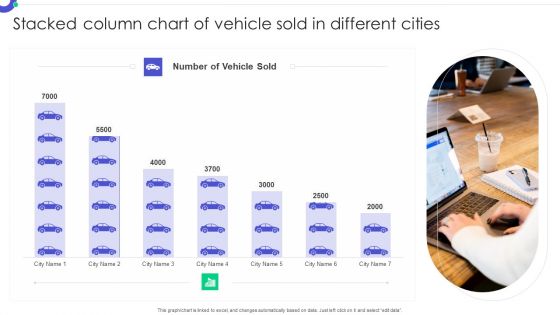
Stacked Column Chart Of Vehicle Sold In Different Cities Formats PDF
Pitch your topic with ease and precision using this Stacked Column Chart Of Vehicle Sold In Different Cities Formats PDF. This layout presents information on Stacked Column, Chart Vehicle, Sold Different Cities. It is also available for immediate download and adjustment. So, changes can be made in the color, design, graphics or any other component to create a unique layout.
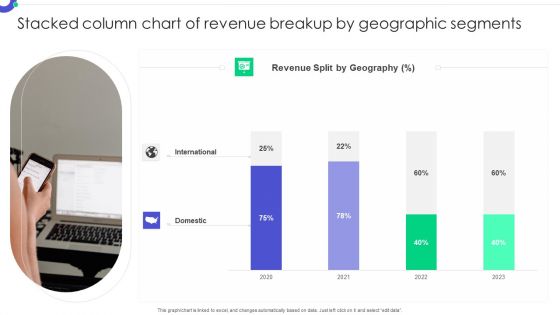
Stacked Column Chart Of Revenue Breakup By Geographic Segments Microsoft PDF
Showcasing this set of slides titled Stacked Column Chart Of Revenue Breakup By Geographic Segments Microsoft PDF. The topics addressed in these templates are Stacked Column, Chart Revenue, Breakup Geographic. All the content presented in this PPT design is completely editable. Download it and make adjustments in color, background, font etc. as per your unique business setting.
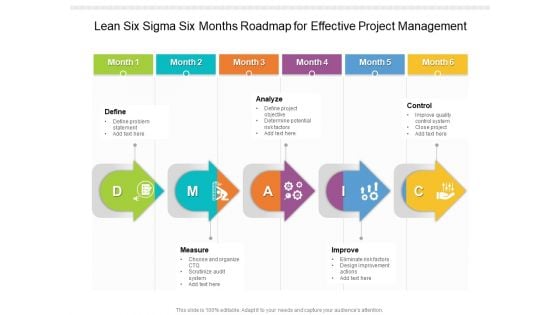
Lean Six Sigma Six Months Roadmap For Effective Project Management Diagrams
Presenting our jaw dropping lean six sigma six months roadmap for effective project management diagrams. You can alternate the color, font size, font type, and shapes of this PPT layout according to your strategic process. This PPT presentation is compatible with Google Slides and is available in both standard screen and widescreen aspect ratios. You can also download this well researched PowerPoint template design in different formats like PDF, JPG, and PNG. So utilize this visually appealing design by clicking the download button given below.
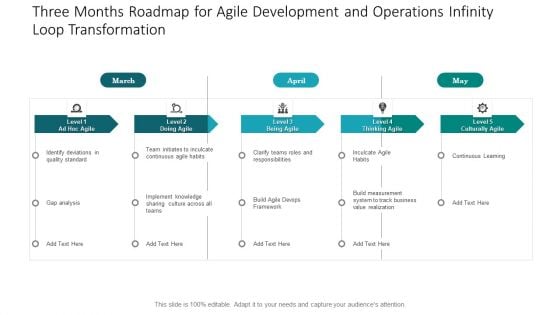
Three Months Roadmap For Agile Development And Operations Infinity Loop Transformation Diagrams
Presenting our jaw dropping three months roadmap for agile development and operations infinity loop transformation diagrams. You can alternate the color, font size, font type, and shapes of this PPT layout according to your strategic process. This PPT presentation is compatible with Google Slides and is available in both standard screen and widescreen aspect ratios. You can also download this well researched PowerPoint template design in different formats like PDF, JPG, and PNG. So utilize this visually appealing design by clicking the download button given below.
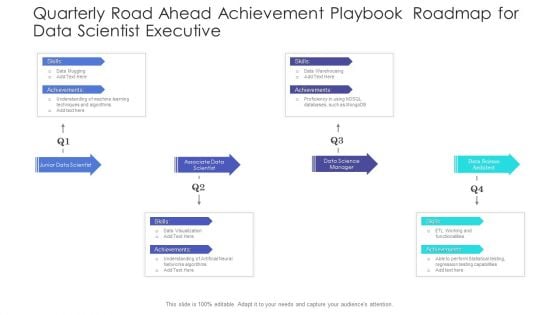
Quarterly Road Ahead Achievement Playbook Roadmap For Data Scientist Executive Diagrams
Presenting our jaw dropping quarterly road ahead achievement playbook roadmap for data scientist executive diagrams. You can alternate the color, font size, font type, and shapes of this PPT layout according to your strategic process. This PPT presentation is compatible with Google Slides and is available in both standard screen and widescreen aspect ratios. You can also download this well researched PowerPoint template design in different formats like PDF, JPG, and PNG. So utilize this visually appealing design by clicking the download button given below.
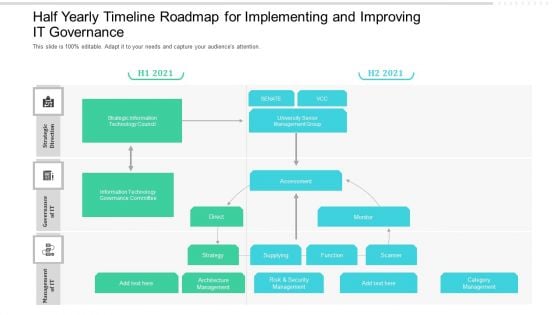
Half Yearly Timeline Roadmap For Implementing And Improving IT Governance Diagrams
Presenting our jaw dropping half yearly timeline roadmap for implementing and improving it governance diagrams. You can alternate the color, font size, font type, and shapes of this PPT layout according to your strategic process. This PPT presentation is compatible with Google Slides and is available in both standard screen and widescreen aspect ratios. You can also download this well researched PowerPoint template design in different formats like PDF, JPG, and PNG. So utilize this visually appealing design by clicking the download button given below.

 Home
Home