Oil Icons
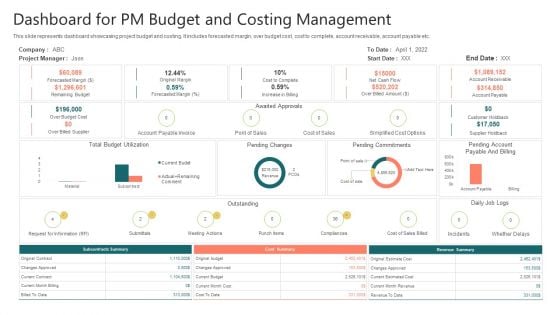
Dashboard For PM Budget And Costing Management Download PDF
This slide represents dashboard showcasing project budget and costing. It includes forecasted margin, over budget cost, cost to complete, account receivable, account payable etc. Showcasing this set of slides titled Dashboard For PM Budget And Costing Management Download PDF. The topics addressed in these templates are Original Margin, Cost To Complete, Account Payable. All the content presented in this PPT design is completely editable. Download it and make adjustments in color, background, font etc. as per your unique business setting.
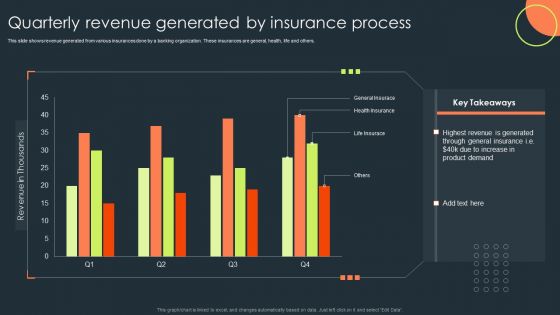
Quarterly Revenue Generated By Insurance Process Demonstration PDF
This slide shows revenue generated from various insurances done by a banking organization. These insurances are general, health, life and others. Pitch your topic with ease and precision using this Quarterly Revenue Generated By Insurance Process Demonstration PDF. This layout presents information on General Insurace, Health Insurance, Life Insurace. It is also available for immediate download and adjustment. So, changes can be made in the color, design, graphics or any other component to create a unique layout.
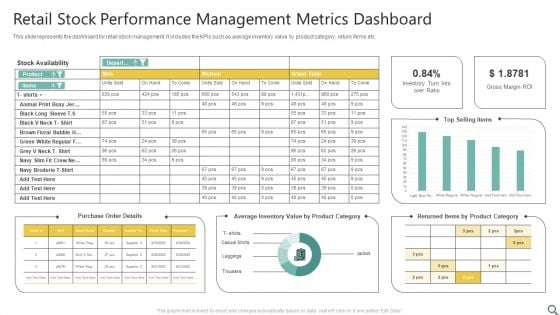
Retail Stock Performance Management Metrics Dashboard Ppt Professional Design Inspiration PDF
This slide represents the dashboard for retail stock management. It includes the KPIs such as average inventory value by product category, return items etc. Showcasing this set of slides titled Retail Stock Performance Management Metrics Dashboard Ppt Professional Design Inspiration PDF. The topics addressed in these templates are Stock Availability, Purchase Order Details, Top Selling Items. All the content presented in this PPT design is completely editable. Download it and make adjustments in color, background, font etc. as per your unique business setting.
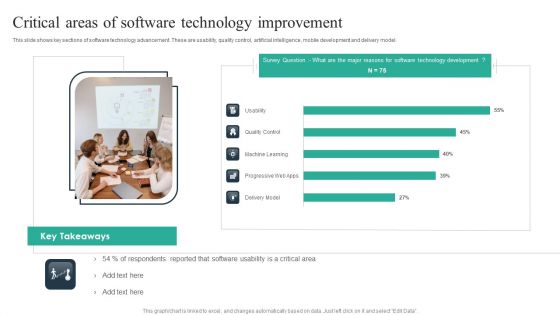
Critical Areas Of Software Technology Improvement Ppt Professional Infographics PDF
This slide shows key sections of software technology advancement. These are usability, quality control, artificial intelligence, mobile development and delivery model. Showcasing this set of slides titled Critical Areas Of Software Technology Improvement Ppt Professional Infographics PDF. The topics addressed in these templates are Usability, Quality Control, Machine Learning. All the content presented in this PPT design is completely editable. Download it and make adjustments in color, background, font etc. as per your unique business setting.
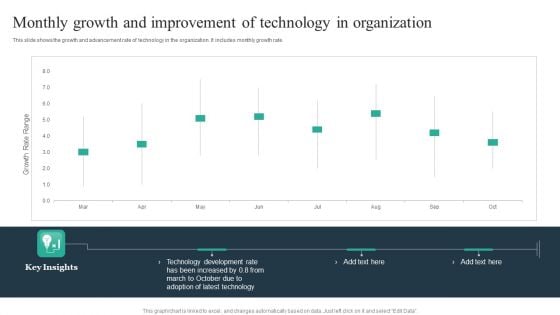
Monthly Growth And Improvement Of Technology In Organization Clipart PDF
This slide shows the growth and advancement rate of technology in the organization. It includes monthly growth rate. Showcasing this set of slides titled Monthly Growth And Improvement Of Technology In Organization Clipart PDF. The topics addressed in these templates are Technology, Development Rate, Key Insights. All the content presented in this PPT design is completely editable. Download it and make adjustments in color, background, font etc. as per your unique business setting.
Workforce Productivity Tracking Report Slide2 Professional PDF
The following slide highlights the KPIs of work streams to identify the threats and formulate strategies to mitigate its effect. It includes elements such as summary, health report etc. Pitch your topic with ease and precision using this Workforce Productivity Tracking Report Slide2 Professional PDF. This layout presents information on Sales, Issues, Budget, Workforce. It is also available for immediate download and adjustment. So, changes can be made in the color, design, graphics or any other component to create a unique layout.
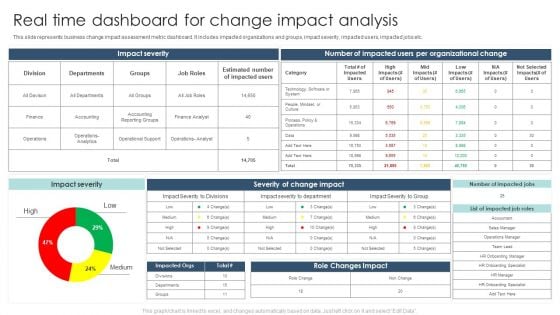
Real Time Dashboard For Change Impact Analysis Ppt Pictures Layouts PDF
This slide represents business change impact assessment metric dashboard. It includes impacted organizations and groups, impact severity, impacted users, impacted jobs etc. Pitch your topic with ease and precision using this Real Time Dashboard For Change Impact Analysis Ppt Pictures Layouts PDF. This layout presents information on Impact Severity, Role Changes Impact, High, Low, Medium. It is also available for immediate download and adjustment. So, changes can be made in the color, design, graphics or any other component to create a unique layout.
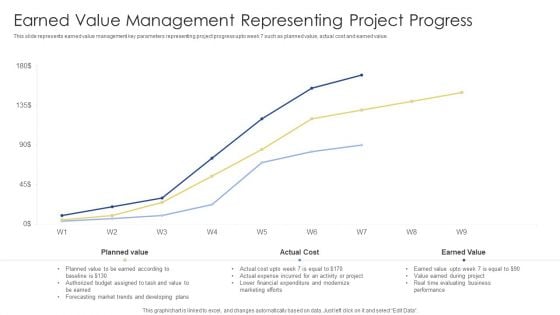
Earned Value Management Representing Project Progress Ppt Layouts Slide Portrait PDF
This slide represents earned value management key parameters representing project progress upto week 7 such as planned value, actual cost and earned value. Pitch your topic with ease and precision using this Earned Value Management Representing Project Progress Ppt Layouts Slide Portrait PDF. This layout presents information on Planned Value, Actual Cost, Earned Value. It is also available for immediate download and adjustment. So, changes can be made in the color, design, graphics or any other component to create a unique layout.
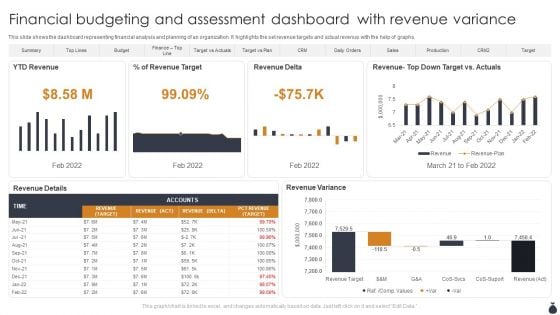
Financial Budgeting And Assessment Dashboard With Revenue Variance Designs PDF
This slide shows the dashboard representing financial analysis and planning of an organization. It highlights the set revenue targets and actual revenue with the help of graphs. Showcasing this set of slides titled Financial Budgeting And Assessment Dashboard With Revenue Variance Designs PDF. The topics addressed in these templates are YTD Revenue, Revenue Delta, Revenue Variance. All the content presented in this PPT design is completely editable. Download it and make adjustments in color, background, font etc. as per your unique business setting.
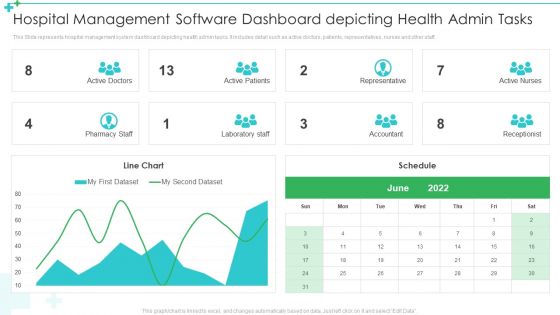
Hospital Management Software Dashboard Depicting Health Admin Tasks Ppt Pictures Inspiration PDF
This Slide represents hospital management system dashboard depicting health admin tasks. It includes detail such as active doctors, patients, representatives, nurses and other staff. Pitch your topic with ease and precision using this Hospital Management Software Dashboard Depicting Health Admin Tasks Ppt Pictures Inspiration PDF. This layout presents information on Active Doctors, Active Patients, Representative. It is also available for immediate download and adjustment. So, changes can be made in the color, design, graphics or any other component to create a unique layout.
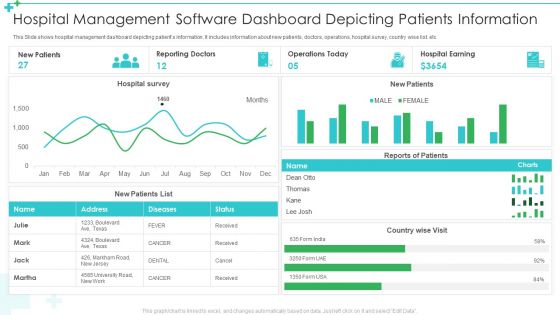
Hospital Management Software Dashboard Depicting Patients Information Ppt Layouts Skills PDF
This Slide shows hospital management dashboard depicting patients information. It includes information about new patients, doctors, operations, hospital survey, country wise list. etc. Showcasing this set of slides titled Hospital Management Software Dashboard Depicting Patients Information Ppt Layouts Skills PDF. The topics addressed in these templates are New Patients, Reporting Doctors, Operations Today. All the content presented in this PPT design is completely editable. Download it and make adjustments in color, background, font etc. as per your unique business setting.
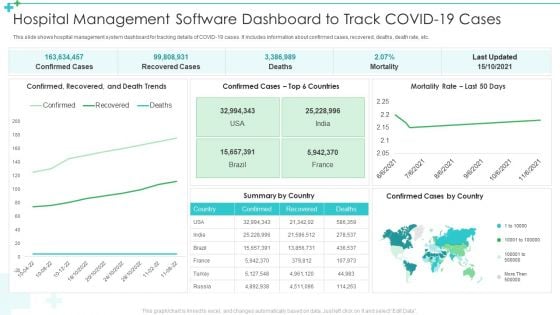
Hospital Management Software Dashboard To Track Covid 19 Cases Ppt Professional Inspiration PDF
This slide shows hospital management system dashboard for tracking details of COVID-19 cases. It includes information about confirmed cases, recovered, deaths, death rate, etc. Pitch your topic with ease and precision using this Hospital Management Software Dashboard To Track Covid 19 Cases Ppt Professional Inspiration PDF. This layout presents information on Recovered Cases, Deaths, Mortality. It is also available for immediate download and adjustment. So, changes can be made in the color, design, graphics or any other component to create a unique layout.
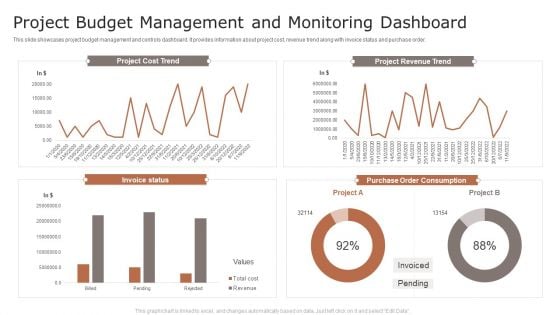
Project Budget Management And Monitoring Dashboard Ppt Portfolio Infographic Template PDF
This slide showcases project budget management and controls dashboard. It provides information about project cost, revenue trend along with invoice status and purchase order. Showcasing this set of slides titled Project Budget Management And Monitoring Dashboard Ppt Portfolio Infographic Template PDF. The topics addressed in these templates are Project Cost Trend, Project Revenue Trend, Invoice Status. All the content presented in this PPT design is completely editable. Download it and make adjustments in color, background, font etc. as per your unique business setting.
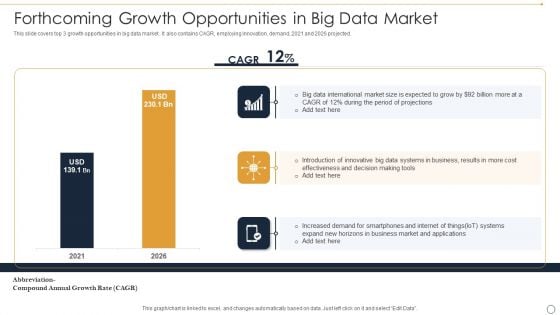
Forthcoming Growth Opportunities In Big Data Market Ppt Inspiration Brochure PDF
This slide covers top 3 growth opportunities in big data market . It also contains CAGR, employing innovation, demand, 2021 and 2026 projected. Showcasing this set of slides titled Forthcoming Growth Opportunities In Big Data Market Ppt Inspiration Brochure PDF. The topics addressed in these templates are Big Data International, Market Size, Period Projections. All the content presented in this PPT design is completely editable. Download it and make adjustments in color, background, font etc. as per your unique business setting.
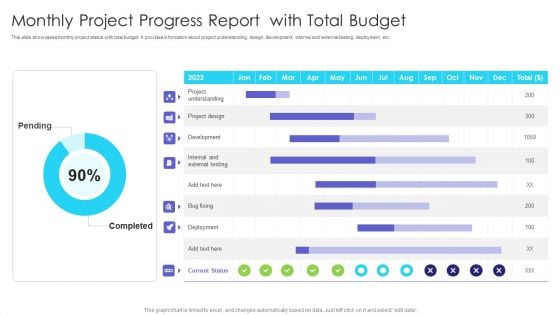
Monthly Project Progress Report With Total Budget Ppt Inspiration Shapes PDF
This slide showcases monthly project status with total budget. It provides information about project understanding, design, development, internal and external testing, deployment, etc. Pitch your topic with ease and precision using this Monthly Project Progress Report With Total Budget Ppt Inspiration Shapes PDF. This layout presents information on Pending, Completed, Project Understanding. It is also available for immediate download and adjustment. So, changes can be made in the color, design, graphics or any other component to create a unique layout.
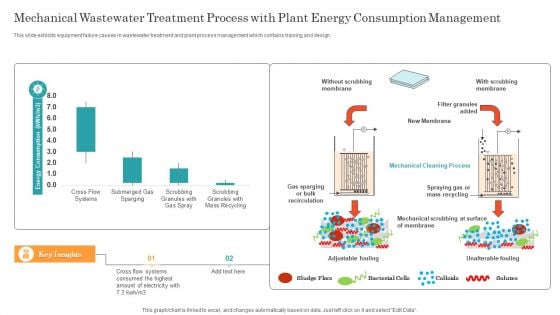
Mechanical Wastewater Treatment Process With Plant Energy Consumption Management Ppt Pictures File Formats PDF
This slide exhibits equipment failure causes in wastewater treatment and plant process management which contains training and design. Pitch your topic with ease and precision using this Mechanical Wastewater Treatment Process With Plant Energy Consumption Management Ppt Pictures File Formats PDF. This layout presents information on Cross Flow Systems, Mechanical Cleaning Process, New Membrane. It is also available for immediate download and adjustment. So, changes can be made in the color, design, graphics or any other component to create a unique layout.
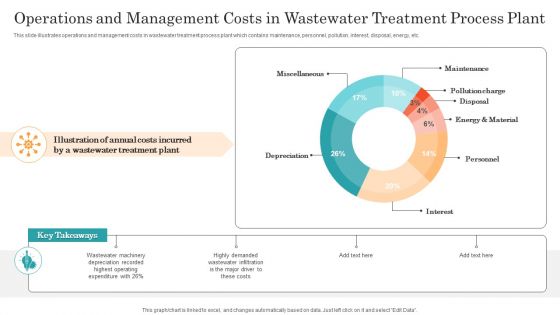
Operations And Management Costs In Wastewater Treatment Process Plant Ppt Pictures Graphics Download PDF
This slide illustrates operations and management costs in wastewater treatment process plant which contains maintenance, personnel, pollution, interest, disposal, energy, etc. Showcasing this set of slides titled Operations And Management Costs In Wastewater Treatment Process Plant Ppt Pictures Graphics Download PDF. The topics addressed in these templates are Miscellaneous, Maintenance, Pollution Charge, Interest. All the content presented in this PPT design is completely editable. Download it and make adjustments in color, background, font etc. as per your unique business setting.
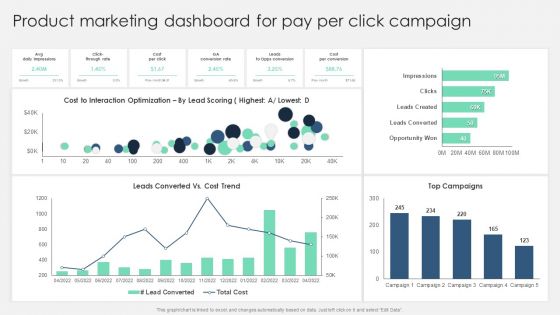
Product Marketing Dashboard For Pay Per Click Campaign Sample PDF
Take your projects to the next level with our ultimate collection of Product Marketing Dashboard For Pay Per Click Campaign Sample PDF. Slidegeeks has designed a range of layouts that are perfect for representing task or activity duration, keeping track of all your deadlines at a glance. Tailor these designs to your exact needs and give them a truly corporate look with your own brand colors they will make your projects stand out from the rest.
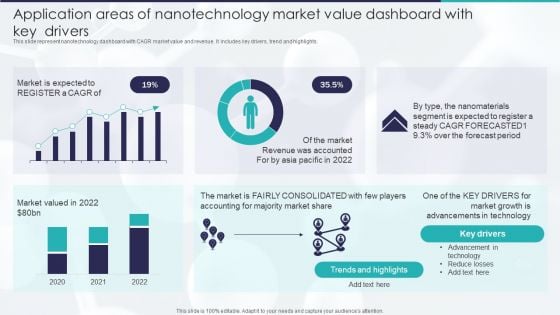
Application Areas Of Nanotechnology Market Value Dashboard With Key Drivers Topics PDF
This slide represent nanotechnology dashboard with CAGR market value and revenue. It includes key drivers, trend and highlights. Showcasing this set of slides titled Application Areas Of Nanotechnology Market Value Dashboard With Key Drivers Topics PDF. The topics addressed in these templates are Market Valued, Market Share, 2020 To 2022. All the content presented in this PPT design is completely editable. Download it and make adjustments in color, background, font etc. as per your unique business setting.
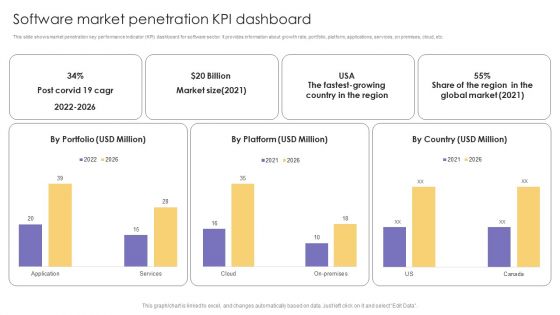
Software Market Penetration KPI Dashboard Ppt Outline Aids PDF
This slide shows market penetration key performance indicator KPI dashboard for software sector. It provides information about growth rate, portfolio, platform, applications, services, on premises, cloud, etc. Pitch your topic with ease and precision using this Software Market Penetration KPI Dashboard Ppt Outline Aids PDF. This layout presents information on Market Size, Global Market, Cloud. It is also available for immediate download and adjustment. So, changes can be made in the color, design, graphics or any other component to create a unique layout.
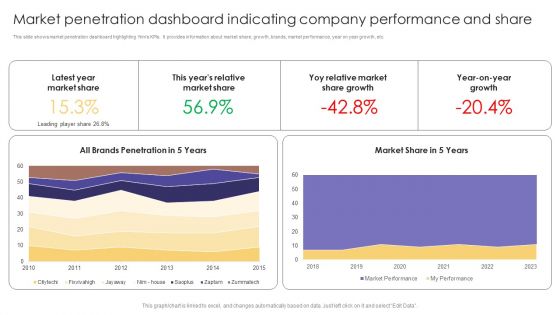
Market Penetration Dashboard Indicating Company Performance And Share Formats PDF
This slide shows market penetration dashboard highlighting firms KPIs. It provides information about market share, growth, brands, market performance, year on year growth, etc. Showcasing this set of slides titled Market Penetration Dashboard Indicating Company Performance And Share Formats PDF. The topics addressed in these templates are Latest Year, Market Share, Market Share Growth. All the content presented in this PPT design is completely editable. Download it and make adjustments in color, background, font etc. as per your unique business setting.
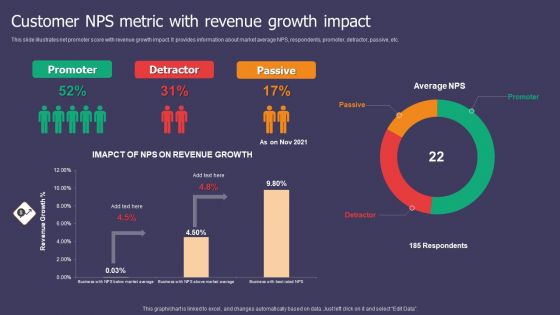
Customer NPS Metric With Revenue Growth Impact Ppt Show Portrait PDF
This slide illustrates net promoter score with revenue growth impact. It provides information about market average NPS, respondents, promoter, detractor, passive, etc. Pitch your topic with ease and precision using this Customer NPS Metric With Revenue Growth Impact Ppt Show Portrait PDF. This layout presents information on Promoter, Detractor, Passive. It is also available for immediate download and adjustment. So, changes can be made in the color, design, graphics or any other component to create a unique layout.
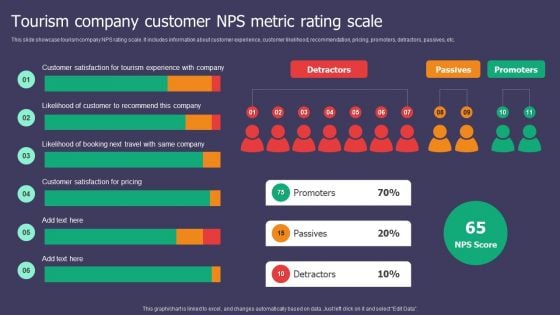
Tourism Company Customer NPS Metric Rating Scale Ppt Outline Format Ideas PDF
This slide showcase tourism company NPS rating scale. It includes information about customer experience, customer likelihood, recommendation, pricing, promoters, detractors, passives, etc. Showcasing this set of slides titled Tourism Company Customer NPS Metric Rating Scale Ppt Outline Format Ideas PDF. The topics addressed in these templates are Promoters, Passives, Detractors. All the content presented in this PPT design is completely editable. Download it and make adjustments in color, background, font etc. as per your unique business setting.
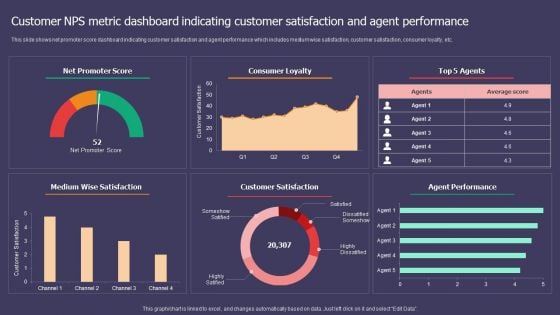
Customer NPS Metric Dashboard Indicating Customer Satisfaction And Agent Performance Template PDF
This slide shows net promoter score dashboard indicating customer satisfaction and agent performance which includes medium wise satisfaction, customer satisfaction, consumer loyalty, etc. Showcasing this set of slides titled Customer NPS Metric Dashboard Indicating Customer Satisfaction And Agent Performance Template PDF. The topics addressed in these templates are Net Promoter Score, Consumer Loyalty, Top 5 Agents. All the content presented in this PPT design is completely editable. Download it and make adjustments in color, background, font etc. as per your unique business setting.
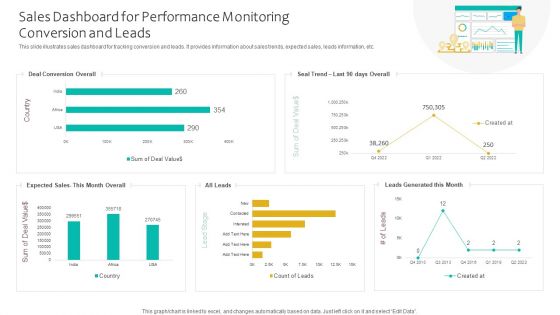
Sales Dashboard For Performance Monitoring Conversion And Leads Ppt Infographics Smartart PDF
This slide illustrates sales dashboard for tracking conversion and leads. It provides information about sales trends, expected sales, leads information, etc. Showcasing this set of slides titled Sales Dashboard For Performance Monitoring Conversion And Leads Ppt Infographics Smartart PDF. The topics addressed in these templates are Deal Conversion Overall, Expected Sales, Leads Generated. All the content presented in this PPT design is completely editable. Download it and make adjustments in color, background, font etc. as per your unique business setting.
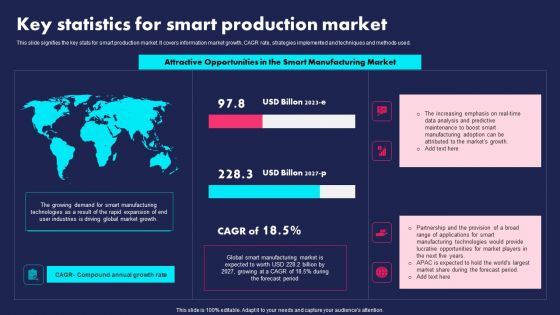
Key Statistics For Smart Production Market Ppt PowerPoint Presentation File Inspiration PDF
This slide signifies the key stats for smart production market. It covers information market growth, CAGR rate, strategies implemented and techniques and methods used. Showcasing this set of slides titled Key Statistics For Smart Production Market Ppt PowerPoint Presentation File Inspiration PDF. The topics addressed in these templates are Attractive Opportunities, Smart Manufacturing Market, Global. All the content presented in this PPT design is completely editable. Download it and make adjustments in color, background, font etc. as per your unique business setting.
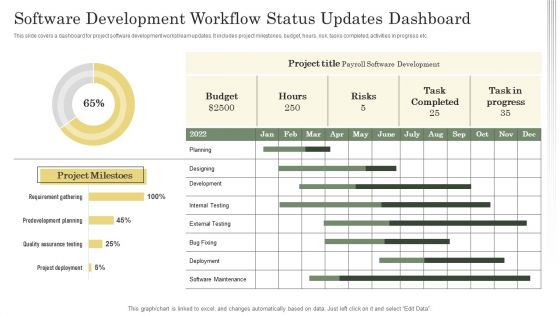
Software Development Workflow Status Updates Dashboard Ppt Gallery Slides PDF
This slide covers a dashboard for project software development workstream updates. It includes project milestones, budget, hours, risk, tasks completed, activities in progress etc. Showcasing this set of slides titled Software Development Workflow Status Updates Dashboard Ppt Gallery Slides PDF. The topics addressed in these templates are Project Milestones, Project Title, Planning. All the content presented in this PPT design is completely editable. Download it and make adjustments in color, background, font etc. as per your unique business setting.
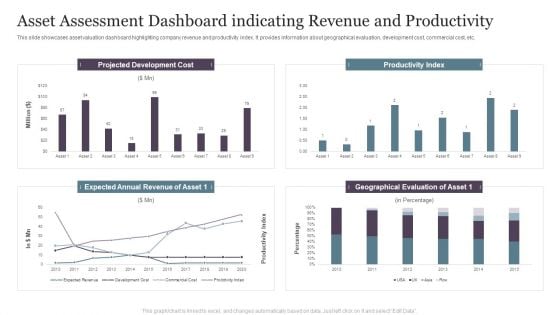
Asset Assessment Dashboard Indicating Revenue And Productivity Infographics PDF
This slide showcases asset valuation dashboard highlighting company revenue and productivity index. It provides information about geographical evaluation, development cost, commercial cost, etc.Pitch your topic with ease and precision using this Asset Assessment Dashboard Indicating Revenue And Productivity Infographics PDF. This layout presents information on Projected Development, Productivity Index, Geographical Evaluation. It is also available for immediate download and adjustment. So, changes can be made in the color, design, graphics or any other component to create a unique layout.

Asset Assessment Dashboard With Cash Flow And Market Value Summary PDF
This slide illustrates asset valuation dashboard with key financial metrics. It provides information about cash flow, market value, intrinsic value, assumptions, market cap, discount rate, etc.Showcasing this set of slides titled Asset Assessment Dashboard With Cash Flow And Market Value Summary PDF. The topics addressed in these templates are Discount Rate, Capital Expenditure, Market Capitalization. All the content presented in this PPT design is completely editable. Download it and make adjustments in color, background, font etc. as per your unique business setting.
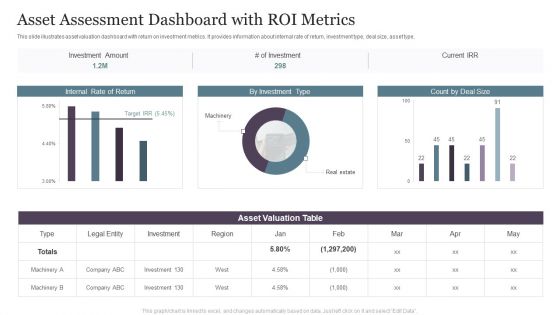
Asset Assessment Dashboard With ROI Metrics Topics PDF
This slide illustrates asset valuation dashboard with return on investment metrics. It provides information about internal rate of return, investment type, deal size, asset type, Pitch your topic with ease and precision using this Asset Assessment Dashboard With ROI Metrics Topics PDF. This layout presents information on Investment Amount, Asset Valuation, Internal Return. It is also available for immediate download and adjustment. So, changes can be made in the color, design, graphics or any other component to create a unique layout.
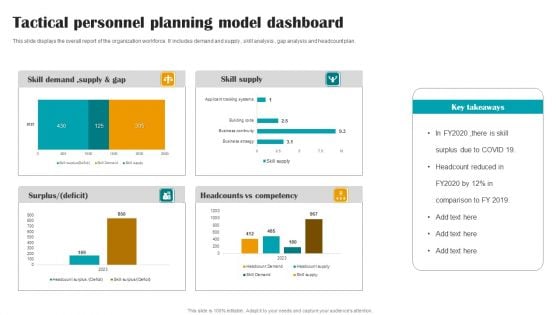
Tactical Personnel Planning Model Dashboard Pictures PDF
This slide displays the overall report of the organization workforce. It includes demand and supply , skill analysis , gap analysis and headcount plan. Showcasing this set of slides titled Tactical Personnel Planning Model Dashboard Pictures PDF. The topics addressed in these templates are Tactical Personnel Planning, Model Dashboard. All the content presented in this PPT design is completely editable. Download it and make adjustments in color, background, font etc. as per your unique business setting.
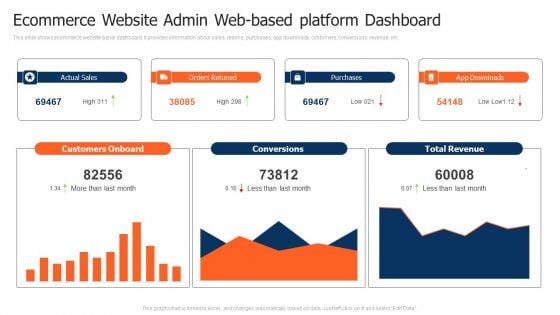
Ecommerce Website Admin Web Based Platform Dashboard Pictures PDF
This slide shows ecommerce website panel dashboard. It provides information about sales, returns, purchases, app downloads, customers, conversions, revenue, etc. Pitch your topic with ease and precision using this Ecommerce Website Admin Web Based Platform Dashboard Pictures PDF. This layout presents information on Customers Onboard, Purchases, Total Revenue. It is also available for immediate download and adjustment. So, changes can be made in the color, design, graphics or any other component to create a unique layout.
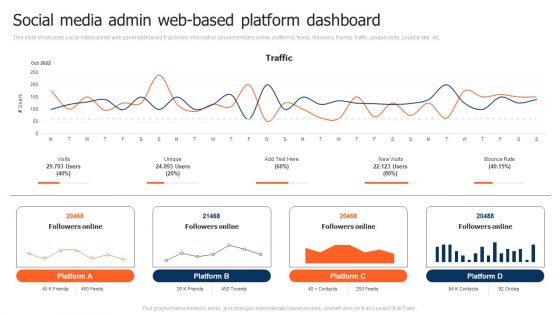
Social Media Admin Web Based Platform Dashboard Demonstration PDF
This slide showcases social media admin web panel dashboard. It provides information about members online, platforms, feeds, followers, friends, traffic, unique visits, bounce rate, etc. Showcasing this set of slides titled Social Media Admin Web Based Platform Dashboard Demonstration PDF. The topics addressed in these templates are Social Media Admin, Web Based Platform Dashboard. All the content presented in this PPT design is completely editable. Download it and make adjustments in color, background, font etc. as per your unique business setting.
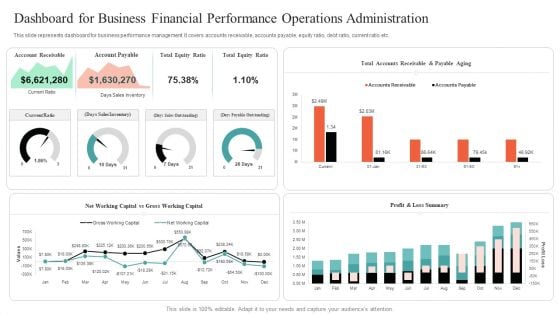
Dashboard For Business Financial Performance Operations Administration Mockup PDF
This slide represents dashboard for business performance management. It covers accounts receivable, accounts payable, equity ratio, debt ratio, current ratio etc. Showcasing this set of slides titled Dashboard For Business Financial Performance Operations Administration Mockup PDF. The topics addressed in these templates are Dashboard For Business Financial, Performance Operations Administration. All the content presented in this PPT design is completely editable. Download it and make adjustments in color, background, font etc. as per your unique business setting.
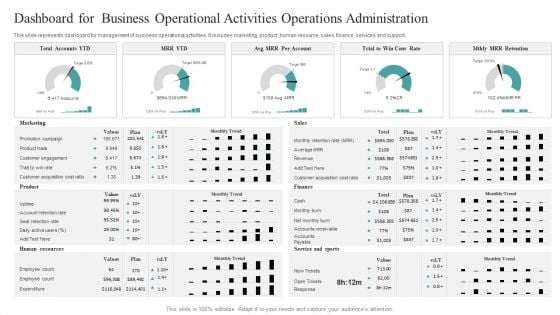
Dashboard For Business Operational Activities Operations Administration Designs PDF
This slide represents dashboard for management of business operational activities. It includes marketing, product, human resource, sales, finance, services and support. Pitch your topic with ease and precision using this Dashboard For Business Operational Activities Operations Administration Designs PDF. This layout presents information on Marketing, Product, Human Resources. It is also available for immediate download and adjustment. So, changes can be made in the color, design, graphics or any other component to create a unique layout.
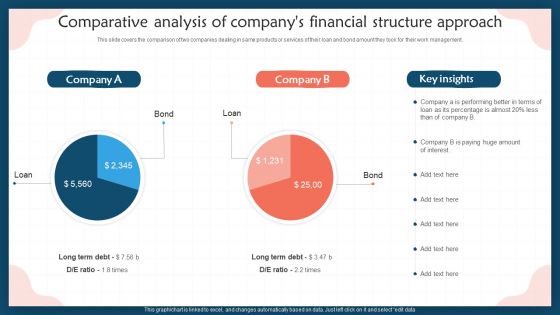
Comparative Analysis Of Companys Financial Structure Approach Inspiration PDF
This slide covers the comparison of two companies dealing in same products or services of their loan and bond amount they took for their work management. Pitch your topic with ease and precision using this Comparative Analysis Of Companys Financial Structure Approach Inspiration PDF. This layout presents information on Comparative Analysis, Companys Financial Structure Approach. It is also available for immediate download and adjustment. So, changes can be made in the color, design, graphics or any other component to create a unique layout.
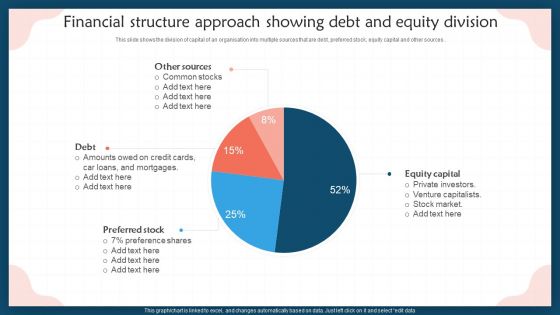
Financial Structure Approach Showing Debt And Equity Division Introduction PDF
This slide shows the division of capital of an organisation into multiple sources that are debt, preferred stock, equity capital and other sources . Pitch your topic with ease and precision using this Financial Structure Approach Showing Debt And Equity Division Introduction PDF. This layout presents information on Other Sources, Preferred Stock, Equity Capital, Debt. It is also available for immediate download and adjustment. So, changes can be made in the color, design, graphics or any other component to create a unique layout.
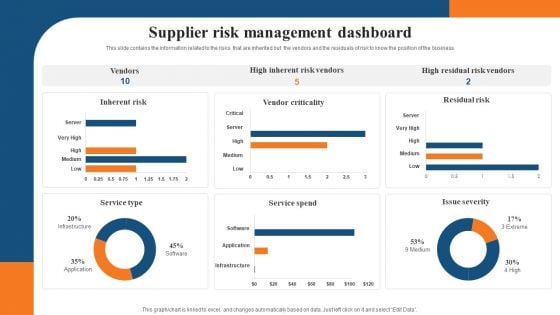
Supplier Risk Management Dashboard Introduction PDF
This slide contains the information related to the risks that are inherited but the vendors and the residuals of risk to know the position of the business. Showcasing this set of slides titled Supplier Risk Management Dashboard Introduction PDF. The topics addressed in these templates are Service Spend, Inherent Risk, Risk Vendors. All the content presented in this PPT design is completely editable. Download it and make adjustments in color, background, font etc. as per your unique business setting.
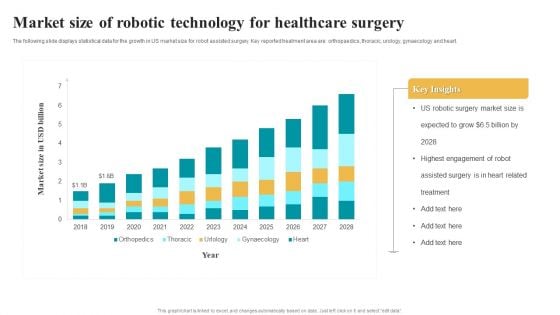
Market Size Of Robotic Technology For Healthcare Surgery Summary PDF
The following slide displays statistical data for the growth in US market size for robot assisted surgery. Key reported treatment area are orthopaedics, thoracic, urology, gynaecology and heart.Showcasing this set of slides titled Market Size Of Robotic Technology For Healthcare Surgery Summary PDF. The topics addressed in these templates are Robotic Surgery, Highest Engagement, Assisted Surgery. All the content presented in this PPT design is completely editable. Download it and make adjustments in color, background, font etc. as per your unique business setting.
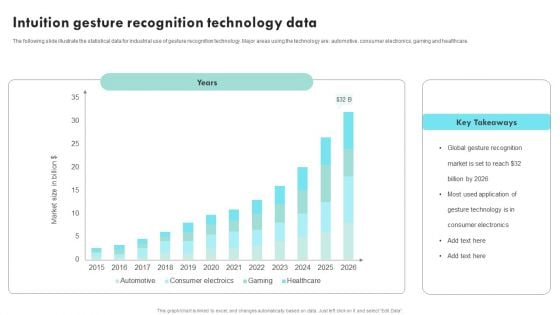
Intuition Gesture Recognition Technology Data Ppt Pictures Grid PDF
The following slide illustrate the statistical data for industrial use of gesture recognition technology. Major areas using the technology are automotive, consumer electronics, gaming and healthcare. Showcasing this set of slides titled Intuition Gesture Recognition Technology Data Ppt Pictures Grid PDF. The topics addressed in these templates are Global Gesture Recognition, Gesture Technology, Consumer Electronics. All the content presented in this PPT design is completely editable. Download it and make adjustments in color, background, font etc. as per your unique business setting.
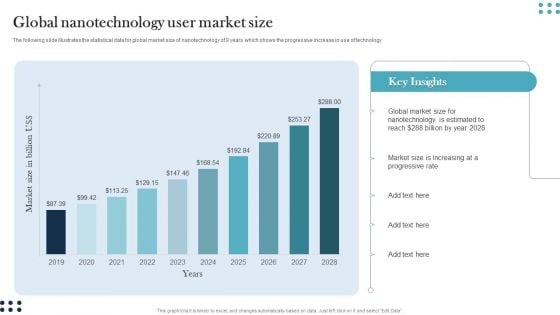
Global Nanotechnology User Market Size Guidelines PDF
The following slide illustrates the statistical data for global market size of nanotechnology of 9 years which shows the progressive increase in use of technology. Pitch your topic with ease and precision using this Global Nanotechnology User Market Size Guidelines PDF. This layout presents information on Global Market Size, Nanotechnology, Estimated To Reach. It is also available for immediate download and adjustment. So, changes can be made in the color, design, graphics or any other component to create a unique layout.
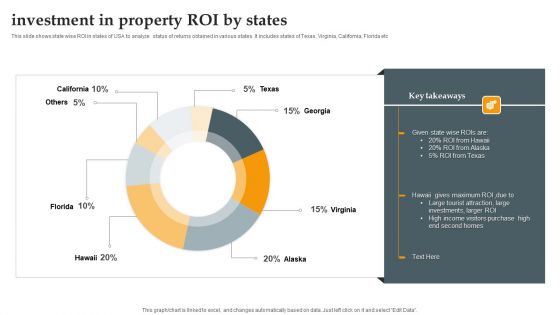
Investment In Property ROI By States Background PDF
This slide shows state wise ROI in states of USA to analyze status of returns obtained in various states. It includes states of Texas, Virginia, California, Florida etc. Showcasing this set of slides titled Investment In Property ROI By States Background PDF. The topics addressed in these templates are High Income, Investments, Larger ROI. All the content presented in this PPT design is completely editable. Download it and make adjustments in color, background, font etc. as per your unique business setting.
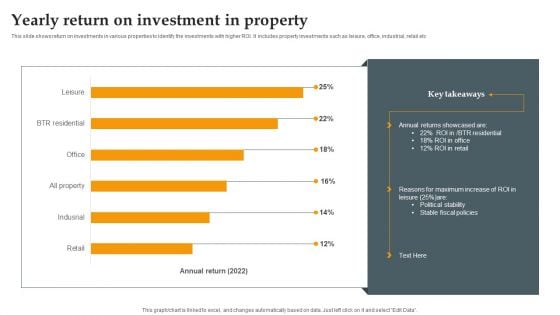
Yearly Return On Investment In Property Guidelines PDF
This slide shows return on investments in various properties to identify the investments with higher ROI. It includes property investments such as leisure, office, industrial, retail etc. Showcasing this set of slides titled Yearly Return On Investment In Property Guidelines PDF. The topics addressed in these templates are Yearly Return, Investment In Property. All the content presented in this PPT design is completely editable. Download it and make adjustments in color, background, font etc. as per your unique business setting.
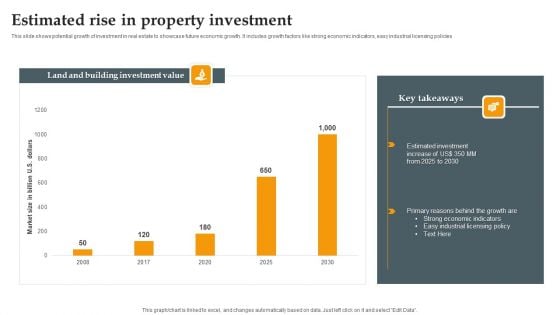
Estimated Rise In Property Investment Introduction PDF
This slide shows potential growth of investment in real estate to showcase future economic growth. It includes growth factors like strong economic indicators, easy industrial licensing policies. Showcasing this set of slides titled Estimated Rise In Property Investment Introduction PDF. The topics addressed in these templates are Estimated Investment, Strong Economic Indicators, Growth. All the content presented in this PPT design is completely editable. Download it and make adjustments in color, background, font etc. as per your unique business setting.
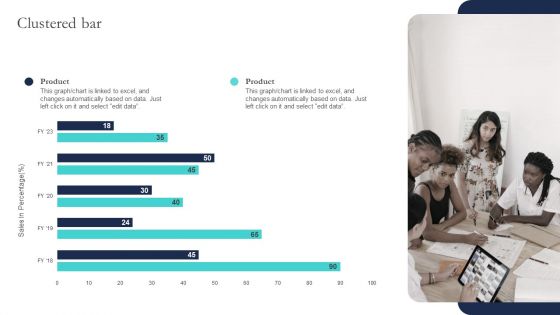
Optimizing Smart Pricing Tactics To Improve Sales Clustered Bar Professional PDF
Take your projects to the next level with our ultimate collection of Optimizing Smart Pricing Tactics To Improve Sales Clustered Bar Professional PDF. Slidegeeks has designed a range of layouts that are perfect for representing task or activity duration, keeping track of all your deadlines at a glance. Tailor these designs to your exact needs and give them a truly corporate look with your own brand colors they will make your projects stand out from the rest.
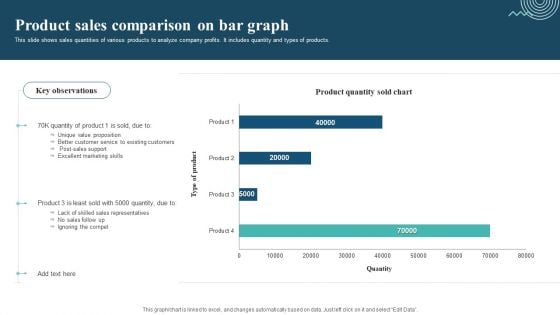
Product Sales Comparison On Bar Graph Sample PDF
This slide shows sales quantities of various products to analyze company profits. It includes quantity and types of products. Pitch your topic with ease and precision using this Product Sales Comparison On Bar Graph Sample PDF. This layout presents information on Unique Value Proposition, Excellent Marketing Skills, Ignoring The Compet. It is also available for immediate download and adjustment. So, changes can be made in the color, design, graphics or any other component to create a unique layout.
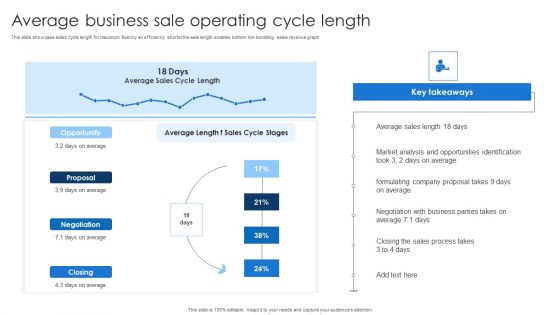
Average Business Sale Operating Cycle Length Ideas PDF
This slide showcase sales cycle length for maximum fluency an efficiency shorter the sale length enables bottom line boosting sales revenue graph.Showcasing this set of slides titled Average Business Sale Operating Cycle Length Ideas PDF. The topics addressed in these templates are Average Sales, Opportunities Identification, Negotiation Business. All the content presented in this PPT design is completely editable. Download it and make adjustments in color, background, font etc. as per your unique business setting.
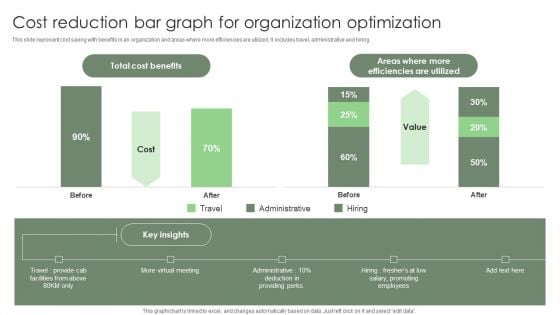
Cost Reduction Bar Graph For Organization Optimization Ppt Inspiration Vector PDF
This slide represent cost saving with benefits in an organization and areas where more efficiencies are utilized. It includes travel, administrative and hiring. Pitch your topic with ease and precision using this Cost Reduction Bar Graph For Organization Optimization Ppt Inspiration Vector PDF. This layout presents information on Total Cost Benefits, Promoting Employees, Providing Perks. It is also available for immediate download and adjustment. So, changes can be made in the color, design, graphics or any other component to create a unique layout.
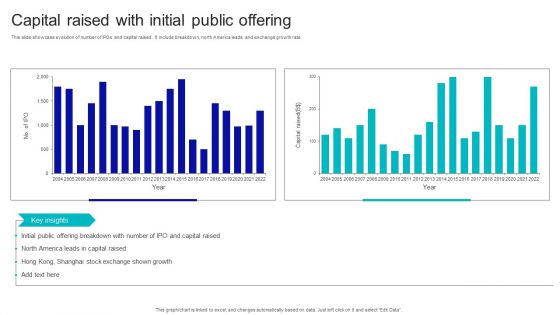
Capital Raised With Initial Public Offering Download PDF
This slide showcase evolution of number of IPOs and capital raised . It include breakdown, north America leads and exchange growth rate. Showcasing this set of slides titled Capital Raised With Initial Public Offering Download PDF. The topics addressed in these templates are Capital Raised, With Initial, Public Offering. All the content presented in this PPT design is completely editable. Download it and make adjustments in color, background, font etc. as per your unique business setting.
Employees Attrition Tracking Rate Stats Summary Report By Departments Slides PDF
This slide illustrates employees quarterly turnover rates for different departments. It also includes turnover rates on the basis of distinct positions and duration of retention in company. Showcasing this set of slides titled Employees Attrition Tracking Rate Stats Summary Report By Departments Slides PDF. The topics addressed in these templates are Employee Turnover, Involuntary. All the content presented in this PPT design is completely editable. Download it and make adjustments in color, background, font etc. as per your unique business setting.
HR Manager KPI Dashboard With Employee Attrition Tracking Report Brochure PDF
This slide covers performance key indicators for HR manager. It also indicates employee turnover count, new recruitment, retention, training and development of new employees. Showcasing this set of slides titled HR Manager KPI Dashboard With Employee Attrition Tracking Report Brochure PDF. The topics addressed in these templates are Recruitment, Employee Turnover, Development. All the content presented in this PPT design is completely editable. Download it and make adjustments in color, background, font etc. as per your unique business setting.
Parameters Impacting Employee Attrition Tracking Rates Report Sample PDF
This slide depicts key reasons for employee turnover rate. It includes career development, work-life balance, management behaviour, compensation, wellbeing, job characteristics, work environment, relocation and retirement. Showcasing this set of slides titled Parameters Impacting Employee Attrition Tracking Rates Report Sample PDF. The topics addressed in these templates are Parameters Impacting Employee, Attrition Tracking Rates Report. All the content presented in this PPT design is completely editable. Download it and make adjustments in color, background, font etc. as per your unique business setting.
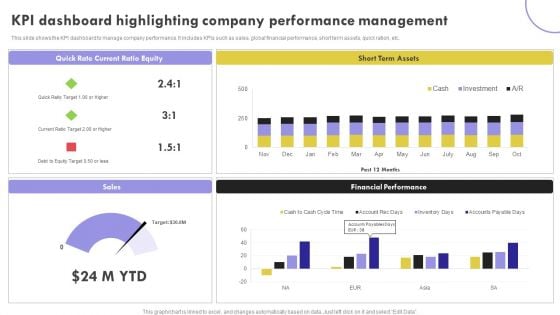
KPI Dashboard Highlighting Company Performance Management Inspiration PDF
This slide shows the KPI dashboard to manage company performance. It includes KPIs such as sales, global financial performance, short term assets, quick ration, etc.Showcasing this set of slides titled KPI Dashboard Highlighting Company Performance Management Inspiration PDF. The topics addressed in these templates are Current Ratio, Term Assets, Financial Performance. All the content presented in this PPT design is completely editable. Download it and make adjustments in color, background, font etc. as per your unique business setting.
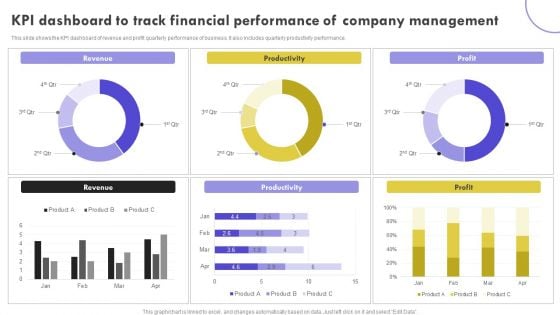
KPI Dashboard To Track Financial Performance Of Company Management Clipart PDF
This slide shows the KPI dashboard of revenue and profit quarterly performance of business. It also includes quarterly productivity performance. Pitch your topic with ease and precision using this KPI Dashboard To Track Financial Performance Of Company Management Clipart PDF. This layout presents information on Revenue, Productivity, Profit. It is also available for immediate download and adjustment. So, changes can be made in the color, design, graphics or any other component to create a unique layout.
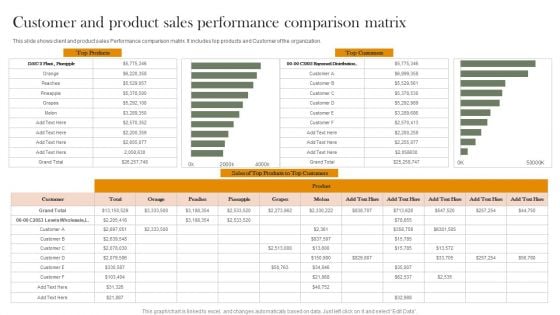
Customer And Product Sales Performance Comparison Matrix Introduction PDF
This slide shows client and product sales Performance comparison matrix. It includes top products and Customer of the organization. Showcasing this set of slides titled Customer And Product Sales Performance Comparison Matrix Introduction PDF. The topics addressed in these templates are Top Products, Top Customers, Sales. All the content presented in this PPT design is completely editable. Download it and make adjustments in color, background, font etc. as per your unique business setting.

KPI Dashboard Of Customer And Product Sales Performance Comparison Information PDF
This slide shows the KPI dashboard of client and product sales comparison. It also includes sales by location and total sales. Pitch your topic with ease and precision using this KPI Dashboard Of Customer And Product Sales Performance Comparison Information PDF. This layout presents information on Product Sales, Client Sales, Tim Santana. It is also available for immediate download and adjustment. So, changes can be made in the color, design, graphics or any other component to create a unique layout.
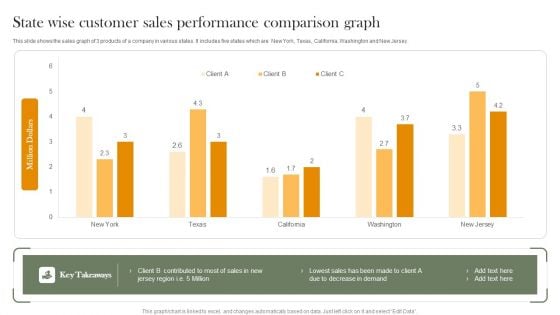
State Wise Customer Sales Performance Comparison Graph Introduction PDF
This slide shows the sales graph of 3 products of a company in various states. It includes five states which are New York, Texas, California, Washington and New Jersey. Showcasing this set of slides titled State Wise Customer Sales Performance Comparison Graph Introduction PDF. The topics addressed in these templates are Lowest Sales, Decrease Demand. All the content presented in this PPT design is completely editable. Download it and make adjustments in color, background, font etc. as per your unique business setting.
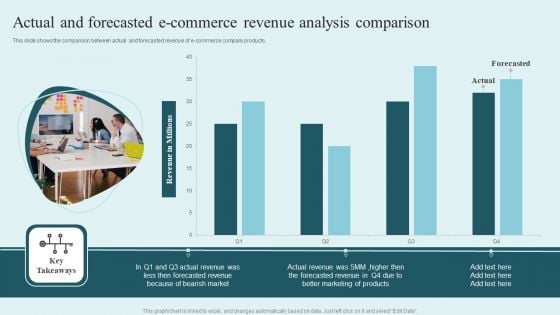
Actual And Forecasted E Commerce Revenue Analysis Comparison Clipart PDF
This slide shows the comparison between actual and forecasted revenue of e-commerce company products. Showcasing this set of slides titled Actual And Forecasted E Commerce Revenue Analysis Comparison Clipart PDF. The topics addressed in these templates are Actual Revenue, Forecasted Revenue, Bearish Market. All the content presented in this PPT design is completely editable. Download it and make adjustments in color, background, font etc. as per your unique business setting.
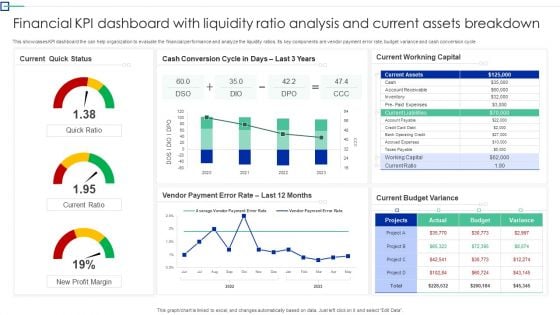
Financial KPI Dashboard With Liquidity Ratio Analysis And Current Assets Breakdown Ideas PDF
This showcases KPI dashboard the can help organization to evaluate the financial performance and analyze the liquidity ratios. Its key components are vendor payment error rate, budget variance and cash conversion cycle. Showcasing this set of slides titled. The topics addressed in these templates are Quick Status, Workning Capital, Budget Variance. All the content presented in this PPT design is completely editable. Download it and make adjustments in color, background, font etc. as per your unique business setting.
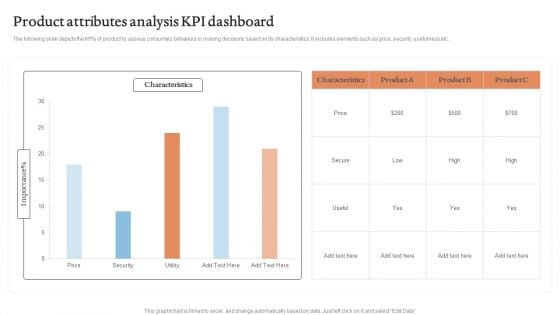
Product Attributes Analysis KPI Dashboard Graphics PDF
The following slide depicts the KPIs of product to assess consumers behaviour in making decisions based on its characteristics. It includes elements such as price, security, usefulness etc.Showcasing this set of slides titled Product Attributes Analysis KPI Dashboard Graphics PDF. The topics addressed in these templates are Characteristics, Product Attributes, Analysis KPI Dashboard. All the content presented in this PPT design is completely editable. Download it and make adjustments in color, background, font etc. as per your unique business setting.

 Home
Home